| Param | Original file | Final file |
|---|---|---|
| Filename | modeM0/AS1A09_146T01_9000005142cztM0_level2.fits | modeM0/AS1A09_146T01_9000005142cztM0_level2_quad_clean.evt |
| Size (bytes) | 879,978,240 | 853,879,680 |
| Size | 839.2 MB | 814.3 MB |
| Events in quadrant A | 4,983,204 | 4,565,288 |
| Events in quadrant B | 5,226,386 | 5,312,118 |
| Events in quadrant C | 5,361,970 | 5,059,094 |
| Events in quadrant D | 4,569,966 | 4,422,509 |
| Mode SS | |||
|---|---|---|---|
| Quadrant | BADHDUFLAG | Total packets | Discarded packets |
| A | 0 | 1940 | 0 |
| B | 0 | 1940 | 0 |
| C | 0 | 1940 | 0 |
| D | 0 | 1940 | 0 |
| Mode M0 | |||
|---|---|---|---|
| Quadrant | BADHDUFLAG | Total packets | Discarded packets |
| A | 0 | 303346 | 0 |
| B | 0 | 227564 | 0 |
| C | 0 | 213403 | 0 |
| D | 0 | 278241 | 0 |
| Mode M9 | |||
|---|---|---|---|
| Quadrant | BADHDUFLAG | Total packets | Discarded packets |
| A | 0 | 329 | 0 |
| B | 0 | 329 | 0 |
| C | 0 | 329 | 0 |
| D | 0 | 329 | 0 |
| Quadrant | Total seconds | Saturated seconds | Saturation percentage |
|---|---|---|---|
| A | 94810 | 13917 | 14.678831% |
| B | 94810 | 1982 | 2.090497% |
| C | 94810 | 1375 | 1.450269% |
| D | 94810 | 5828 | 6.147031% |
Noise dominated data is calculated using 1-second bins in cleaned event files. If a bin has >2000 counts, and if more than 50% of those come from <1% of pixels, then it is considered to be noise-dominated and hence unusable.
| Quadrant | # 1 sec bins | Bins with >0 counts | Bins with >2000 counts | High rate bins dominated by noise | Noise dominated (total time) | Noise dominated (detector-on time) | Marked lightcurve |
|---|---|---|---|---|---|---|---|
| A | 127845 | 93301 | 0 | 0 | 0.00% | 0.00% |  |
| B | 127845 | 94770 | 0 | 0 | 0.00% | 0.00% |  |
| C | 127845 | 94772 | 0 | 0 | 0.00% | 0.00% |  |
| D | 127845 | 94688 | 0 | 0 | 0.00% | 0.00% |  |
Top three noisy pixels from each quadrant. If the there are fewer than three noisy pixels in the level2.evt file, extra rows are filled as -1
| Pixel properties | Quadrant properties | ||||||
|---|---|---|---|---|---|---|---|
| Quadrant | DetID | PixID | Counts | Sigma | Mean | Median | Sigma |
| A | 7 | 110 | 4051 | 8.86 | 1302 | 1225 | 318.9 |
| A | 9 | 19 | 3961 | 8.58 | 1302 | 1225 | 318.9 |
| A | 0 | 29 | 3948 | 8.54 | 1302 | 1225 | 318.9 |
| B | 2 | 9 | 4566 | 11.75 | 1387 | 1325 | 275.8 |
| B | 3 | 80 | 4118 | 10.13 | 1387 | 1325 | 275.8 |
| B | 2 | 8 | 3734 | 8.73 | 1387 | 1325 | 275.8 |
| C | 1 | 81 | 4469 | 8.57 | 1418 | 1326 | 366.8 |
| C | 1 | 80 | 4377 | 8.32 | 1418 | 1326 | 366.8 |
| C | 3 | 202 | 4104 | 7.57 | 1418 | 1326 | 366.8 |
| D | 7 | 3 | 3437 | 6.42 | 1310 | 1194 | 349.6 |
| D | 4 | 160 | 3427 | 6.39 | 1310 | 1194 | 349.6 |
| D | 10 | 113 | 3303 | 6.03 | 1310 | 1194 | 349.6 |
Histogram calculated using DETX and DETY for each event in the final _common_clean file
| Quadrant A |  |
 |
Quadrant B |
|---|---|---|---|
| Quadrant D | 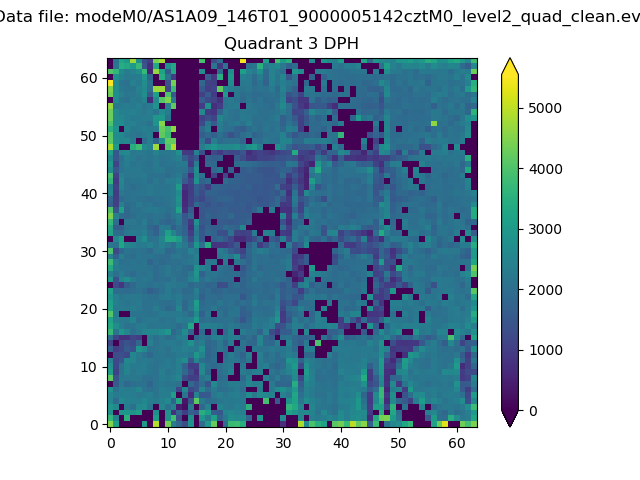 |
 |
Quadrant C |
| Plot type | Count rate plots | Images |
|---|---|---|
| Comparison with Poisson distribution Blue bars denote a histogram of data divided into 1 sec bins. Red curve is a Poisson curve with rate = median count rate of data. |
 |
 |
| Quadrant-wise count rates Data is divided into 100 sec bins |
 |
|
| Module-wise count rates for Quadrant A Data is divided into 100 sec bins |
 |
 |
| Module-wise count rates for Quadrant B Data is divided into 100 sec bins |
 |
 |
| Module-wise count rates for Quadrant C Data is divided into 100 sec bins |
 |
 |
| Module-wise count rates for Quadrant D Data is divided into 100 sec bins |
 |
 |
| Parameter | Plot |
|---|---|
| CZT HV Monitor |  |
| D_VDD |  |
| Temperature 1 |  |
| Veto HV Monitor |  |
| Veto LLD | 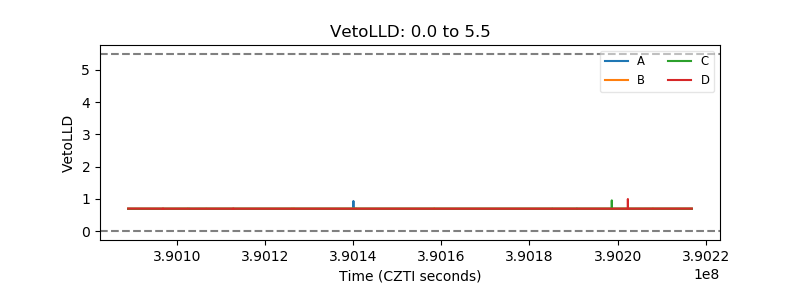 |
| Alpha Counter |  |
| _CPM_Rate |  |
| CZT Counter |  |
| +2.5 Volts monitor |  |
| +5 Volts monitor |  |
| _ROLL_ROT |  |
| _Roll_DEC | 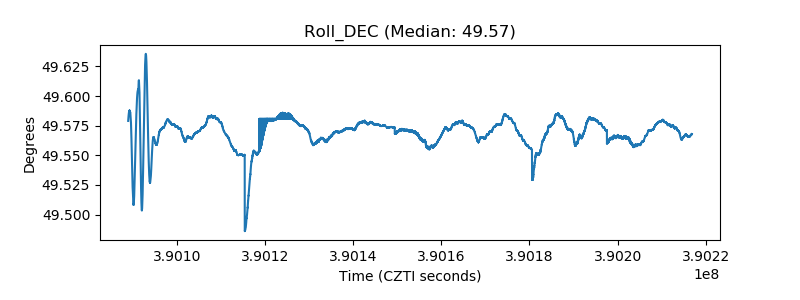 |
| _Roll_RA |  |
| Veto Counter |  |