| Param | Original file | Final file |
|---|---|---|
| Filename | modeM0/AS1A09_146T01_9000005142_35817cztM0_level2.evt | modeM0/AS1A09_146T01_9000005142_35817cztM0_level2_quad_clean.evt |
| Size (bytes) | 513,538,560 | 74,024,640 |
| Size | 489.7 MB | 70.6 MB |
| Events in quadrant A | 3,254,066 | 477,727 |
| Events in quadrant B | 3,187,628 | 480,437 |
| Events in quadrant C | 3,164,292 | 466,241 |
| Events in quadrant D | 5,550,262 | 408,408 |
| Mode SS | |||
|---|---|---|---|
| Quadrant | BADHDUFLAG | Total packets | Discarded packets |
| A | 0 | 116 | 0 |
| B | 0 | 116 | 0 |
| C | 0 | 116 | 0 |
| D | 0 | 116 | 0 |
| Mode M0 | |||
|---|---|---|---|
| Quadrant | BADHDUFLAG | Total packets | Discarded packets |
| A | 0 | 13449 | 3 |
| B | 0 | 13404 | 2 |
| C | 0 | 13070 | 2 |
| D | 0 | 20495 | 2 |
| Mode M9 | |||
|---|---|---|---|
| Quadrant | BADHDUFLAG | Total packets | Discarded packets |
| A | 0 | 23 | 0 |
| B | 0 | 23 | 0 |
| C | 0 | 23 | 0 |
| D | 0 | 24 | 0 |
| Quadrant | Total seconds | Saturated seconds | Saturation percentage |
|---|---|---|---|
| A | 5852 | 92 | 1.572112% |
| B | 5852 | 44 | 0.751880% |
| C | 5852 | 141 | 2.409433% |
| D | 5852 | 817 | 13.961039% |
Noise dominated data is calculated using 1-second bins in cleaned event files. If a bin has >2000 counts, and if more than 50% of those come from <1% of pixels, then it is considered to be noise-dominated and hence unusable.
| Quadrant | # 1 sec bins | Bins with >0 counts | Bins with >2000 counts | High rate bins dominated by noise | Noise dominated (total time) | Noise dominated (detector-on time) | Marked lightcurve |
|---|---|---|---|---|---|---|---|
| A | 7165 | 5854 | 76 | 76 | 1.06% | 1.30% | 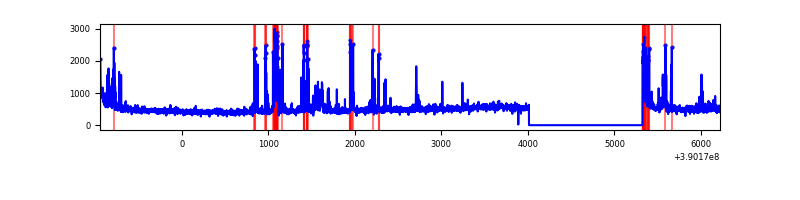 |
| B | 7165 | 5854 | 13 | 13 | 0.18% | 0.22% | 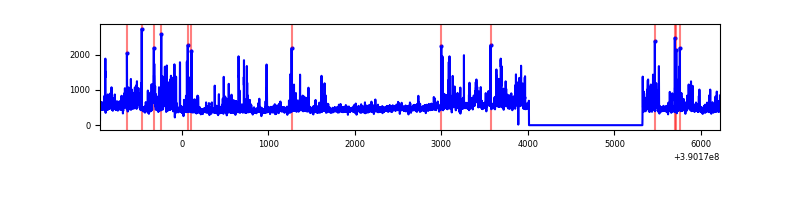 |
| C | 7165 | 5854 | 133 | 133 | 1.86% | 2.27% | 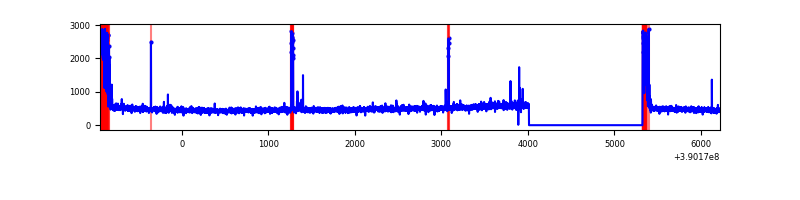 |
| D | 7165 | 5853 | 770 | 770 | 10.75% | 13.16% | 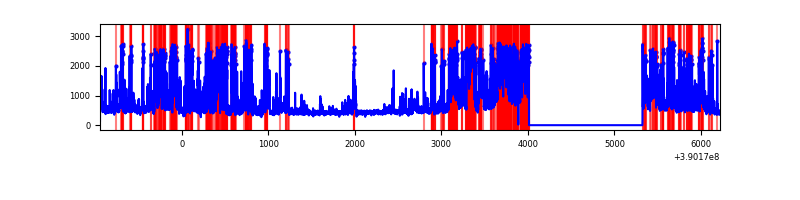 |
Top three noisy pixels from each quadrant. If the there are fewer than three noisy pixels in the level2.evt file, extra rows are filled as -1
| Pixel properties | Quadrant properties | ||||||
|---|---|---|---|---|---|---|---|
| Quadrant | DetID | PixID | Counts | Sigma | Mean | Median | Sigma |
| A | 15 | 169 | 516878 | 3850.39 | 661 | 646 | 134.1 |
| A | 10 | 83 | 160331 | 1191.03 | 661 | 646 | 134.1 |
| A | 13 | 254 | 8755 | 60.48 | 661 | 646 | 134.1 |
| B | 0 | 213 | 258016 | 2030.73 | 660 | 641 | 126.7 |
| B | 5 | 172 | 171985 | 1351.93 | 660 | 641 | 126.7 |
| B | 4 | 232 | 51549 | 401.67 | 660 | 641 | 126.7 |
| C | 0 | 10 | 348565 | 2326.09 | 643 | 649 | 149.6 |
| C | 15 | 214 | 244040 | 1627.26 | 643 | 649 | 149.6 |
| C | 0 | 207 | 50559 | 333.69 | 643 | 649 | 149.6 |
| D | 2 | 250 | 1948442 | 12911.94 | 610 | 592 | 150.9 |
| D | 7 | 223 | 340616 | 2253.96 | 610 | 592 | 150.9 |
| D | 13 | 249 | 216715 | 1432.64 | 610 | 592 | 150.9 |
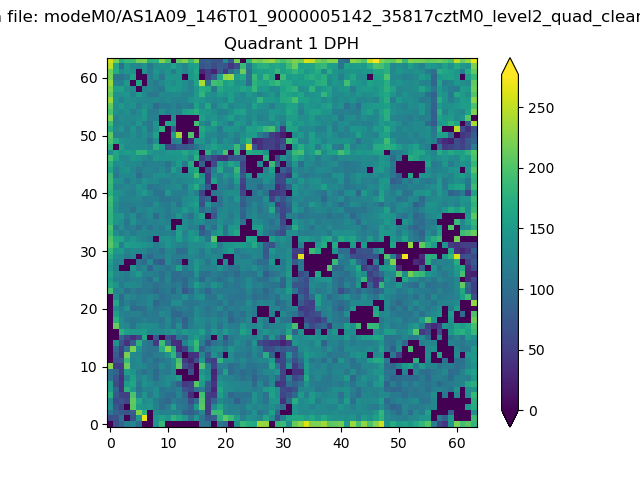
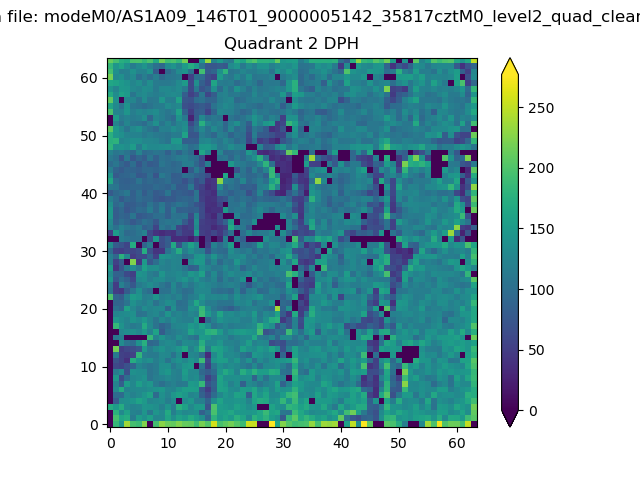
Histogram calculated using DETX and DETY for each event in the final _common_clean file
| Quadrant A |  |
 |
Quadrant B |
|---|---|---|---|
| Quadrant D | 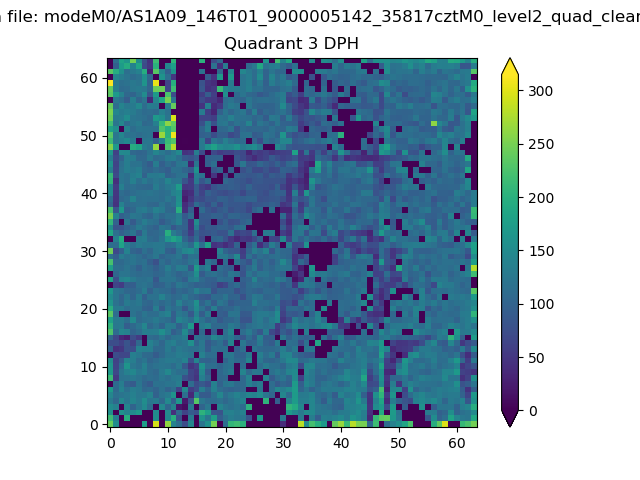 |
 |
Quadrant C |
| Plot type | Count rate plots | Images |
|---|---|---|
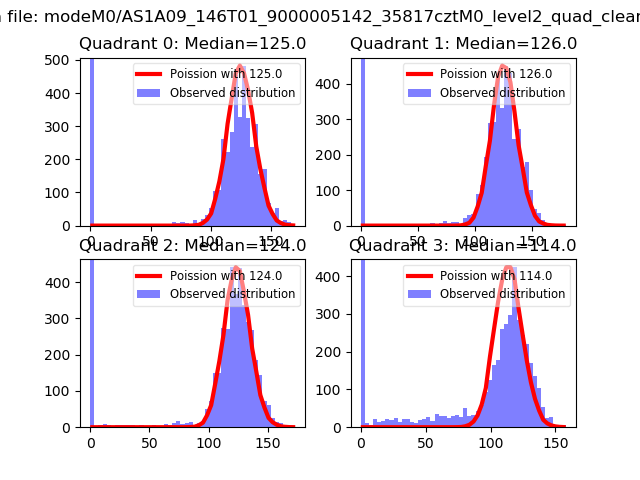
| Comparison with Poisson distribution Blue bars denote a histogram of data divided into 1 sec bins. Red curve is a Poisson curve with rate = median count rate of data. |
 |
 |
| Quadrant-wise count rates Data is divided into 100 sec bins |
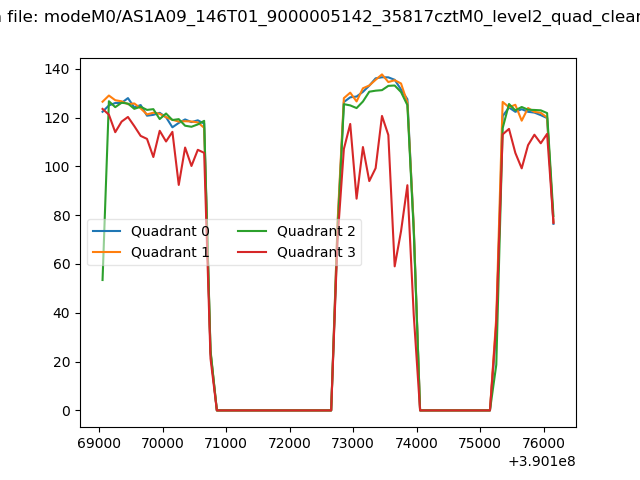 |
|
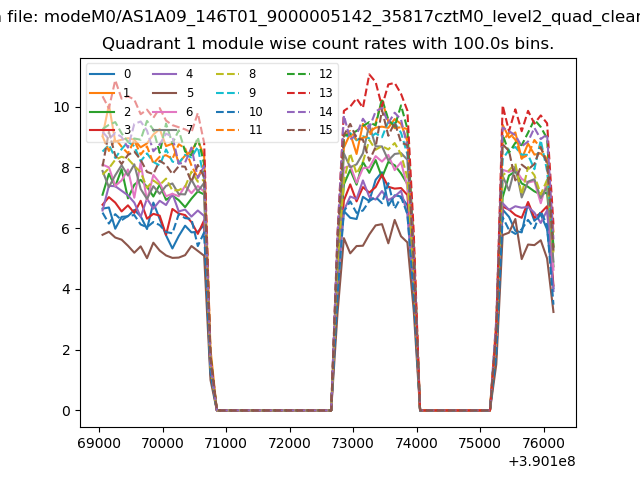
| Module-wise count rates for Quadrant A Data is divided into 100 sec bins |
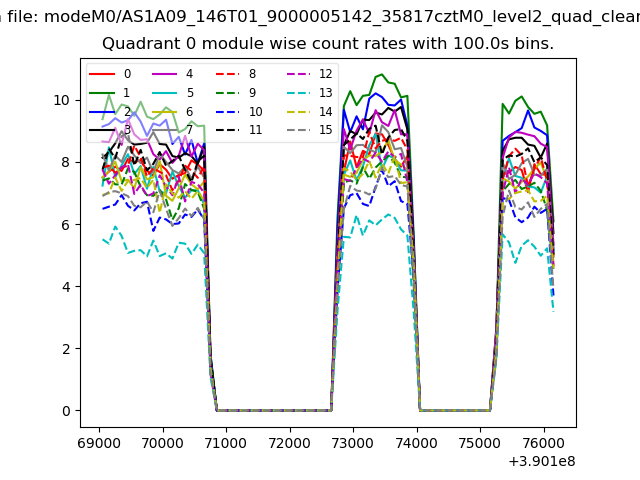 |
 |
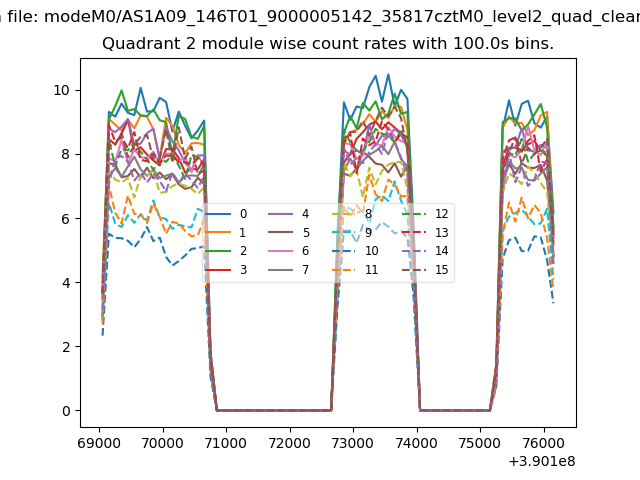
| Module-wise count rates for Quadrant B Data is divided into 100 sec bins |
 |
 |
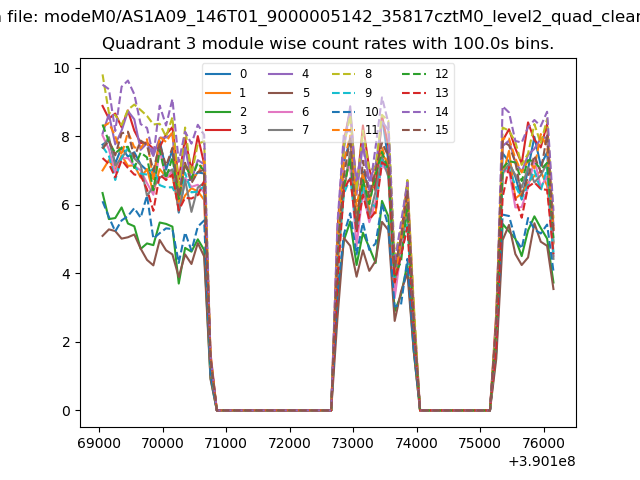
| Module-wise count rates for Quadrant C Data is divided into 100 sec bins |
 |
 |
| Module-wise count rates for Quadrant D Data is divided into 100 sec bins |
 |
 |
| Parameter | Plot |
|---|---|
| CZT HV Monitor | 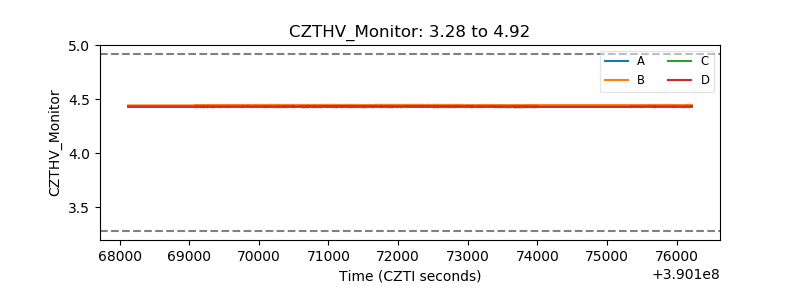 |
| D_VDD | 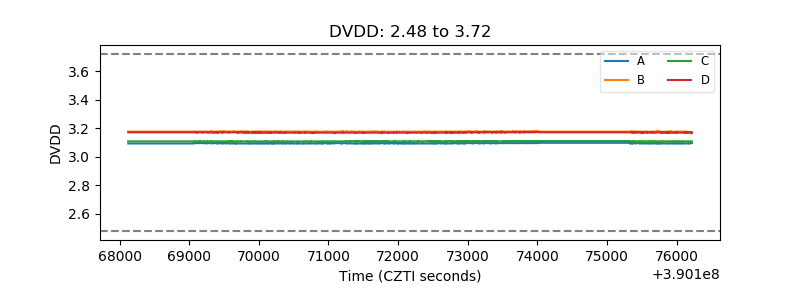 |
| Temperature 1 | 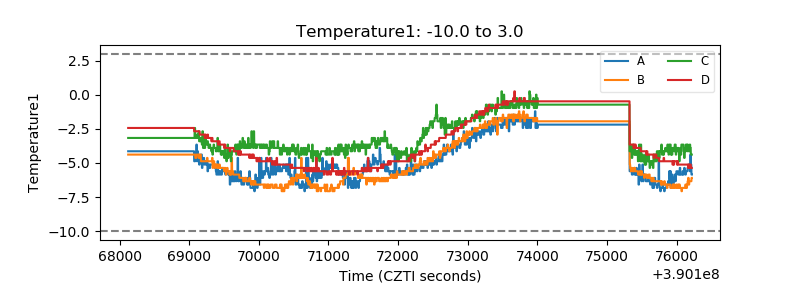 |
| Veto HV Monitor | 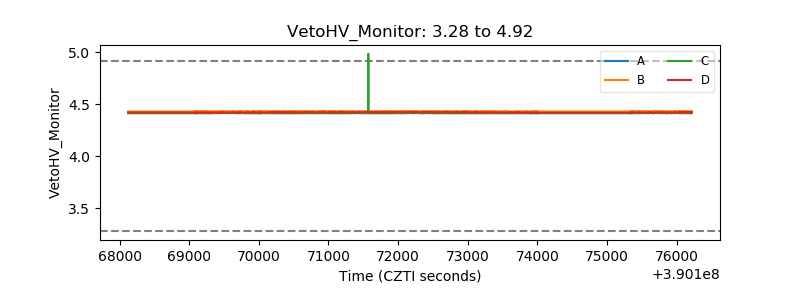 |
| Veto LLD | 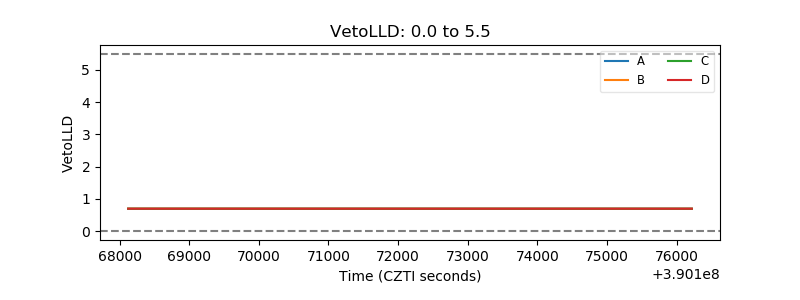 |
| Alpha Counter | 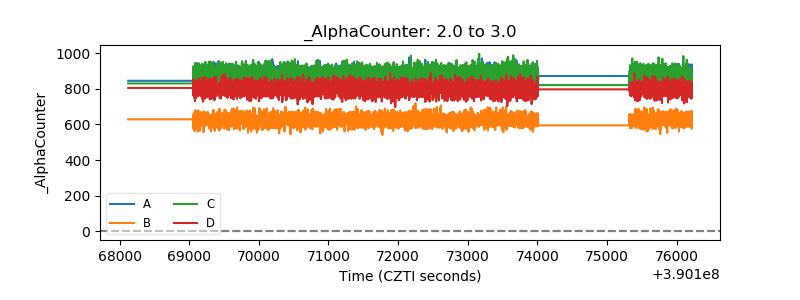 |
| _CPM_Rate | 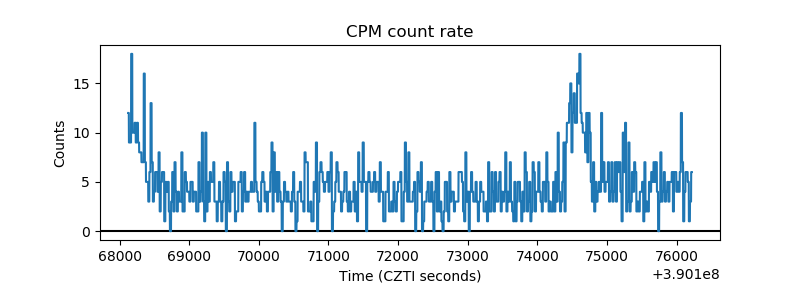 |
| CZT Counter | 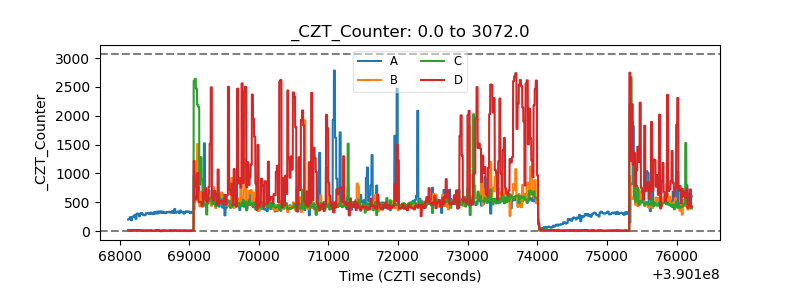 |
| +2.5 Volts monitor |  |
| +5 Volts monitor |  |
| _ROLL_ROT | 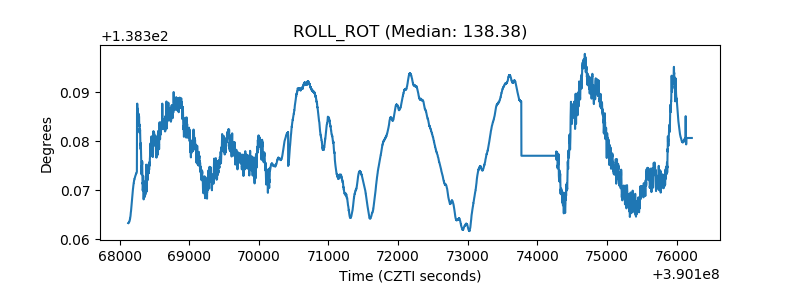 |
| _Roll_DEC | 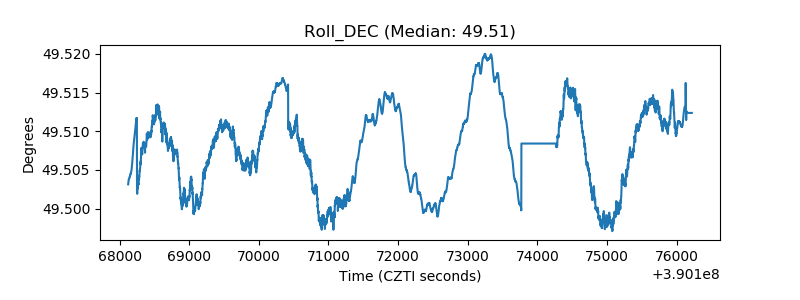 |
| _Roll_RA | 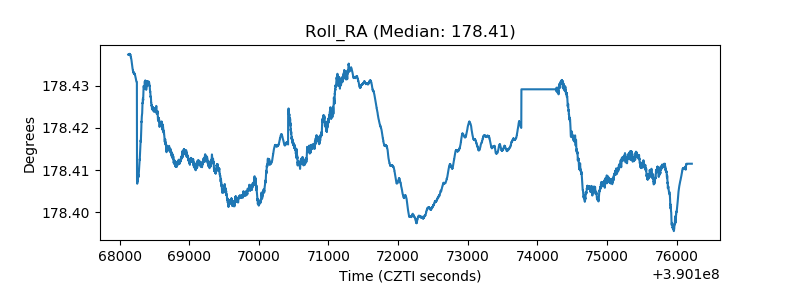 |
| Veto Counter | 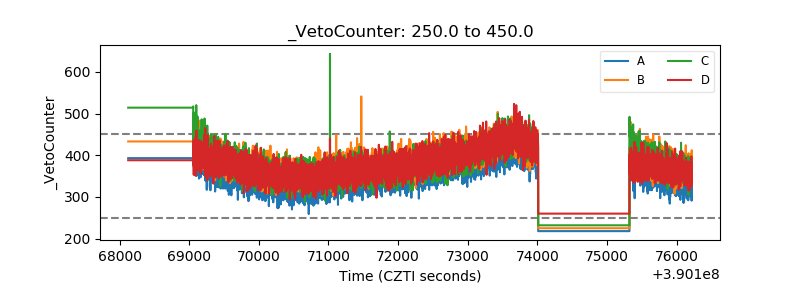 |