| Param | Original file | Final file |
|---|---|---|
| Filename | modeM0/AS1A10_071T19_9000005144cztM0_level2.fits | modeM0/AS1A10_071T19_9000005144cztM0_level2_quad_clean.evt |
| Size (bytes) | 353,453,760 | 294,552,000 |
| Size | 337.1 MB | 280.9 MB |
| Events in quadrant A | 2,044,498 | 1,422,641 |
| Events in quadrant B | 2,126,548 | 1,811,521 |
| Events in quadrant C | 2,182,132 | 1,740,649 |
| Events in quadrant D | 1,797,922 | 1,395,392 |
| Mode M0 | |||
|---|---|---|---|
| Quadrant | BADHDUFLAG | Total packets | Discarded packets |
| A | 0 | 129510 | 0 |
| B | 0 | 86841 | 0 |
| C | 0 | 80610 | 0 |
| D | 0 | 122322 | 0 |
| Mode M9 | |||
|---|---|---|---|
| Quadrant | BADHDUFLAG | Total packets | Discarded packets |
| A | 0 | 157 | 0 |
| B | 0 | 157 | 0 |
| C | 0 | 157 | 0 |
| D | 0 | 157 | 0 |
| Mode SS | |||
|---|---|---|---|
| Quadrant | BADHDUFLAG | Total packets | Discarded packets |
| A | 0 | 760 | 0 |
| B | 0 | 760 | 0 |
| C | 0 | 760 | 0 |
| D | 0 | 760 | 0 |
| Quadrant | Total seconds | Saturated seconds | Saturation percentage |
|---|---|---|---|
| A | 37099 | 6638 | 17.892666% |
| B | 37098 | 751 | 2.024368% |
| C | 37099 | 373 | 1.005418% |
| D | 37098 | 4368 | 11.774220% |
Noise dominated data is calculated using 1-second bins in cleaned event files. If a bin has >2000 counts, and if more than 50% of those come from <1% of pixels, then it is considered to be noise-dominated and hence unusable.
| Quadrant | # 1 sec bins | Bins with >0 counts | Bins with >2000 counts | High rate bins dominated by noise | Noise dominated (total time) | Noise dominated (detector-on time) | Marked lightcurve |
|---|---|---|---|---|---|---|---|
| A | 51082 | 36970 | 0 | 0 | 0.00% | 0.00% |  |
| B | 51082 | 37085 | 0 | 0 | 0.00% | 0.00% |  |
| C | 51082 | 37085 | 0 | 0 | 0.00% | 0.00% |  |
| D | 51082 | 36904 | 0 | 0 | 0.00% | 0.00% |  |
Top three noisy pixels from each quadrant. If the there are fewer than three noisy pixels in the level2.evt file, extra rows are filled as -1
| Pixel properties | Quadrant properties | ||||||
|---|---|---|---|---|---|---|---|
| Quadrant | DetID | PixID | Counts | Sigma | Mean | Median | Sigma |
| A | 9 | 19 | 1725 | 9.31 | 534 | 502 | 131.4 |
| A | 0 | 29 | 1677 | 8.94 | 534 | 502 | 131.4 |
| A | 7 | 110 | 1634 | 8.62 | 534 | 502 | 131.4 |
| B | 2 | 9 | 1785 | 11.13 | 563 | 538 | 112.1 |
| B | 3 | 80 | 1714 | 10.49 | 563 | 538 | 112.1 |
| B | 2 | 8 | 1477 | 8.38 | 563 | 538 | 112.1 |
| C | 1 | 81 | 1837 | 8.69 | 575 | 542 | 149.1 |
| C | 1 | 80 | 1821 | 8.58 | 575 | 542 | 149.1 |
| C | 3 | 202 | 1746 | 8.08 | 575 | 542 | 149.1 |
| D | 4 | 160 | 1355 | 6.48 | 514 | 471 | 136.3 |
| D | 6 | 38 | 1289 | 6.0 | 514 | 471 | 136.3 |
| D | 10 | 113 | 1285 | 5.97 | 514 | 471 | 136.3 |
Histogram calculated using DETX and DETY for each event in the final _common_clean file
| Quadrant A |  |
 |
Quadrant B |
|---|---|---|---|
| Quadrant D | 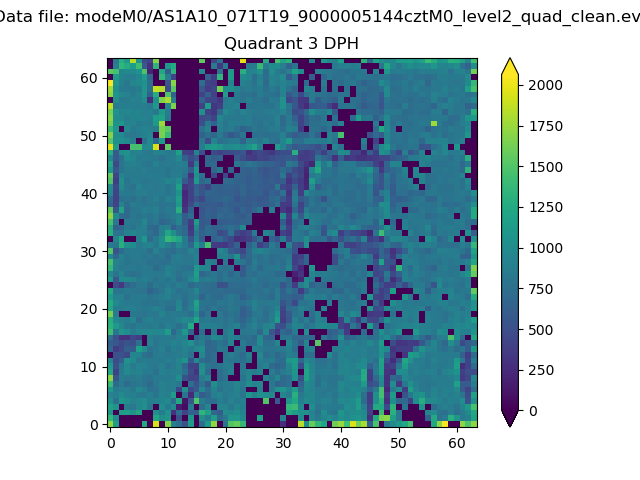 |
 |
Quadrant C |
| Plot type | Count rate plots | Images |
|---|---|---|
| Comparison with Poisson distribution Blue bars denote a histogram of data divided into 1 sec bins. Red curve is a Poisson curve with rate = median count rate of data. |
 |
 |
| Quadrant-wise count rates Data is divided into 100 sec bins |
 |
|
| Module-wise count rates for Quadrant A Data is divided into 100 sec bins |
 |
 |
| Module-wise count rates for Quadrant B Data is divided into 100 sec bins |
 |
 |
| Module-wise count rates for Quadrant C Data is divided into 100 sec bins |
 |
 |
| Module-wise count rates for Quadrant D Data is divided into 100 sec bins |
 |
 |
| Parameter | Plot |
|---|---|
| CZT HV Monitor |  |
| D_VDD |  |
| Temperature 1 |  |
| Veto HV Monitor |  |
| Veto LLD | 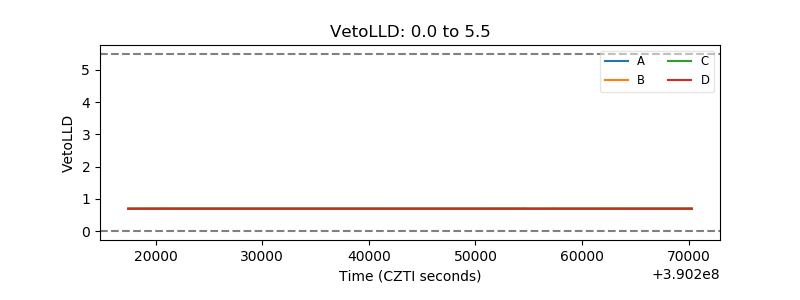 |
| Alpha Counter |  |
| _CPM_Rate |  |
| CZT Counter |  |
| +2.5 Volts monitor |  |
| +5 Volts monitor |  |
| _ROLL_ROT |  |
| _Roll_DEC |  |
| _Roll_RA |  |
| Veto Counter |  |