| Param | Original file | Final file |
|---|---|---|
| Filename | modeM0/AS1A10_071T19_9000005144_35835cztM0_level2.evt | modeM0/AS1A10_071T19_9000005144_35835cztM0_level2_quad_clean.evt |
| Size (bytes) | 744,269,760 | 70,248,960 |
| Size | 709.8 MB | 67.0 MB |
| Events in quadrant A | 11,186,396 | 266,870 |
| Events in quadrant B | 3,371,836 | 486,153 |
| Events in quadrant C | 3,360,377 | 477,029 |
| Events in quadrant D | 4,197,445 | 458,280 |
| Mode M0 | |||
|---|---|---|---|
| Quadrant | BADHDUFLAG | Total packets | Discarded packets |
| A | 0 | 37528 | 2 |
| B | 0 | 14101 | 2 |
| C | 0 | 13799 | 2 |
| D | 0 | 16786 | 2 |
| Mode M9 | |||
|---|---|---|---|
| Quadrant | BADHDUFLAG | Total packets | Discarded packets |
| A | 0 | 26 | 0 |
| B | 0 | 26 | 0 |
| C | 0 | 26 | 0 |
| D | 0 | 26 | 0 |
| Mode SS | |||
|---|---|---|---|
| Quadrant | BADHDUFLAG | Total packets | Discarded packets |
| A | 0 | 130 | 0 |
| B | 0 | 130 | 0 |
| C | 0 | 130 | 0 |
| D | 0 | 130 | 0 |
| Quadrant | Total seconds | Saturated seconds | Saturation percentage |
|---|---|---|---|
| A | 6265 | 3627 | 57.893057% |
| B | 6265 | 57 | 0.909816% |
| C | 6265 | 83 | 1.324820% |
| D | 6265 | 303 | 4.836393% |
Noise dominated data is calculated using 1-second bins in cleaned event files. If a bin has >2000 counts, and if more than 50% of those come from <1% of pixels, then it is considered to be noise-dominated and hence unusable.
| Quadrant | # 1 sec bins | Bins with >0 counts | Bins with >2000 counts | High rate bins dominated by noise | Noise dominated (total time) | Noise dominated (detector-on time) | Marked lightcurve |
|---|---|---|---|---|---|---|---|
| A | 8892 | 6267 | 3403 | 3403 | 38.27% | 54.30% | 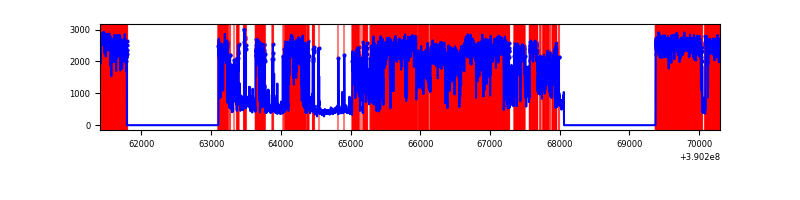 |
| B | 8892 | 6267 | 45 | 45 | 0.51% | 0.72% | 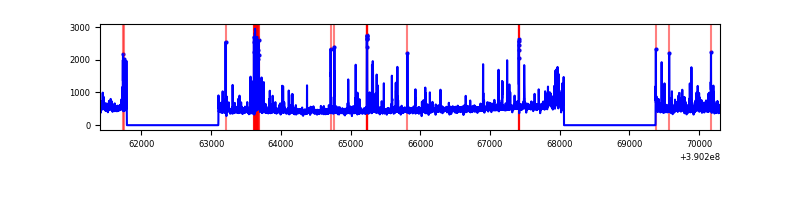 |
| C | 8892 | 6267 | 73 | 73 | 0.82% | 1.16% | 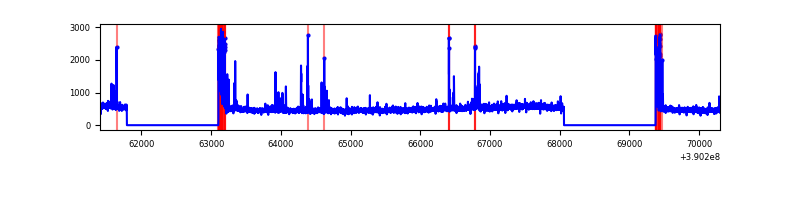 |
| D | 8892 | 6267 | 280 | 280 | 3.15% | 4.47% | 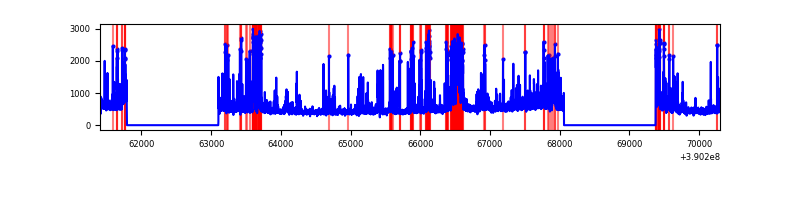 |
Top three noisy pixels from each quadrant. If the there are fewer than three noisy pixels in the level2.evt file, extra rows are filled as -1
| Pixel properties | Quadrant properties | ||||||
|---|---|---|---|---|---|---|---|
| Quadrant | DetID | PixID | Counts | Sigma | Mean | Median | Sigma |
| A | 15 | 169 | 9190819 | 94358.56 | 477 | 469 | 97.4 |
| A | 10 | 83 | 102057 | 1043.02 | 477 | 469 | 97.4 |
| A | 10 | 248 | 25400 | 255.97 | 477 | 469 | 97.4 |
| B | 5 | 255 | 140635 | 1010.88 | 718 | 700 | 138.4 |
| B | 5 | 172 | 121255 | 870.88 | 718 | 700 | 138.4 |
| B | 4 | 232 | 115007 | 825.74 | 718 | 700 | 138.4 |
| C | 15 | 214 | 259736 | 1568.16 | 704 | 707 | 165.2 |
| C | 0 | 10 | 225663 | 1361.88 | 704 | 707 | 165.2 |
| C | 0 | 207 | 122715 | 738.64 | 704 | 707 | 165.2 |
| D | 2 | 250 | 648319 | 3784.88 | 696 | 678 | 171.1 |
| D | 13 | 249 | 508581 | 2968.24 | 696 | 678 | 171.1 |
| D | 8 | 195 | 72626 | 420.47 | 696 | 678 | 171.1 |
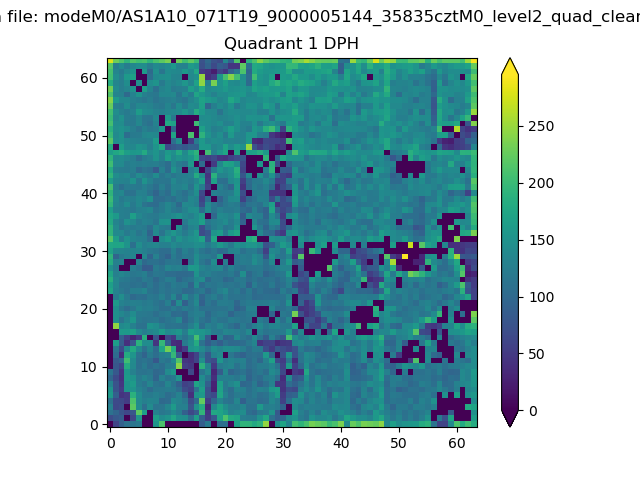
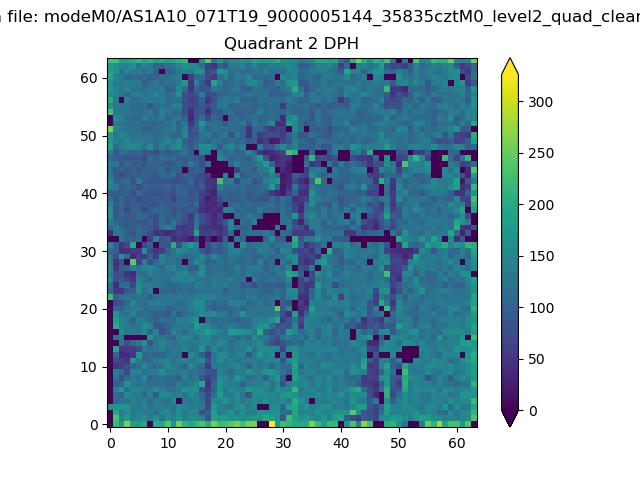
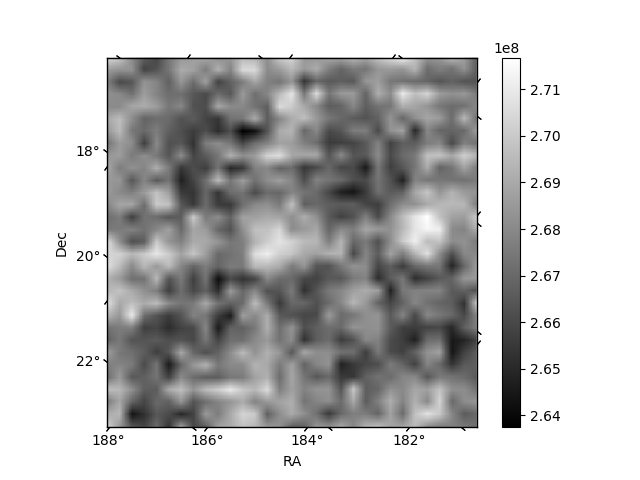
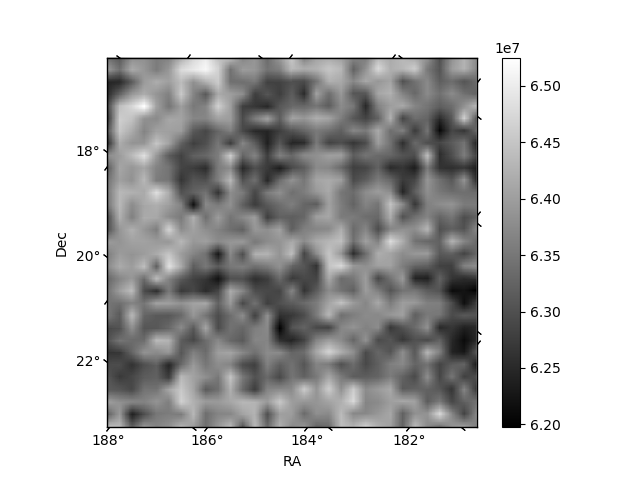
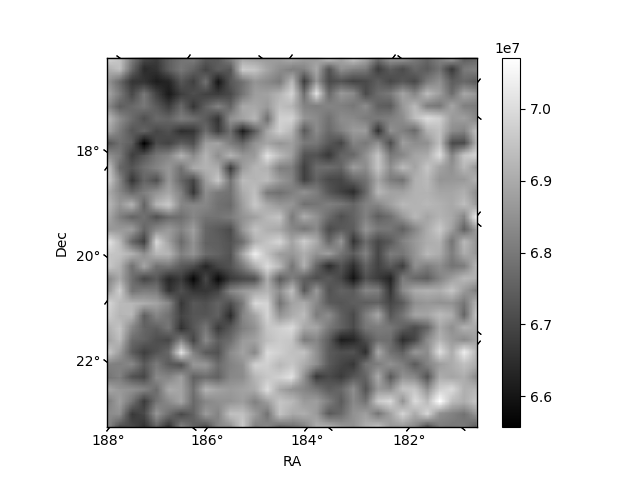
Histogram calculated using DETX and DETY for each event in the final _common_clean file
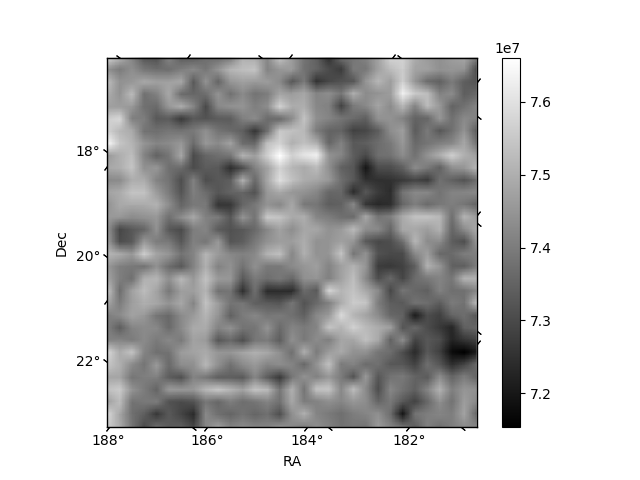
| Quadrant A |  |
 |
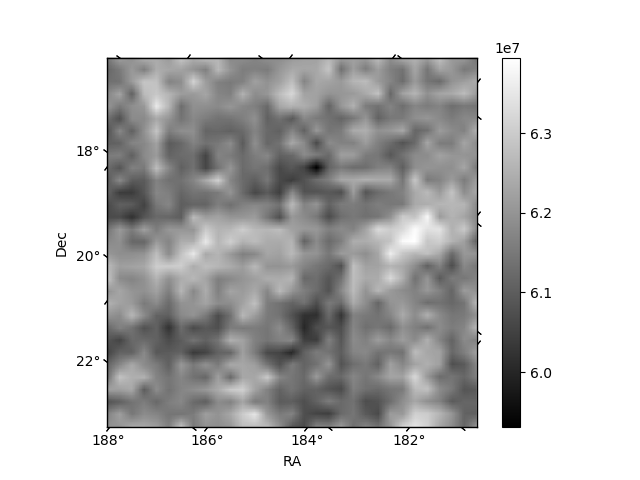
Quadrant B |
|---|---|---|---|
| Quadrant D | 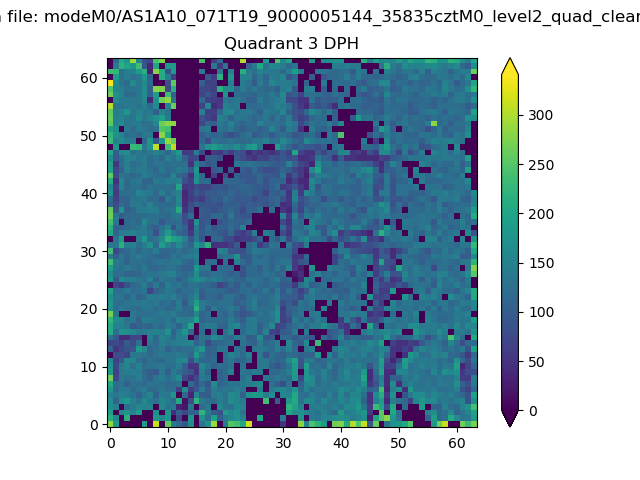 |
 |
Quadrant C |
| Plot type | Count rate plots | Images |
|---|---|---|
| Comparison with Poisson distribution Blue bars denote a histogram of data divided into 1 sec bins. Red curve is a Poisson curve with rate = median count rate of data. |
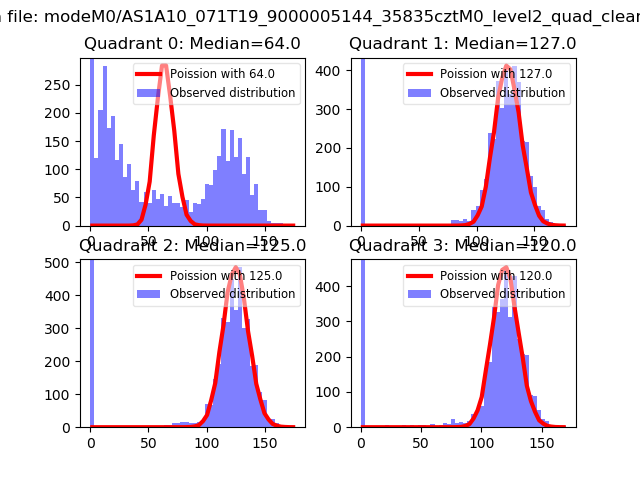 |
 |
| Quadrant-wise count rates Data is divided into 100 sec bins |
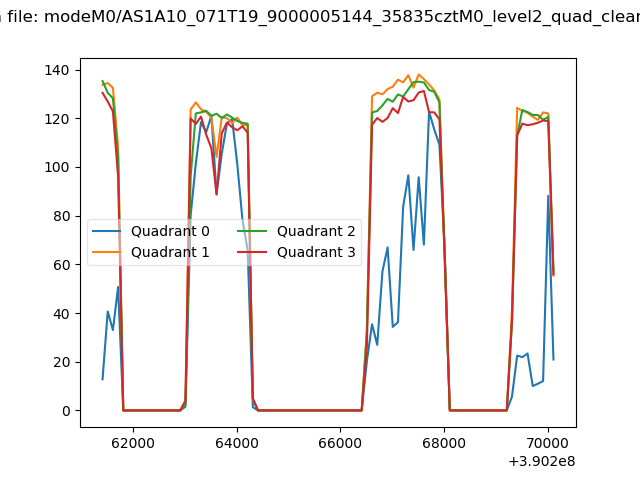 |
|
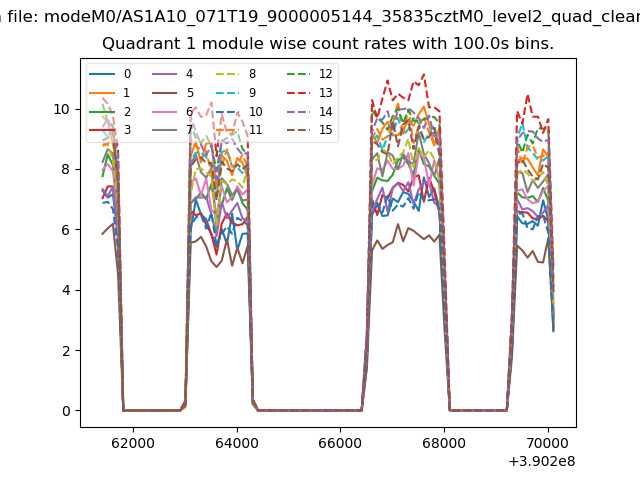
| Module-wise count rates for Quadrant A Data is divided into 100 sec bins |
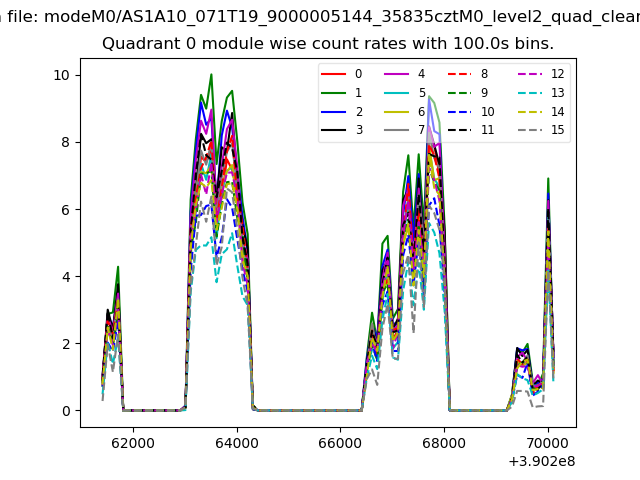 |
 |
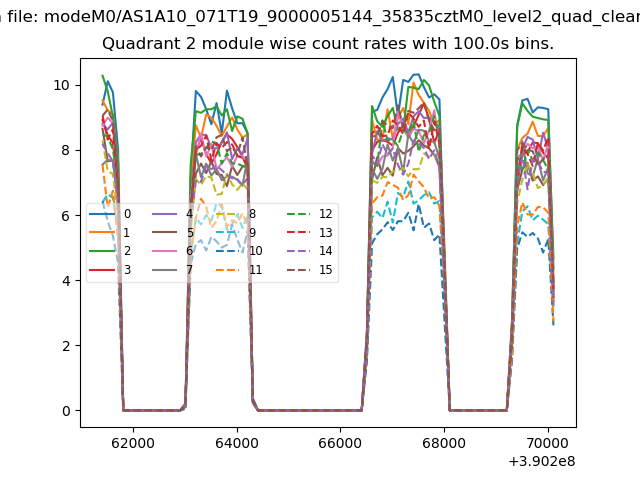
| Module-wise count rates for Quadrant B Data is divided into 100 sec bins |
 |
 |
| Module-wise count rates for Quadrant C Data is divided into 100 sec bins |
 |
 |
| Module-wise count rates for Quadrant D Data is divided into 100 sec bins |
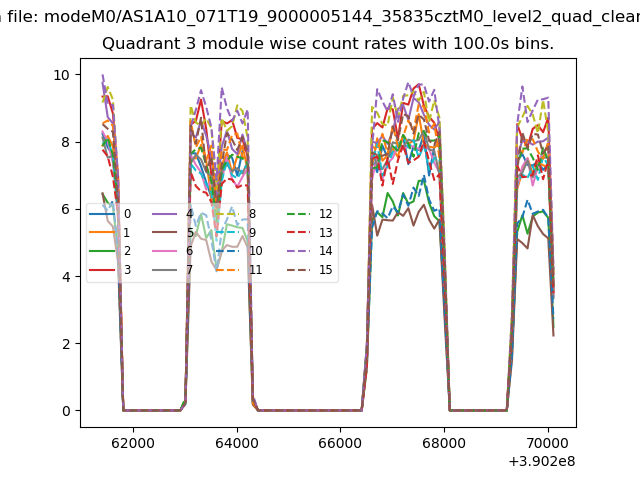 |
 |
| Parameter | Plot |
|---|---|
| CZT HV Monitor | 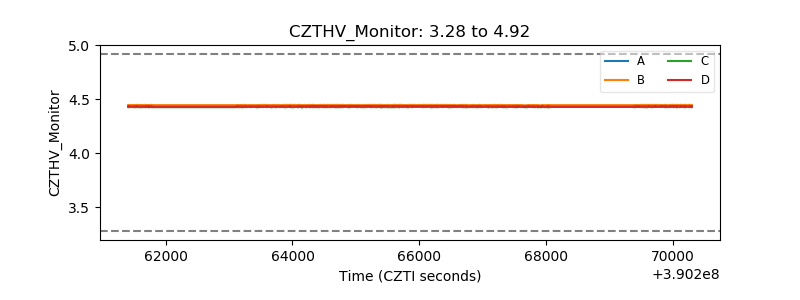 |
| D_VDD | 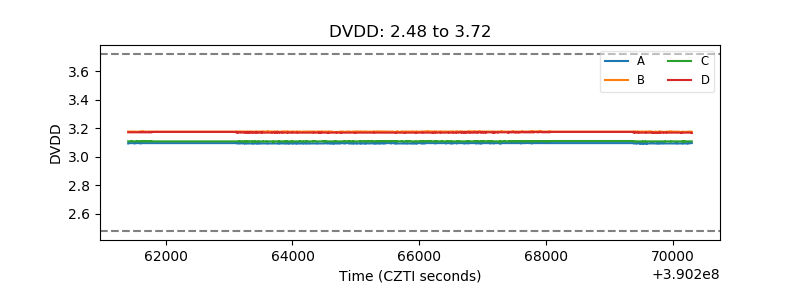 |
| Temperature 1 | 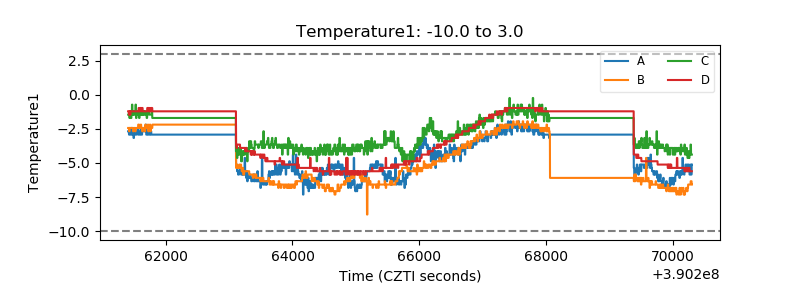 |
| Veto HV Monitor |  |
| Veto LLD |  |
| Alpha Counter | 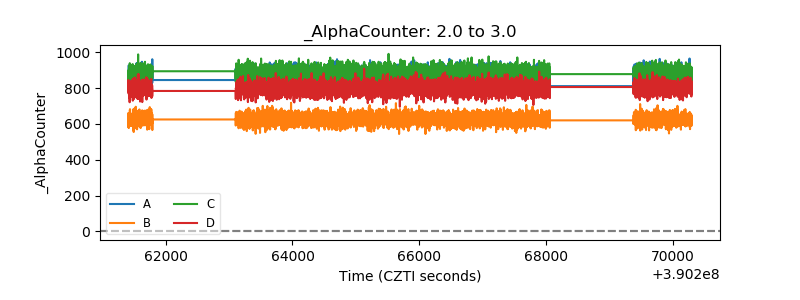 |
| _CPM_Rate | 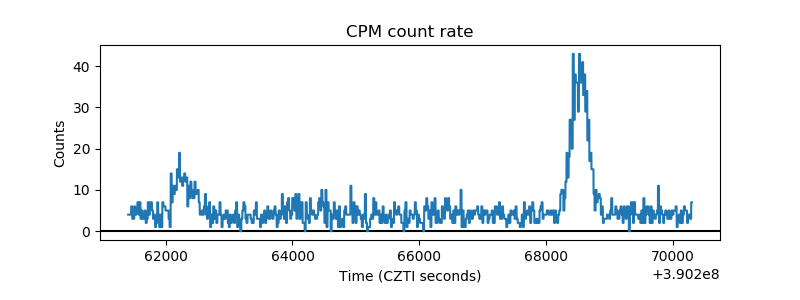 |
| CZT Counter | 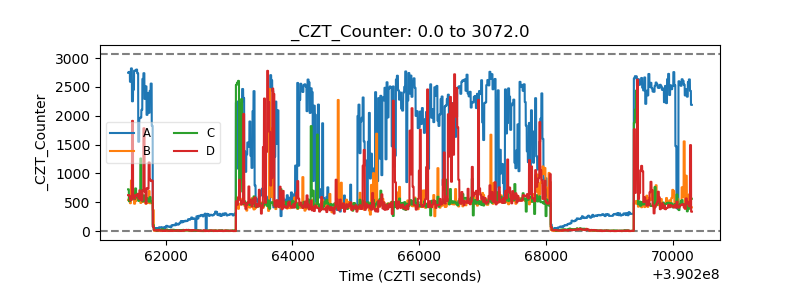 |
| +2.5 Volts monitor |  |
| +5 Volts monitor |  |
| _ROLL_ROT | 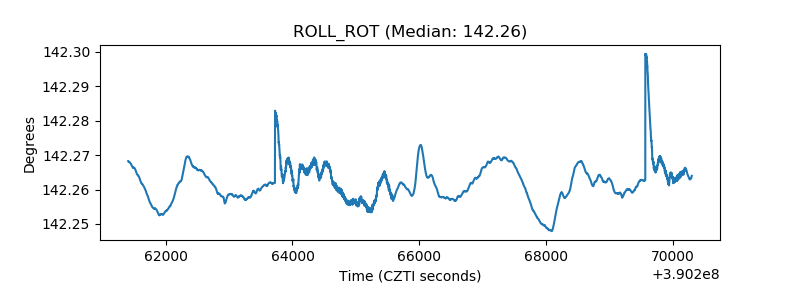 |
| _Roll_DEC | 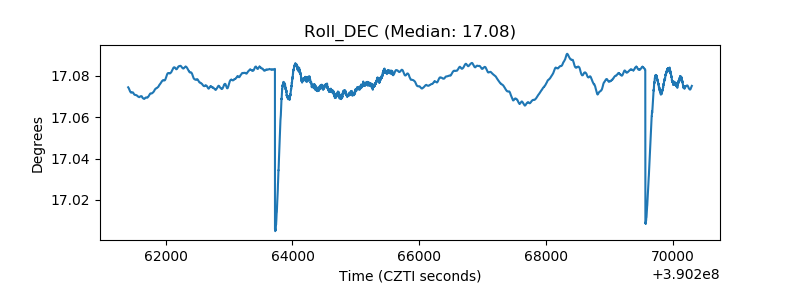 |
| _Roll_RA | 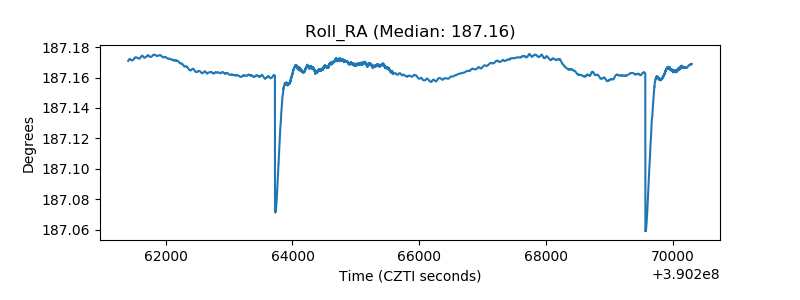 |
| Veto Counter | 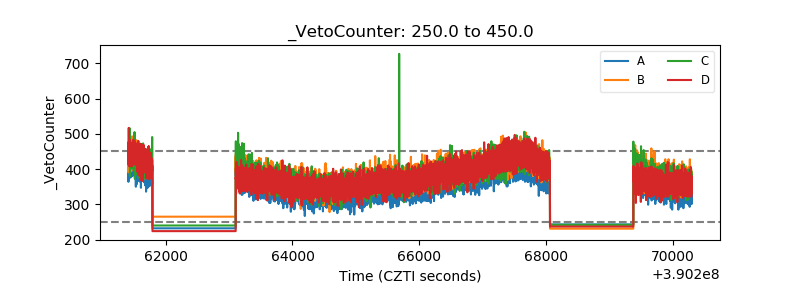 |