| Param | Original file | Final file |
|---|---|---|
| Filename | modeM0/AS1A11_080T01_9000005146cztM0_level2.fits | modeM0/AS1A11_080T01_9000005146cztM0_level2_quad_clean.evt |
| Size (bytes) | 816,370,560 | 937,900,800 |
| Size | 778.6 MB | 894.5 MB |
| Events in quadrant A | 5,475,458 | 7,182,452 |
| Events in quadrant B | 3,193,090 | 2,364,257 |
| Events in quadrant C | 4,999,600 | 6,346,858 |
| Events in quadrant D | 4,590,398 | 6,085,015 |
| Mode M9 | |||
|---|---|---|---|
| Quadrant | BADHDUFLAG | Total packets | Discarded packets |
| A | 0 | 353 | 0 |
| B | 0 | 353 | 0 |
| C | 0 | 356 | 0 |
| D | 0 | 354 | 0 |
| Mode SS | |||
|---|---|---|---|
| Quadrant | BADHDUFLAG | Total packets | Discarded packets |
| A | 0 | 1920 | 0 |
| B | 0 | 1921 | 0 |
| C | 0 | 1920 | 0 |
| D | 0 | 1917 | 0 |
| Mode M0 | |||
|---|---|---|---|
| Quadrant | BADHDUFLAG | Total packets | Discarded packets |
| A | 0 | 219421 | 0 |
| B | 0 | 615077 | 0 |
| C | 0 | 266487 | 0 |
| D | 0 | 244399 | 0 |
| Quadrant | Total seconds | Saturated seconds | Saturation percentage |
|---|---|---|---|
| A | 93851 | 2509 | 2.673387% |
| B | 93581 | 67865 | 72.520063% |
| C | 93754 | 8387 | 8.945752% |
| D | 93830 | 2754 | 2.935095% |
Noise dominated data is calculated using 1-second bins in cleaned event files. If a bin has >2000 counts, and if more than 50% of those come from <1% of pixels, then it is considered to be noise-dominated and hence unusable.
| Quadrant | # 1 sec bins | Bins with >0 counts | Bins with >2000 counts | High rate bins dominated by noise | Noise dominated (total time) | Noise dominated (detector-on time) | Marked lightcurve |
|---|---|---|---|---|---|---|---|
| A | 715511 | 94002 | 0 | 0 | 0.00% | 0.00% |  |
| B | 715511 | 93379 | 0 | 0 | 0.00% | 0.00% | 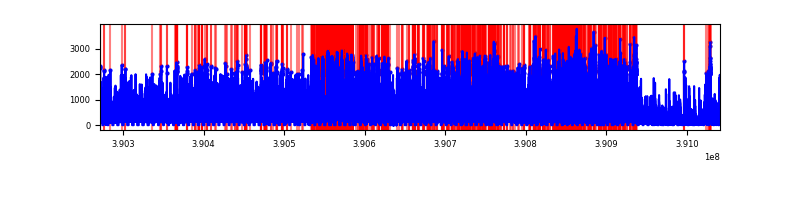 |
| C | 715511 | 93063 | 0 | 0 | 0.00% | 0.00% |  |
| D | 715512 | 93982 | 0 | 0 | 0.00% | 0.00% |  |
Top three noisy pixels from each quadrant. If the there are fewer than three noisy pixels in the level2.evt file, extra rows are filled as -1
| Pixel properties | Quadrant properties | ||||||
|---|---|---|---|---|---|---|---|
| Quadrant | DetID | PixID | Counts | Sigma | Mean | Median | Sigma |
| A | 7 | 110 | 4771 | 9.68 | 1425 | 1343 | 354.0 |
| A | 0 | 29 | 4564 | 9.1 | 1425 | 1343 | 354.0 |
| A | 9 | 19 | 4528 | 9.0 | 1425 | 1343 | 354.0 |
| B | 2 | 9 | 2956 | 12.05 | 844 | 819 | 177.3 |
| B | 3 | 80 | 2602 | 10.06 | 844 | 819 | 177.3 |
| B | 2 | 8 | 2333 | 8.54 | 844 | 819 | 177.3 |
| C | 1 | 81 | 4567 | 9.76 | 1322 | 1244 | 340.3 |
| C | 1 | 80 | 4449 | 9.42 | 1322 | 1244 | 340.3 |
| C | 3 | 203 | 4300 | 8.98 | 1322 | 1244 | 340.3 |
| D | 4 | 160 | 3556 | 6.61 | 1315 | 1200 | 356.3 |
| D | 10 | 113 | 3478 | 6.39 | 1315 | 1200 | 356.3 |
| D | 6 | 38 | 3392 | 6.15 | 1315 | 1200 | 356.3 |
Histogram calculated using DETX and DETY for each event in the final _common_clean file
| Quadrant A |  |
 |
Quadrant B |
|---|---|---|---|
| Quadrant D | 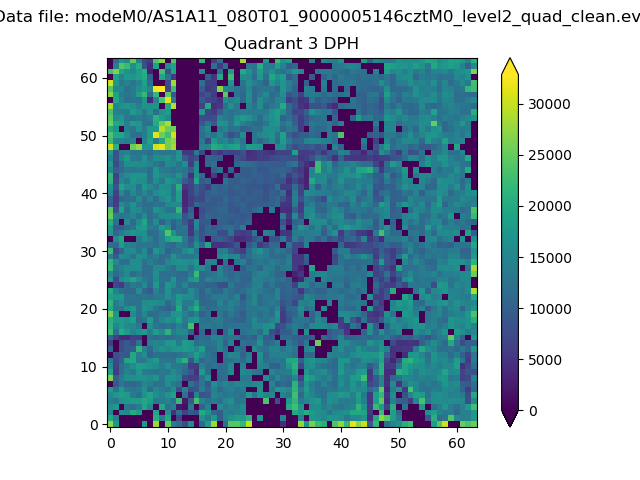 |
 |
Quadrant C |
| Plot type | Count rate plots | Images |
|---|---|---|
| Comparison with Poisson distribution Blue bars denote a histogram of data divided into 1 sec bins. Red curve is a Poisson curve with rate = median count rate of data. |
 |
 |
| Quadrant-wise count rates Data is divided into 100 sec bins |
 |
|
| Module-wise count rates for Quadrant A Data is divided into 100 sec bins |
 |
 |
| Module-wise count rates for Quadrant B Data is divided into 100 sec bins |
 |
 |
| Module-wise count rates for Quadrant C Data is divided into 100 sec bins |
 |
 |
| Module-wise count rates for Quadrant D Data is divided into 100 sec bins |
 |
 |
| Parameter | Plot |
|---|---|
| CZT HV Monitor | 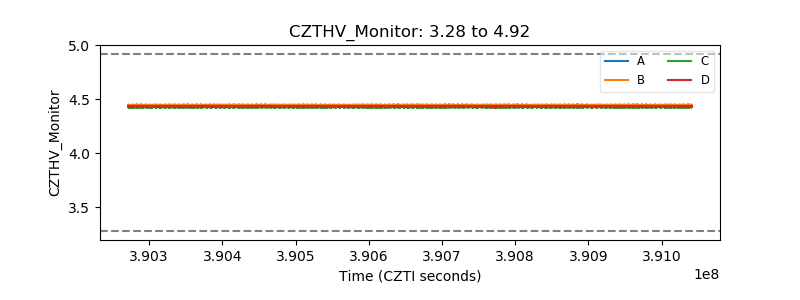 |
| D_VDD | 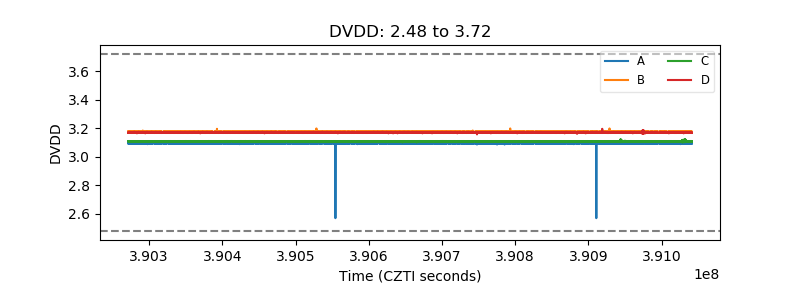 |
| Temperature 1 |  |
| Veto HV Monitor |  |
| Veto LLD | 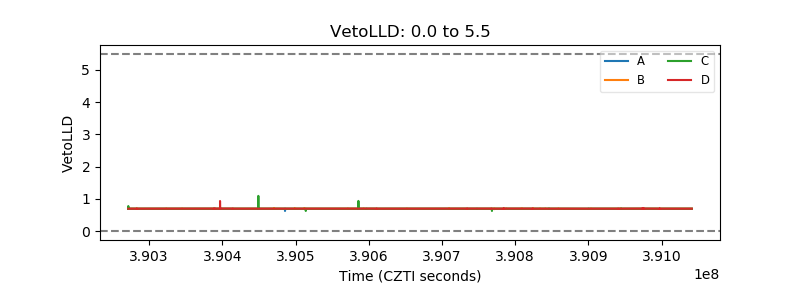 |
| Alpha Counter |  |
| _CPM_Rate |  |
| CZT Counter |  |
| +2.5 Volts monitor |  |
| +5 Volts monitor |  |
| _ROLL_ROT |  |
| _Roll_DEC |  |
| _Roll_RA | 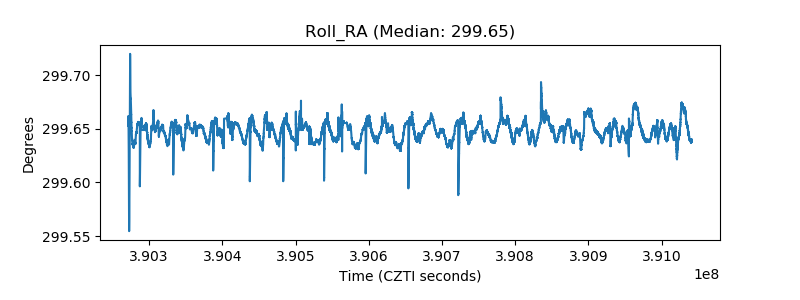 |
| Veto Counter |  |