| Param | Original file | Final file |
|---|---|---|
| Filename | modeM0/AS1A11_080T01_9000005146_35854cztM0_level2.evt | modeM0/AS1A11_080T01_9000005146_35854cztM0_level2_quad_clean.evt |
| Size (bytes) | 1,076,892,480 | 166,795,200 |
| Size | 1.0 GB | 159.1 MB |
| Events in quadrant A | 8,043,094 | 1,054,947 |
| Events in quadrant B | 7,718,081 | 1,056,164 |
| Events in quadrant C | 7,359,963 | 1,023,943 |
| Events in quadrant D | 8,579,618 | 982,123 |
| Mode M9 | |||
|---|---|---|---|
| Quadrant | BADHDUFLAG | Total packets | Discarded packets |
| A | 0 | 55 | 0 |
| B | 0 | 55 | 0 |
| C | 0 | 55 | 0 |
| D | 0 | 55 | 0 |
| Mode SS | |||
|---|---|---|---|
| Quadrant | BADHDUFLAG | Total packets | Discarded packets |
| A | 0 | 276 | 0 |
| B | 0 | 276 | 0 |
| C | 0 | 276 | 0 |
| D | 0 | 276 | 0 |
| Mode M0 | |||
|---|---|---|---|
| Quadrant | BADHDUFLAG | Total packets | Discarded packets |
| A | 0 | 32340 | 4 |
| B | 0 | 31216 | 3 |
| C | 0 | 29572 | 3 |
| D | 0 | 34088 | 3 |
| Quadrant | Total seconds | Saturated seconds | Saturation percentage |
|---|---|---|---|
| A | 13529 | 26 | 0.192180% |
| B | 13529 | 135 | 0.997856% |
| C | 13529 | 150 | 1.108729% |
| D | 13529 | 249 | 1.840491% |
Noise dominated data is calculated using 1-second bins in cleaned event files. If a bin has >2000 counts, and if more than 50% of those come from <1% of pixels, then it is considered to be noise-dominated and hence unusable.
| Quadrant | # 1 sec bins | Bins with >0 counts | Bins with >2000 counts | High rate bins dominated by noise | Noise dominated (total time) | Noise dominated (detector-on time) | Marked lightcurve |
|---|---|---|---|---|---|---|---|
| A | 19028 | 13532 | 6 | 6 | 0.03% | 0.04% | 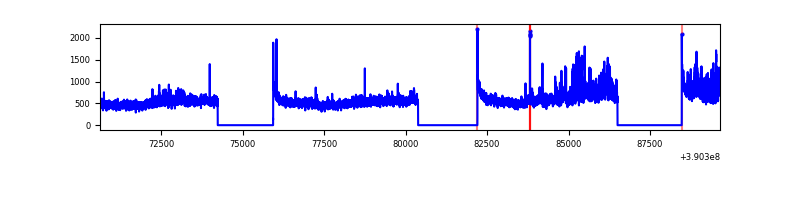 |
| B | 19028 | 13532 | 80 | 80 | 0.42% | 0.59% | 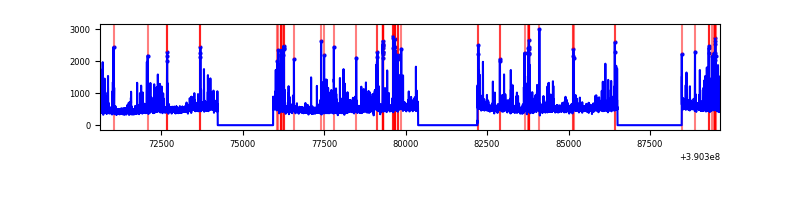 |
| C | 19028 | 13532 | 137 | 137 | 0.72% | 1.01% | 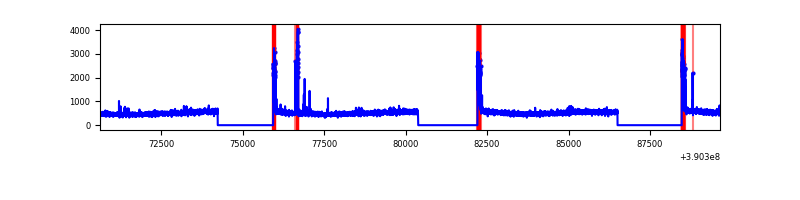 |
| D | 19028 | 13532 | 208 | 208 | 1.09% | 1.54% | 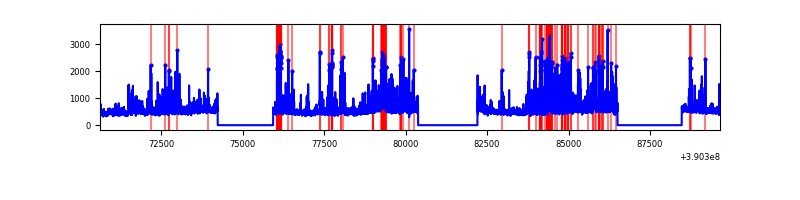 |
Top three noisy pixels from each quadrant. If the there are fewer than three noisy pixels in the level2.evt file, extra rows are filled as -1
| Pixel properties | Quadrant properties | ||||||
|---|---|---|---|---|---|---|---|
| Quadrant | DetID | PixID | Counts | Sigma | Mean | Median | Sigma |
| A | 15 | 169 | 1078890 | 3182.32 | 1700 | 1674 | 338.5 |
| A | 10 | 83 | 323638 | 951.15 | 1700 | 1674 | 338.5 |
| A | 13 | 6 | 35273 | 99.26 | 1700 | 1674 | 338.5 |
| B | 5 | 172 | 591647 | 1893.17 | 1663 | 1627 | 311.7 |
| B | 0 | 213 | 366569 | 1170.97 | 1663 | 1627 | 311.7 |
| B | 5 | 255 | 53011 | 164.87 | 1663 | 1627 | 311.7 |
| C | 15 | 214 | 559791 | 1505.34 | 1614 | 1631 | 370.8 |
| C | 0 | 10 | 381855 | 1025.45 | 1614 | 1631 | 370.8 |
| C | 9 | 69 | 83053 | 219.59 | 1614 | 1631 | 370.8 |
| D | 13 | 200 | 506633 | 1275.76 | 1631 | 1591 | 395.9 |
| D | 7 | 223 | 477643 | 1202.53 | 1631 | 1591 | 395.9 |
| D | 8 | 195 | 338417 | 850.84 | 1631 | 1591 | 395.9 |
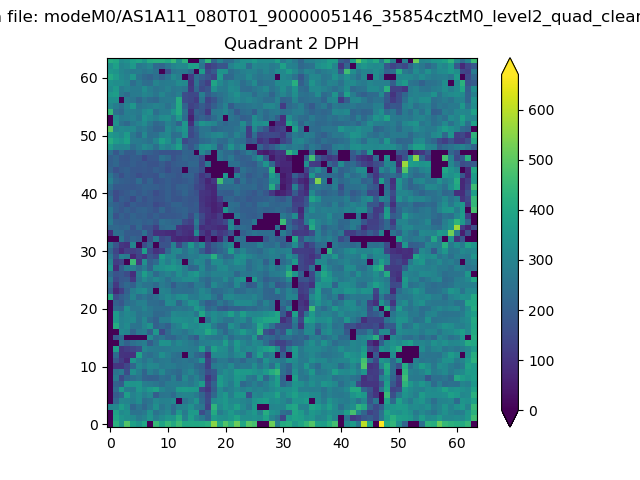
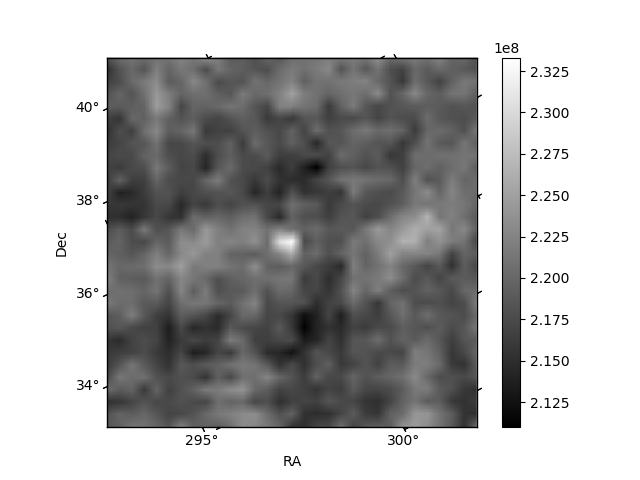
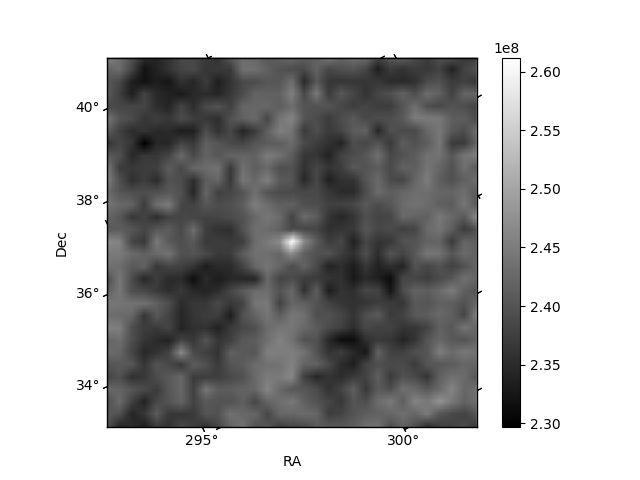
Histogram calculated using DETX and DETY for each event in the final _common_clean file
| Quadrant A |  |
 |
Quadrant B |
|---|---|---|---|
| Quadrant D |  |
 |
Quadrant C |
| Plot type | Count rate plots | Images |
|---|---|---|
| Comparison with Poisson distribution Blue bars denote a histogram of data divided into 1 sec bins. Red curve is a Poisson curve with rate = median count rate of data. |
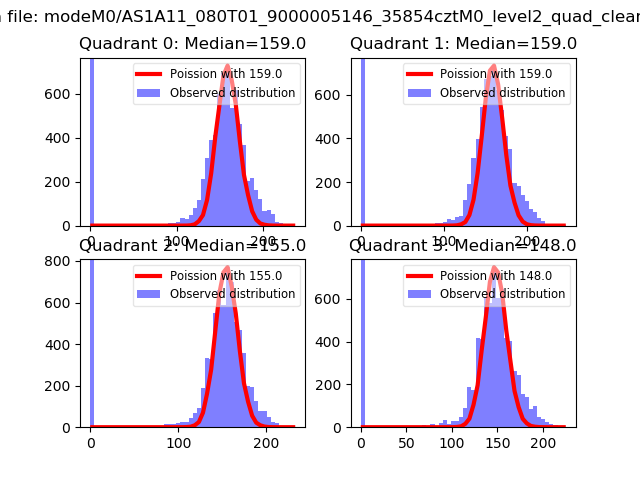 |
 |
| Quadrant-wise count rates Data is divided into 100 sec bins |
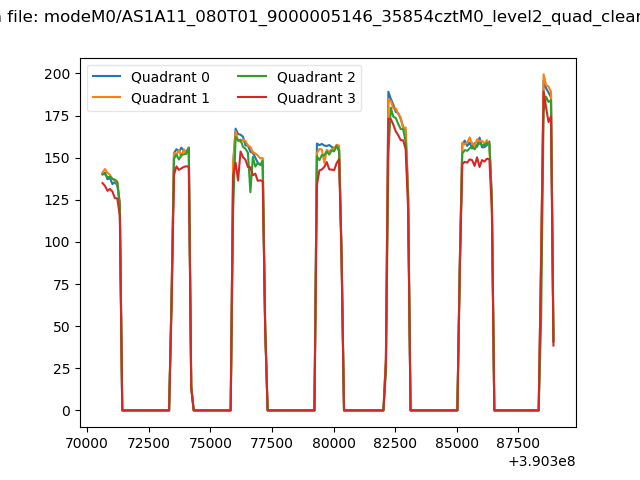 |
|
| Module-wise count rates for Quadrant A Data is divided into 100 sec bins |
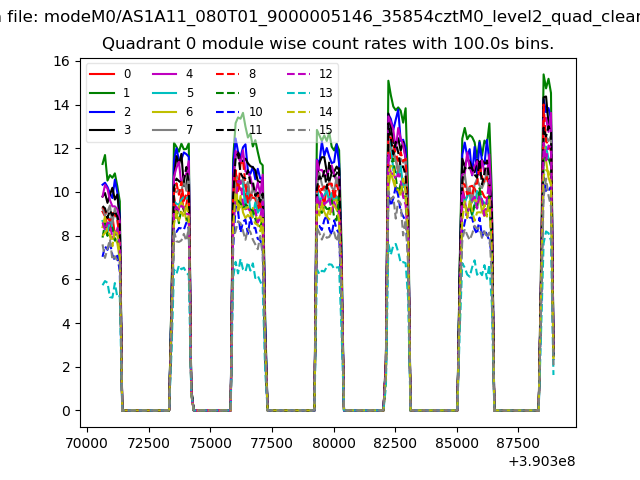 |
 |
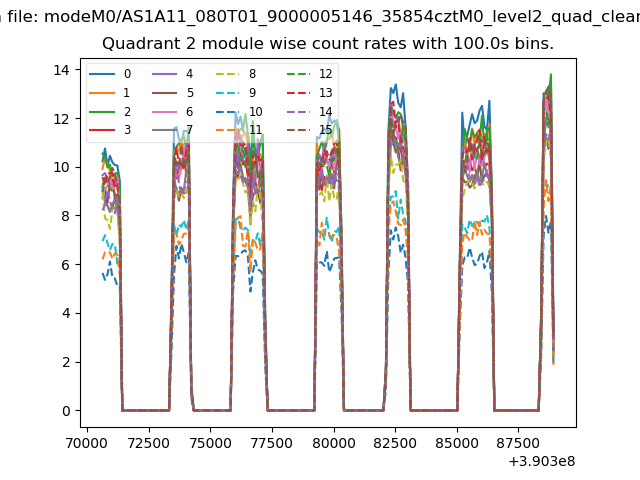
| Module-wise count rates for Quadrant B Data is divided into 100 sec bins |
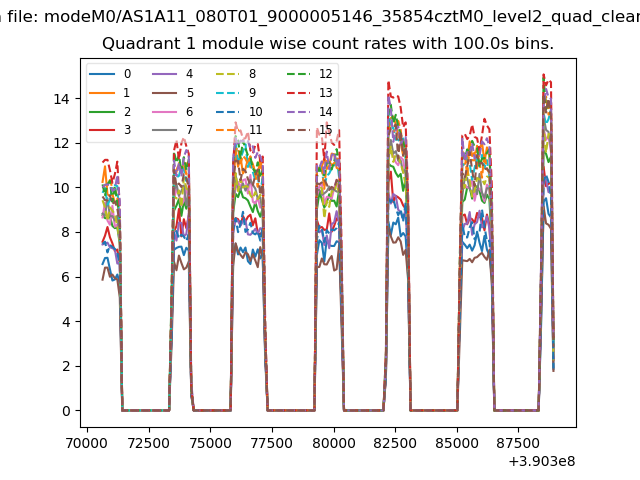 |
 |
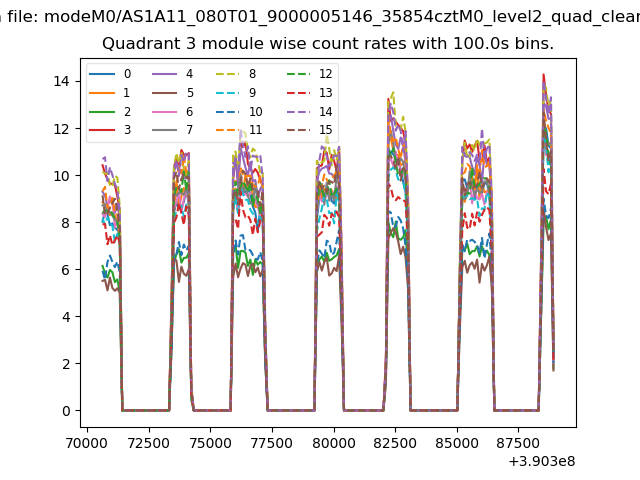
| Module-wise count rates for Quadrant C Data is divided into 100 sec bins |
 |
 |
| Module-wise count rates for Quadrant D Data is divided into 100 sec bins |
 |
 |
| Parameter | Plot |
|---|---|
| CZT HV Monitor | 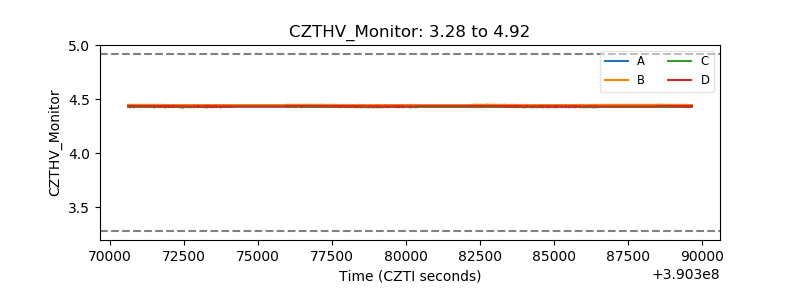 |
| D_VDD |  |
| Temperature 1 | 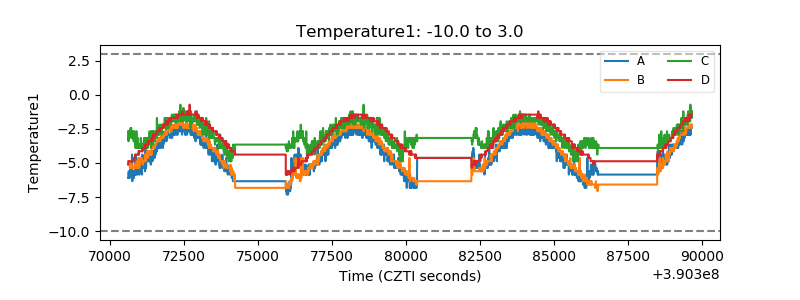 |
| Veto HV Monitor | 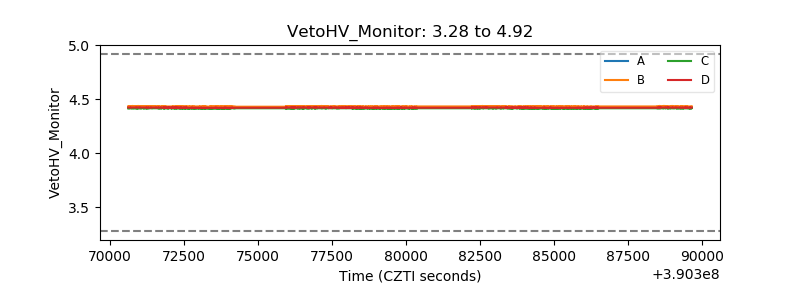 |
| Veto LLD | 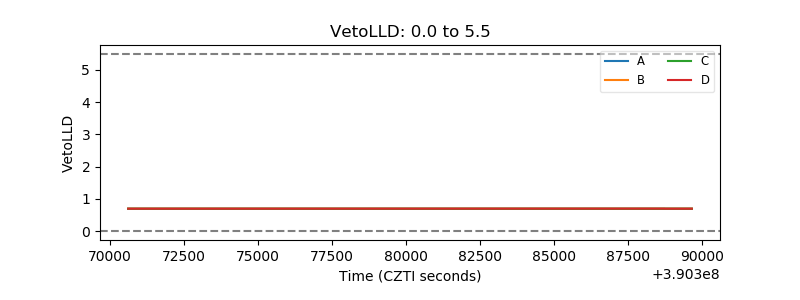 |
| Alpha Counter | 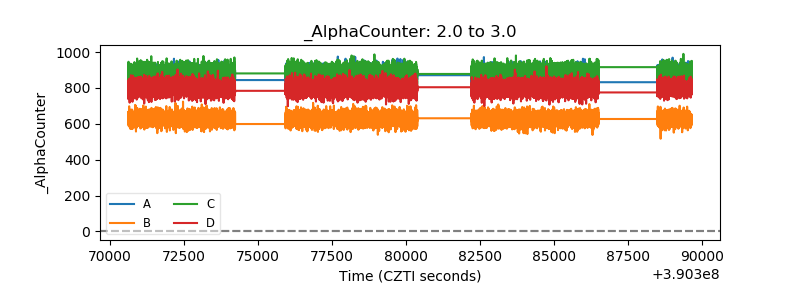 |
| _CPM_Rate | 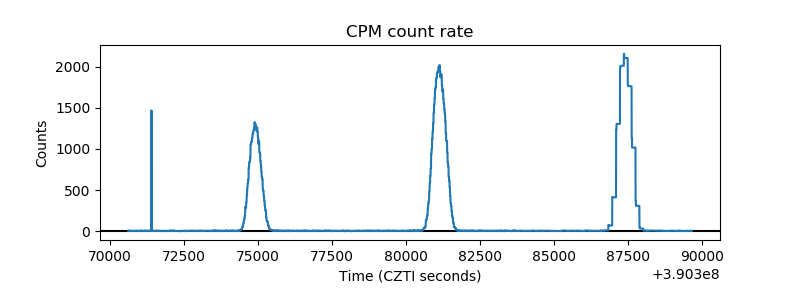 |
| CZT Counter | 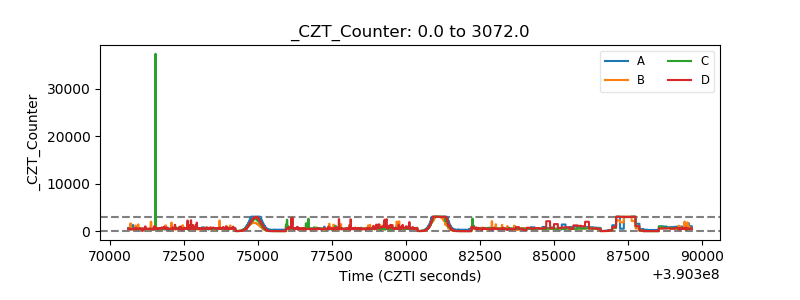 |
| +2.5 Volts monitor |  |
| +5 Volts monitor | 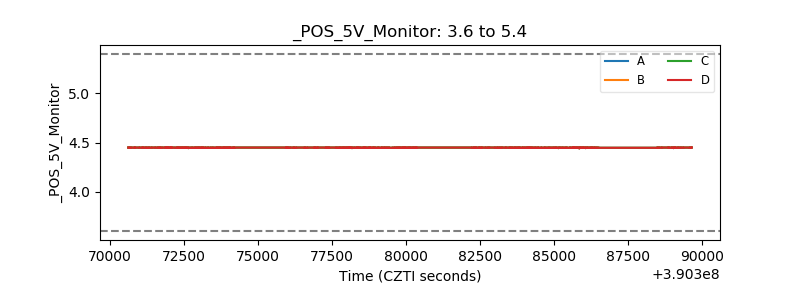 |
| _ROLL_ROT | 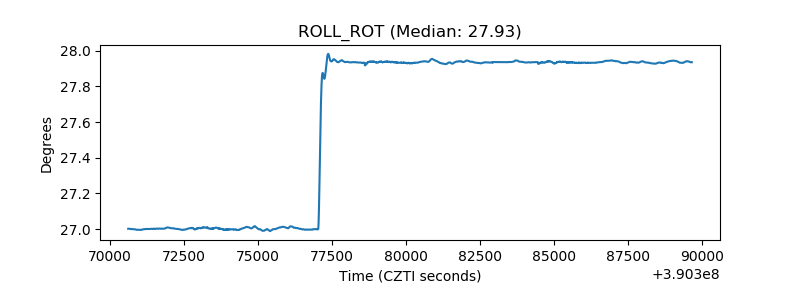 |
| _Roll_DEC | 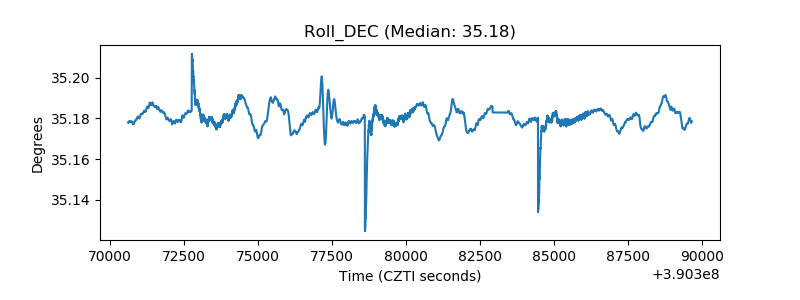 |
| _Roll_RA | 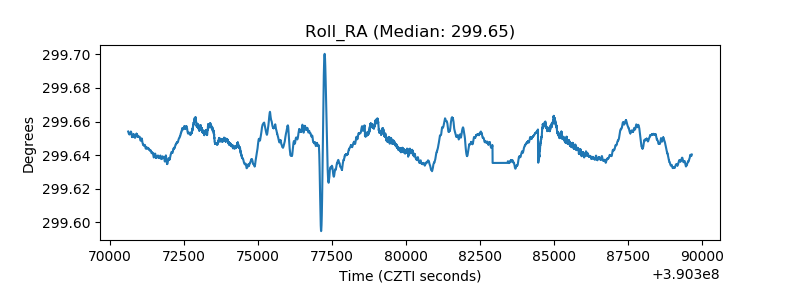 |
| Veto Counter | 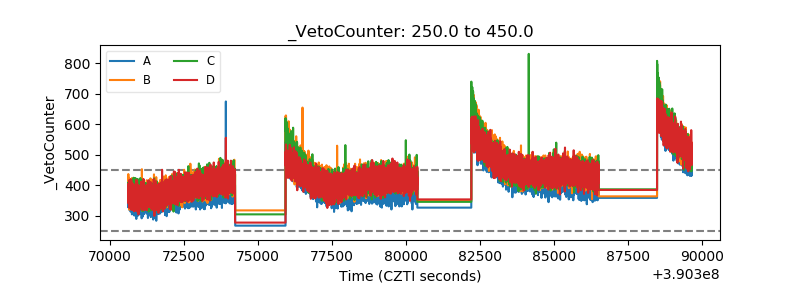 |