| Param | Original file | Final file |
|---|---|---|
| Filename | modeM0/AS1A11_080T01_9000005146_35869cztM0_level2.evt | modeM0/AS1A11_080T01_9000005146_35869cztM0_level2_quad_clean.evt |
| Size (bytes) | 1,590,456,960 | 162,532,800 |
| Size | 1.5 GB | 155.0 MB |
| Events in quadrant A | 18,326,176 | 1,022,254 |
| Events in quadrant B | 7,697,668 | 1,069,615 |
| Events in quadrant C | 8,841,361 | 1,019,168 |
| Events in quadrant D | 12,415,187 | 897,539 |
| Mode M9 | |||
|---|---|---|---|
| Quadrant | BADHDUFLAG | Total packets | Discarded packets |
| A | 0 | 56 | 0 |
| B | 0 | 56 | 0 |
| C | 0 | 56 | 0 |
| D | 0 | 56 | 0 |
| Mode SS | |||
|---|---|---|---|
| Quadrant | BADHDUFLAG | Total packets | Discarded packets |
| A | 0 | 272 | 0 |
| B | 0 | 272 | 0 |
| C | 0 | 272 | 0 |
| D | 0 | 272 | 0 |
| Mode M0 | |||
|---|---|---|---|
| Quadrant | BADHDUFLAG | Total packets | Discarded packets |
| A | 0 | 63900 | 4 |
| B | 0 | 30737 | 3 |
| C | 0 | 34125 | 3 |
| D | 0 | 45514 | 3 |
| Quadrant | Total seconds | Saturated seconds | Saturation percentage |
|---|---|---|---|
| A | 13206 | 2754 | 20.854157% |
| B | 13206 | 246 | 1.862790% |
| C | 13206 | 584 | 4.422232% |
| D | 13206 | 2091 | 15.833712% |
Noise dominated data is calculated using 1-second bins in cleaned event files. If a bin has >2000 counts, and if more than 50% of those come from <1% of pixels, then it is considered to be noise-dominated and hence unusable.
| Quadrant | # 1 sec bins | Bins with >0 counts | Bins with >2000 counts | High rate bins dominated by noise | Noise dominated (total time) | Noise dominated (detector-on time) | Marked lightcurve |
|---|---|---|---|---|---|---|---|
| A | 18916 | 13209 | 2172 | 2172 | 11.48% | 16.44% | 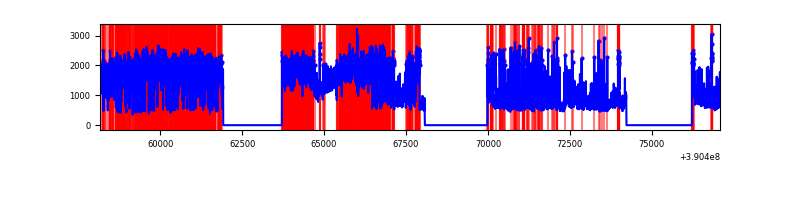 |
| B | 18916 | 13209 | 184 | 184 | 0.97% | 1.39% | 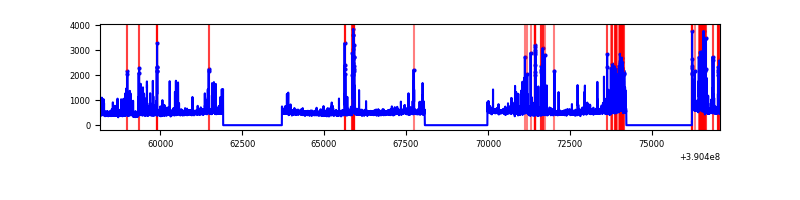 |
| C | 18916 | 13209 | 549 | 549 | 2.90% | 4.16% | 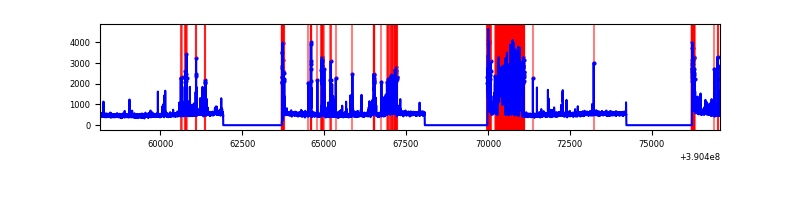 |
| D | 18916 | 13209 | 1780 | 1780 | 9.41% | 13.48% | 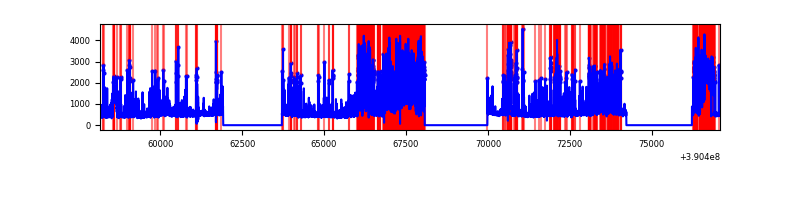 |
Top three noisy pixels from each quadrant. If the there are fewer than three noisy pixels in the level2.evt file, extra rows are filled as -1
| Pixel properties | Quadrant properties | ||||||
|---|---|---|---|---|---|---|---|
| Quadrant | DetID | PixID | Counts | Sigma | Mean | Median | Sigma |
| A | 15 | 169 | 11215113 | 34866.85 | 1619 | 1597 | 321.6 |
| A | 7 | 48 | 505362 | 1566.39 | 1619 | 1597 | 321.6 |
| A | 10 | 83 | 305367 | 944.53 | 1619 | 1597 | 321.6 |
| B | 5 | 172 | 910061 | 2980.58 | 1641 | 1606 | 304.8 |
| B | 5 | 255 | 162764 | 528.75 | 1641 | 1606 | 304.8 |
| B | 0 | 190 | 65558 | 209.82 | 1641 | 1606 | 304.8 |
| C | 1 | 23 | 1674575 | 4636.94 | 1575 | 1591 | 360.8 |
| C | 15 | 214 | 534551 | 1477.18 | 1575 | 1591 | 360.8 |
| C | 0 | 10 | 342821 | 945.77 | 1575 | 1591 | 360.8 |
| D | 2 | 250 | 2913729 | 7981.83 | 1492 | 1451 | 364.9 |
| D | 8 | 230 | 1041490 | 2850.49 | 1492 | 1451 | 364.9 |
| D | 13 | 249 | 958393 | 2622.74 | 1492 | 1451 | 364.9 |
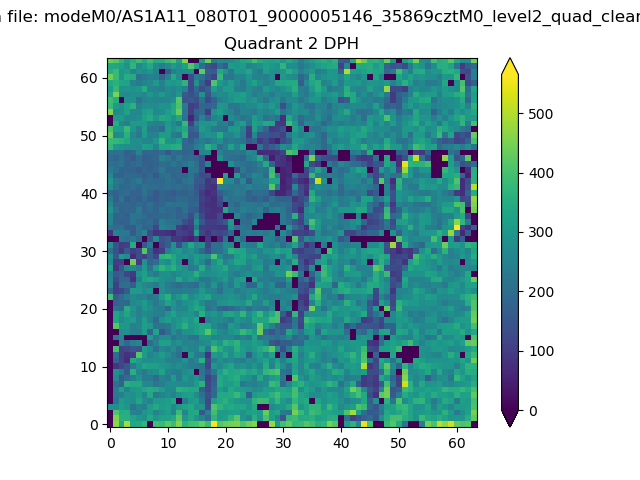
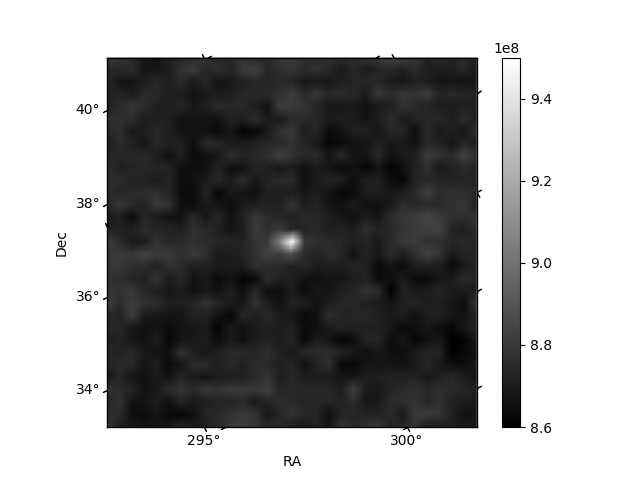
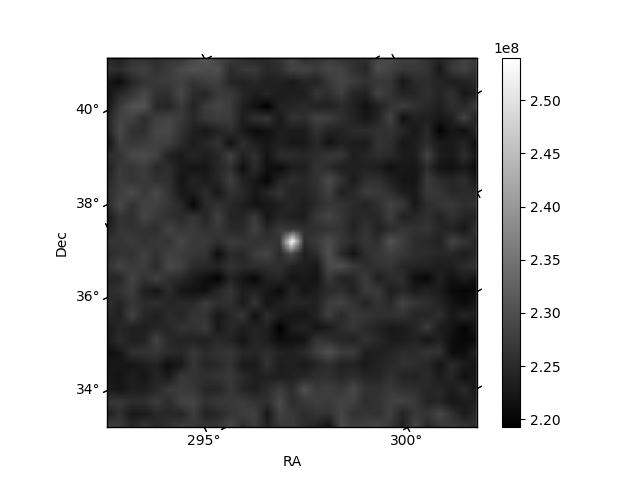
Histogram calculated using DETX and DETY for each event in the final _common_clean file
| Quadrant A | 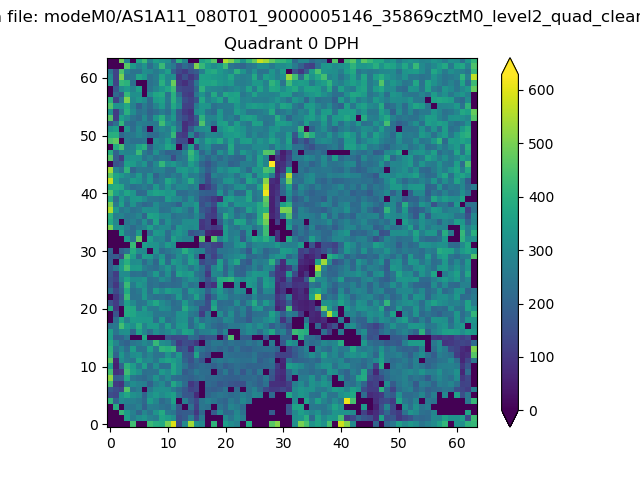 |
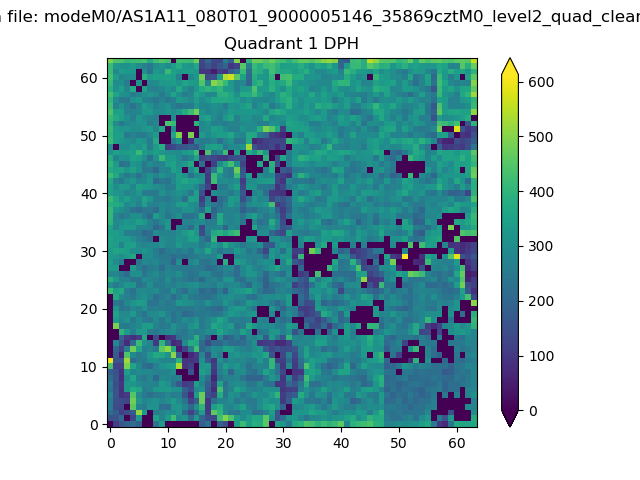 |
Quadrant B |
|---|---|---|---|
| Quadrant D | 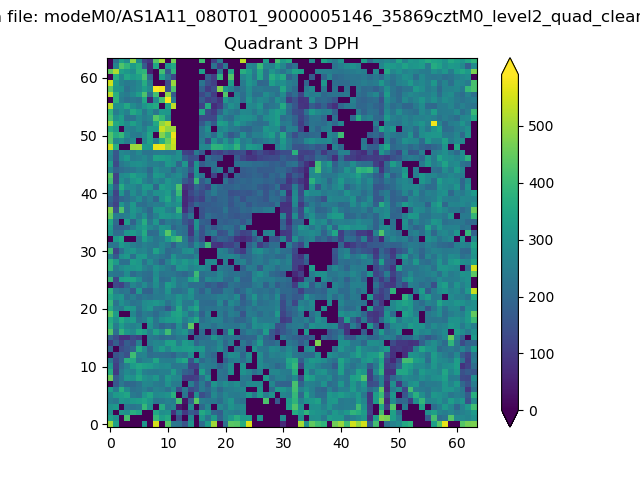 |
 |
Quadrant C |
| Plot type | Count rate plots | Images |
|---|---|---|
| Comparison with Poisson distribution Blue bars denote a histogram of data divided into 1 sec bins. Red curve is a Poisson curve with rate = median count rate of data. |
 |
 |
| Quadrant-wise count rates Data is divided into 100 sec bins |
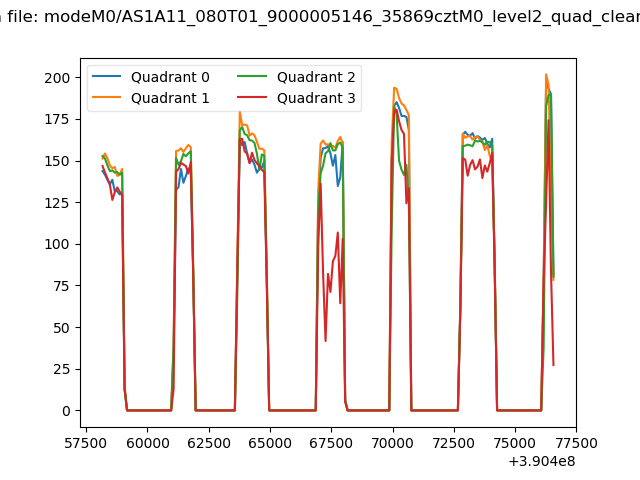 |
|
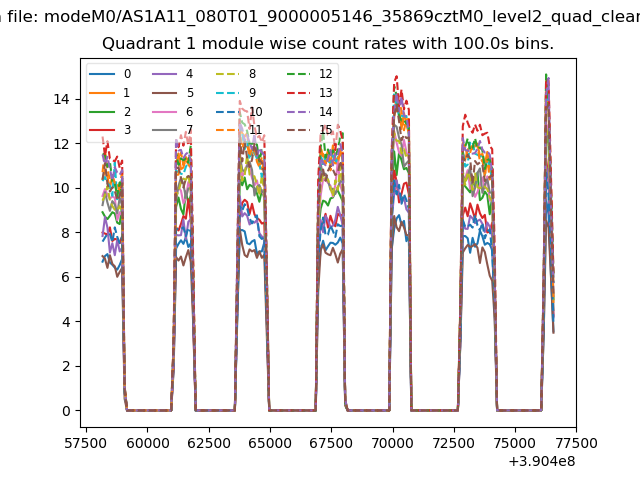
| Module-wise count rates for Quadrant A Data is divided into 100 sec bins |
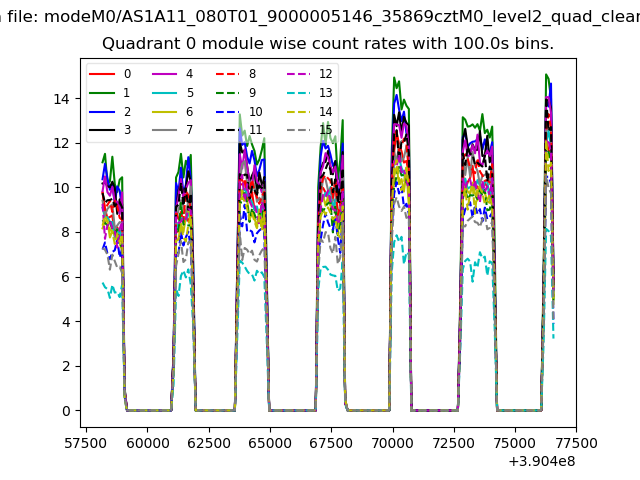 |
 |
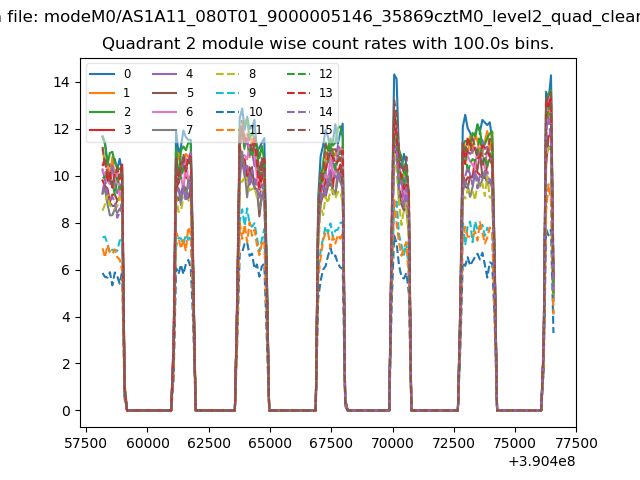
| Module-wise count rates for Quadrant B Data is divided into 100 sec bins |
 |
 |
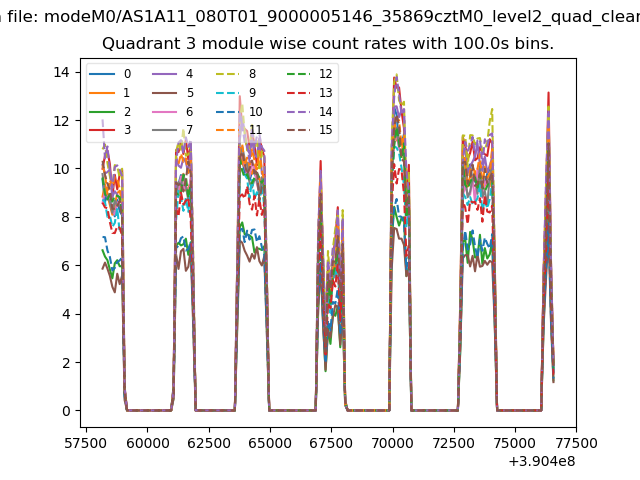
| Module-wise count rates for Quadrant C Data is divided into 100 sec bins |
 |
 |
| Module-wise count rates for Quadrant D Data is divided into 100 sec bins |
 |
 |
| Parameter | Plot |
|---|---|
| CZT HV Monitor | 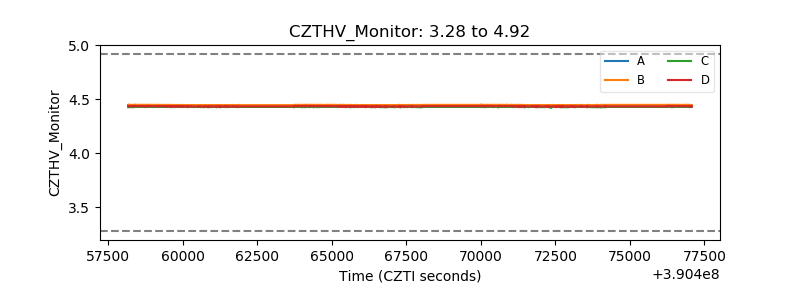 |
| D_VDD | 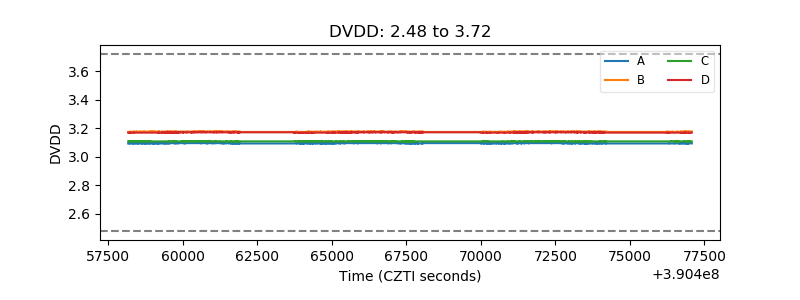 |
| Temperature 1 | 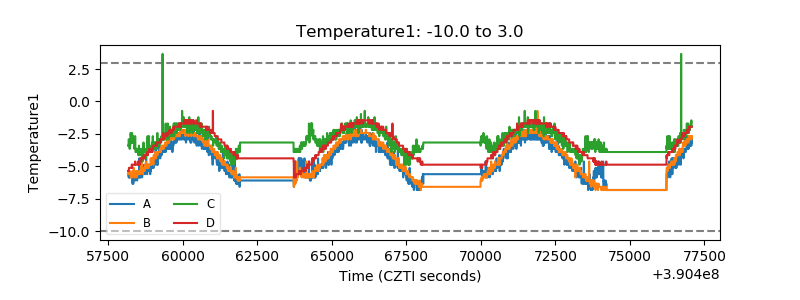 |
| Veto HV Monitor | 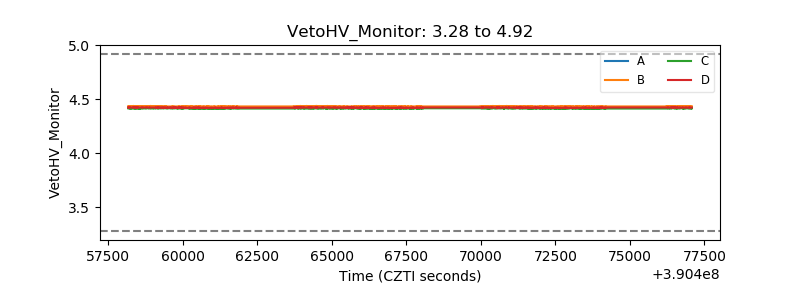 |
| Veto LLD | 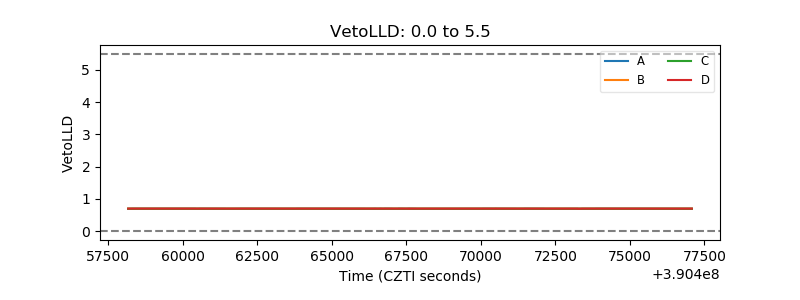 |
| Alpha Counter | 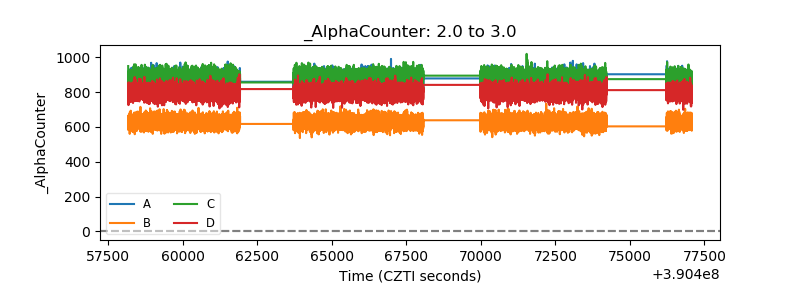 |
| _CPM_Rate | 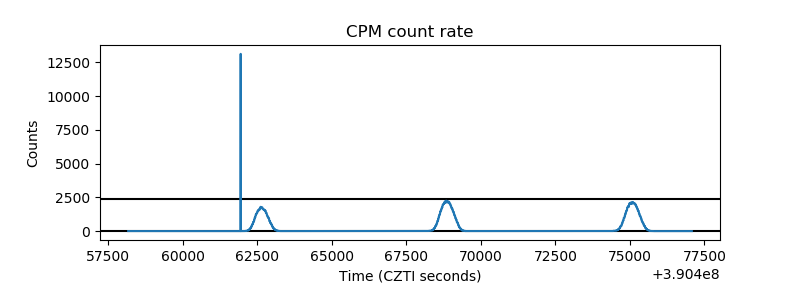 |
| CZT Counter | 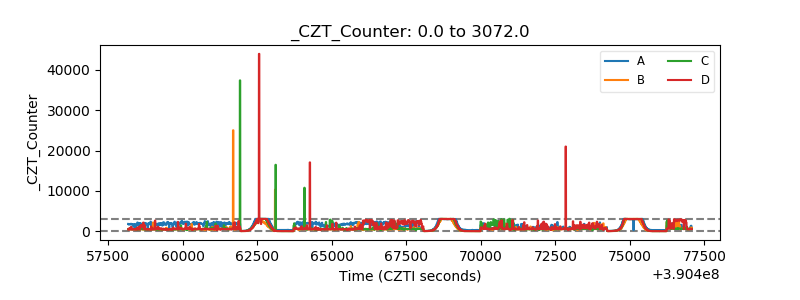 |
| +2.5 Volts monitor |  |
| +5 Volts monitor |  |
| _ROLL_ROT | 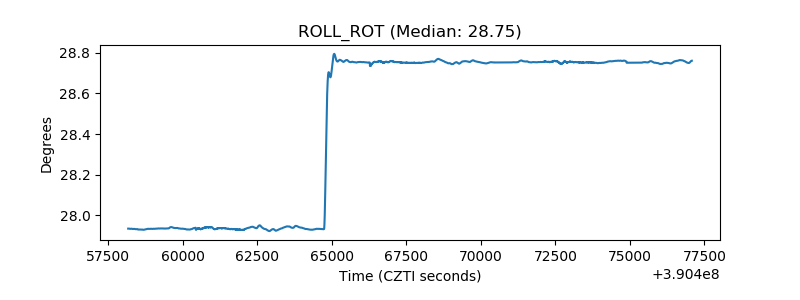 |
| _Roll_DEC | 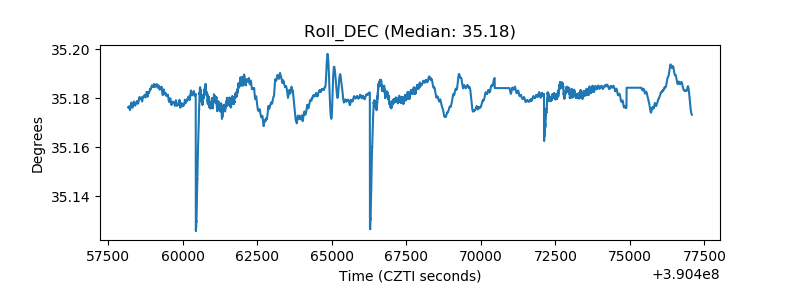 |
| _Roll_RA | 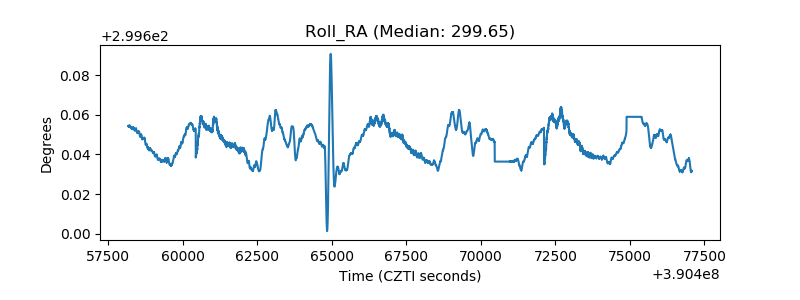 |
| Veto Counter | 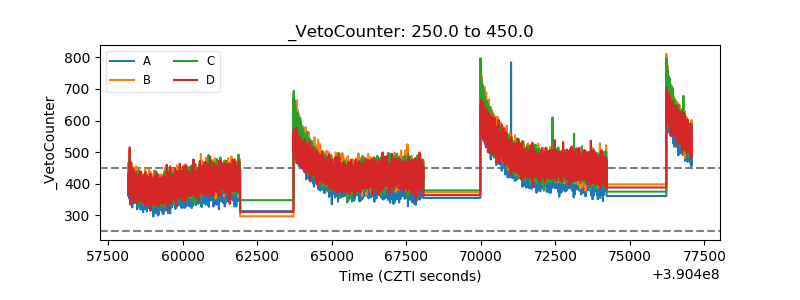 |