| Param | Original file | Final file |
|---|---|---|
| Filename | modeM0/AS1A11_080T01_9000005146_35905cztM0_level2.evt | modeM0/AS1A11_080T01_9000005146_35905cztM0_level2_quad_clean.evt |
| Size (bytes) | 578,185,920 | 104,051,520 |
| Size | 551.4 MB | 99.2 MB |
| Events in quadrant A | 3,071,101 | 711,740 |
| Events in quadrant B | 3,487,420 | 700,026 |
| Events in quadrant C | 3,242,444 | 697,042 |
| Events in quadrant D | 7,293,900 | 613,592 |
| Mode M9 | |||
|---|---|---|---|
| Quadrant | BADHDUFLAG | Total packets | Discarded packets |
| A | 0 | 26 | 0 |
| B | 0 | 26 | 0 |
| C | 0 | 26 | 0 |
| D | 0 | 26 | 0 |
| Mode SS | |||
|---|---|---|---|
| Quadrant | BADHDUFLAG | Total packets | Discarded packets |
| A | 0 | 128 | 0 |
| B | 0 | 128 | 0 |
| C | 0 | 128 | 0 |
| D | 0 | 128 | 0 |
| Mode M0 | |||
|---|---|---|---|
| Quadrant | BADHDUFLAG | Total packets | Discarded packets |
| A | 0 | 12860 | 3 |
| B | 0 | 14289 | 2 |
| C | 0 | 13109 | 2 |
| D | 0 | 25942 | 2 |
| Quadrant | Total seconds | Saturated seconds | Saturation percentage |
|---|---|---|---|
| A | 6133 | 13 | 0.211968% |
| B | 6133 | 139 | 2.266428% |
| C | 6133 | 69 | 1.125061% |
| D | 6133 | 928 | 15.131257% |
Noise dominated data is calculated using 1-second bins in cleaned event files. If a bin has >2000 counts, and if more than 50% of those come from <1% of pixels, then it is considered to be noise-dominated and hence unusable.
| Quadrant | # 1 sec bins | Bins with >0 counts | Bins with >2000 counts | High rate bins dominated by noise | Noise dominated (total time) | Noise dominated (detector-on time) | Marked lightcurve |
|---|---|---|---|---|---|---|---|
| A | 8758 | 6135 | 2 | 2 | 0.02% | 0.03% | 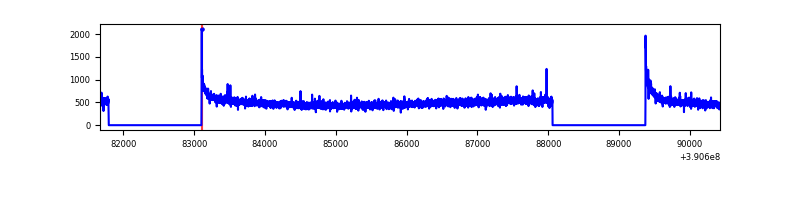 |
| B | 8758 | 6135 | 87 | 87 | 0.99% | 1.42% | 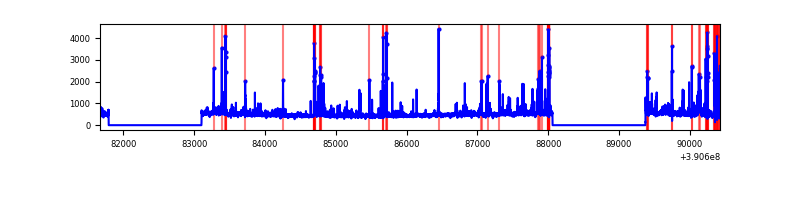 |
| C | 8758 | 6135 | 44 | 44 | 0.50% | 0.72% | 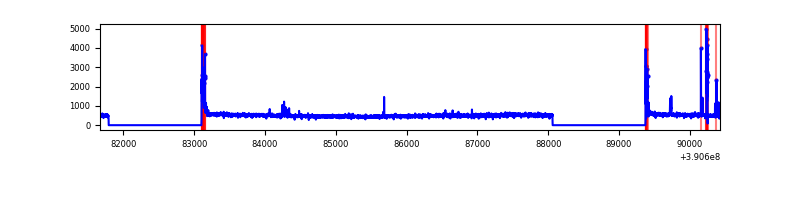 |
| D | 8758 | 6135 | 1070 | 1070 | 12.22% | 17.44% | 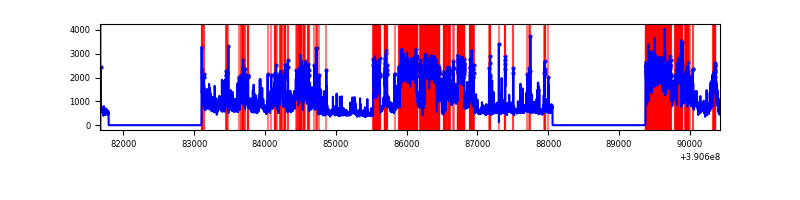 |
Top three noisy pixels from each quadrant. If the there are fewer than three noisy pixels in the level2.evt file, extra rows are filled as -1
| Pixel properties | Quadrant properties | ||||||
|---|---|---|---|---|---|---|---|
| Quadrant | DetID | PixID | Counts | Sigma | Mean | Median | Sigma |
| A | 10 | 83 | 176838 | 1171.17 | 734 | 721 | 150.4 |
| A | 15 | 169 | 44591 | 291.73 | 734 | 721 | 150.4 |
| A | 13 | 254 | 10770 | 66.83 | 734 | 721 | 150.4 |
| B | 5 | 172 | 443407 | 3201.13 | 719 | 703 | 138.3 |
| B | 0 | 213 | 93795 | 673.14 | 719 | 703 | 138.3 |
| B | 5 | 255 | 87330 | 626.39 | 719 | 703 | 138.3 |
| C | 15 | 214 | 258408 | 1547.37 | 709 | 717 | 166.5 |
| C | 0 | 10 | 141320 | 844.29 | 709 | 717 | 166.5 |
| C | 9 | 69 | 79861 | 475.24 | 709 | 717 | 166.5 |
| D | 12 | 227 | 3550233 | 20772.63 | 684 | 666 | 170.9 |
| D | 8 | 195 | 430190 | 2513.64 | 684 | 666 | 170.9 |
| D | 10 | 118 | 223128 | 1301.88 | 684 | 666 | 170.9 |
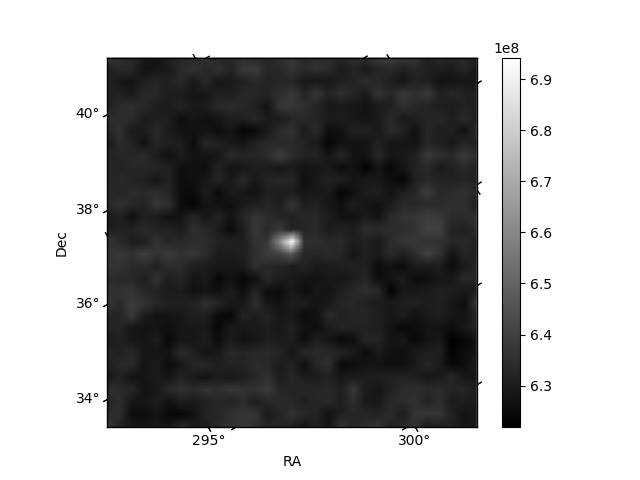
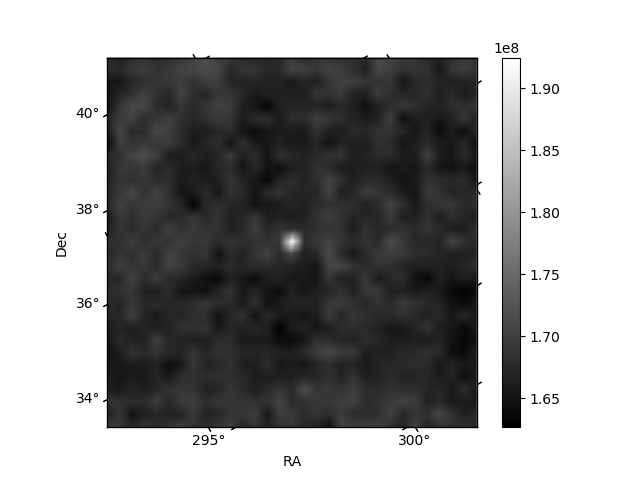
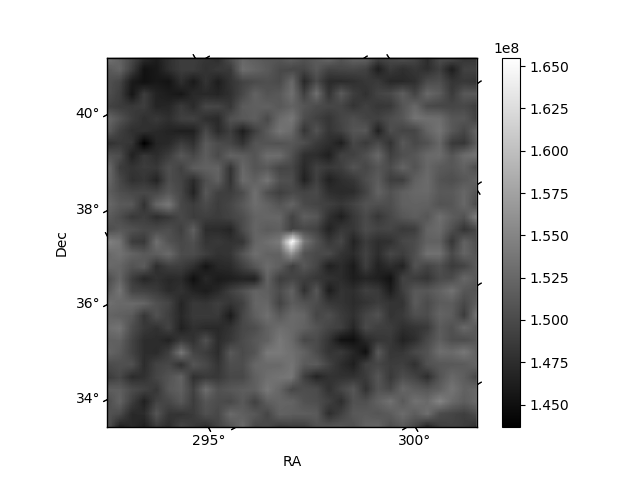
Histogram calculated using DETX and DETY for each event in the final _common_clean file
| Quadrant A | 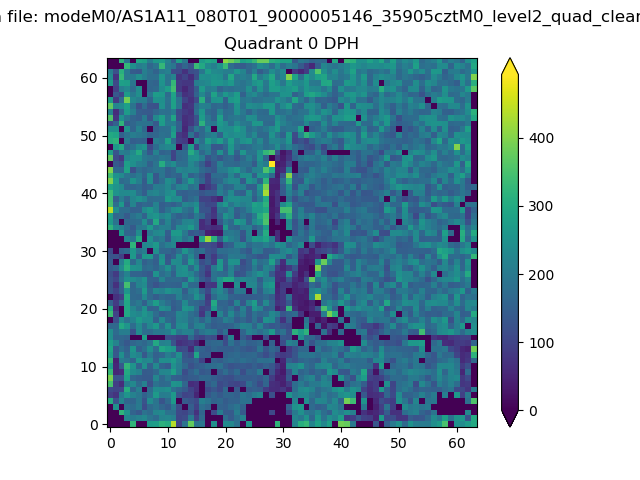 |
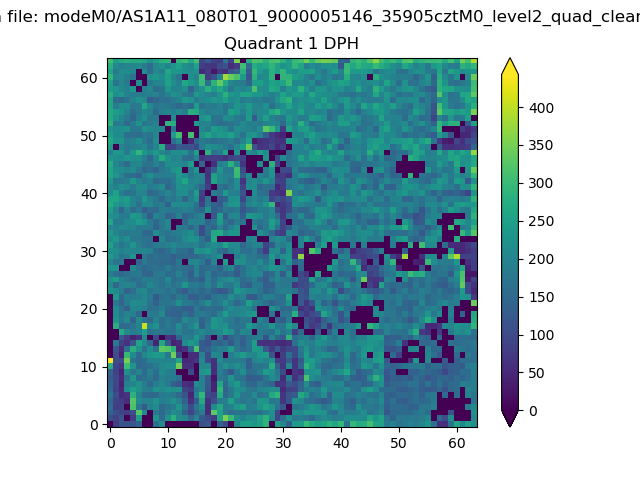 |
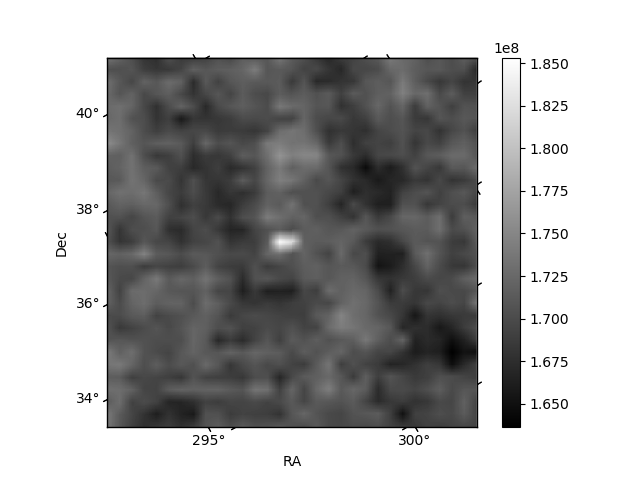
Quadrant B |
|---|---|---|---|
| Quadrant D | 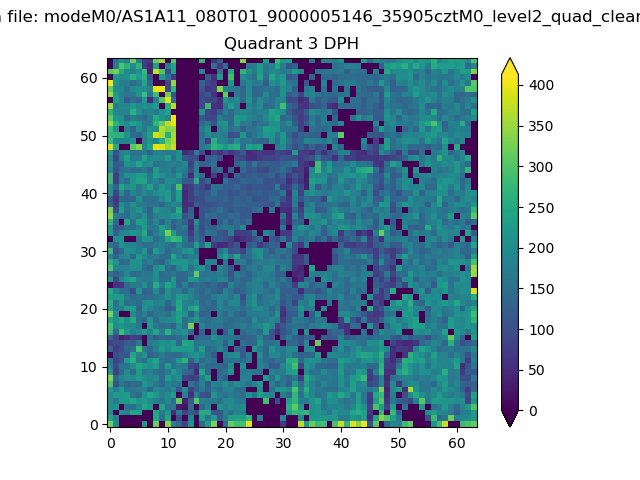 |
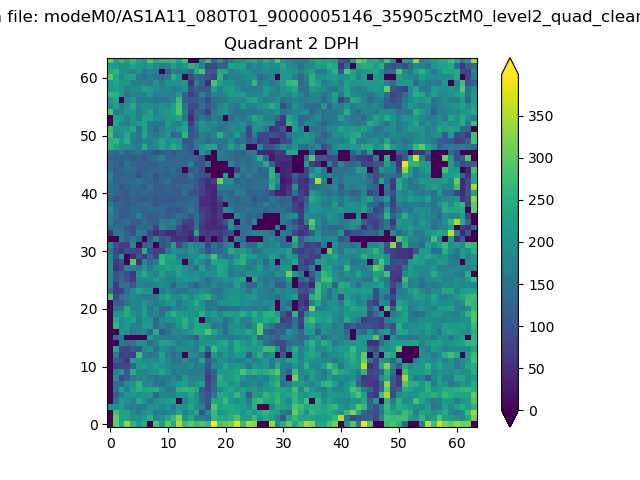 |
Quadrant C |
| Plot type | Count rate plots | Images |
|---|---|---|
| Comparison with Poisson distribution Blue bars denote a histogram of data divided into 1 sec bins. Red curve is a Poisson curve with rate = median count rate of data. |
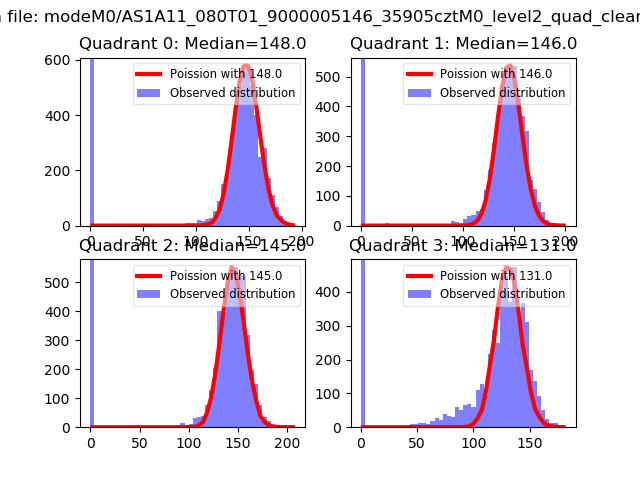 |
 |
| Quadrant-wise count rates Data is divided into 100 sec bins |
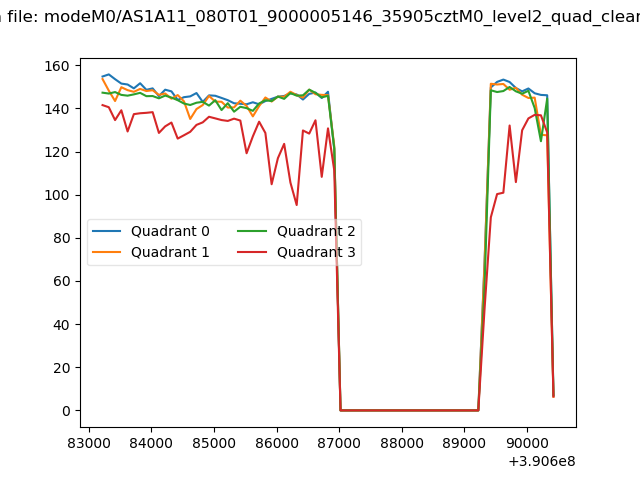 |
|
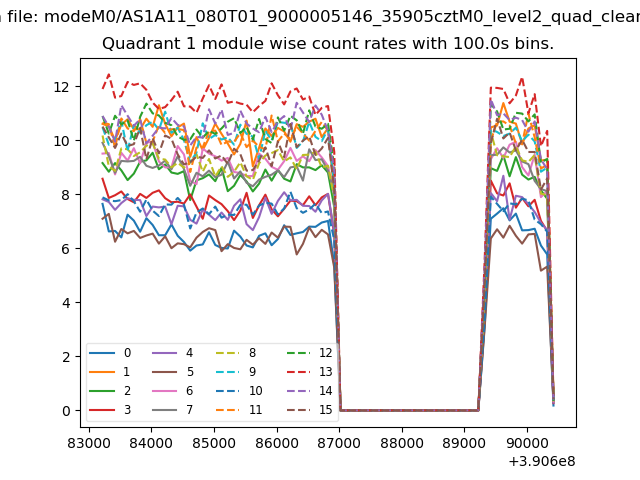
| Module-wise count rates for Quadrant A Data is divided into 100 sec bins |
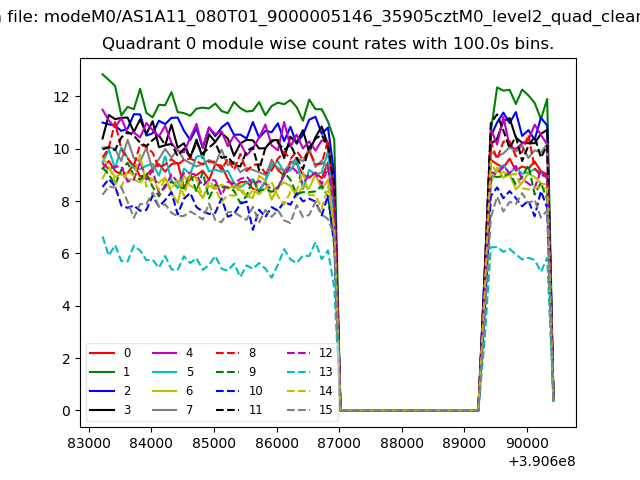 |
 |
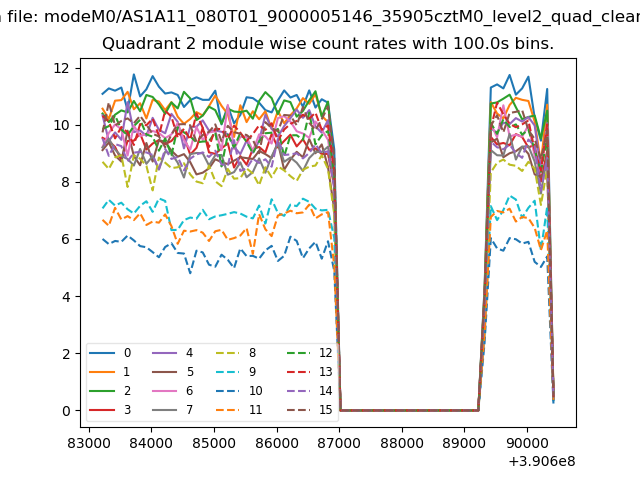
| Module-wise count rates for Quadrant B Data is divided into 100 sec bins |
 |
 |
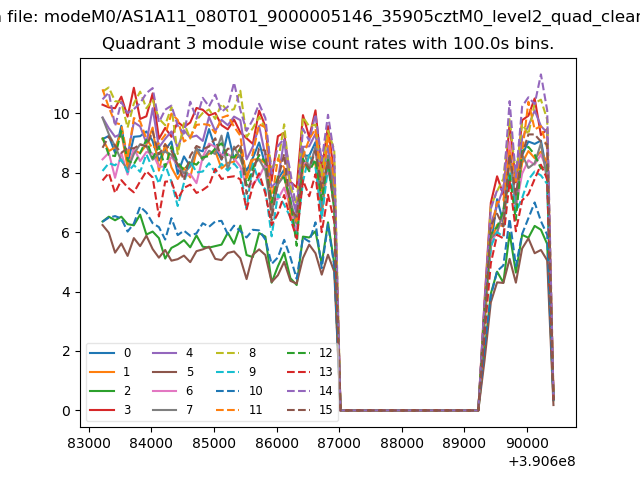
| Module-wise count rates for Quadrant C Data is divided into 100 sec bins |
 |
 |
| Module-wise count rates for Quadrant D Data is divided into 100 sec bins |
 |
 |
| Parameter | Plot |
|---|---|
| CZT HV Monitor | 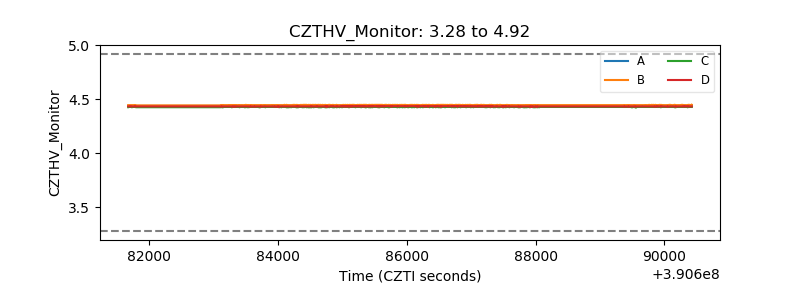 |
| D_VDD | 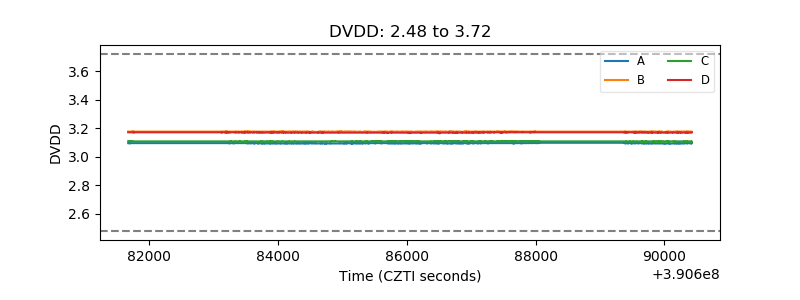 |
| Temperature 1 | 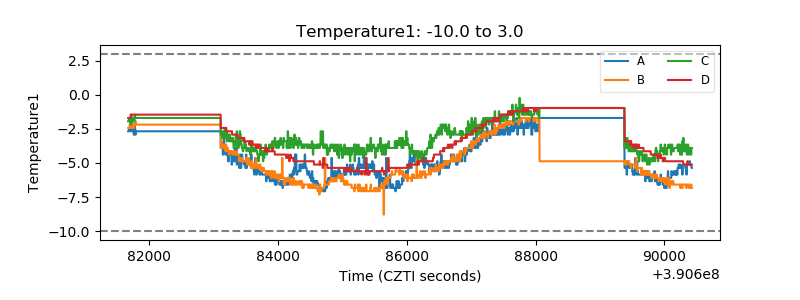 |
| Veto HV Monitor |  |
| Veto LLD | 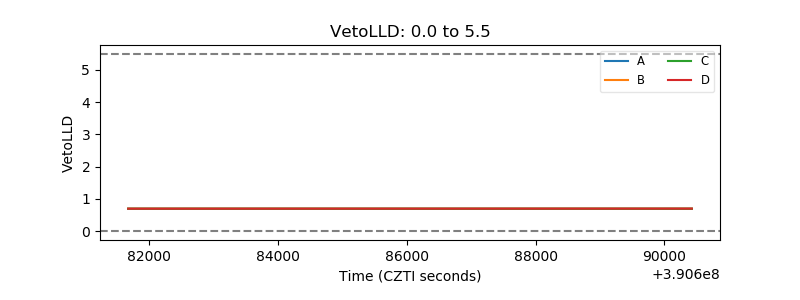 |
| Alpha Counter | 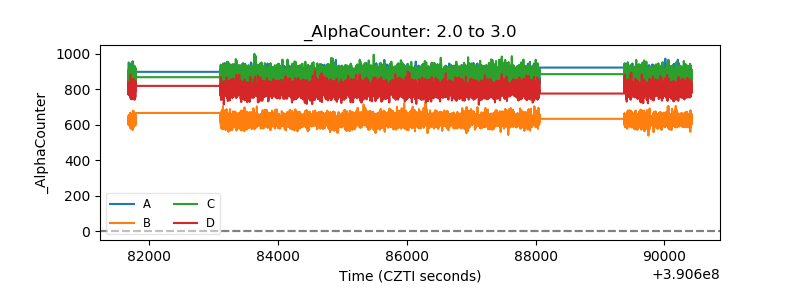 |
| _CPM_Rate | 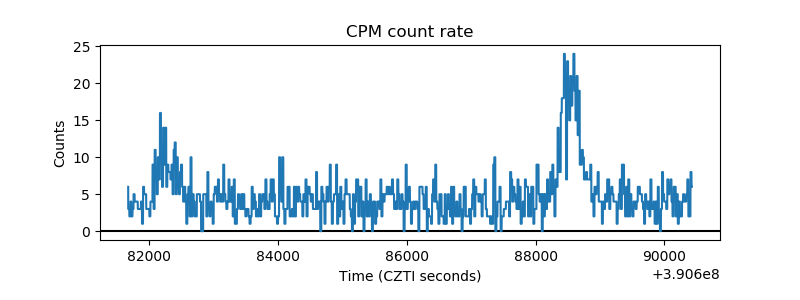 |
| CZT Counter | 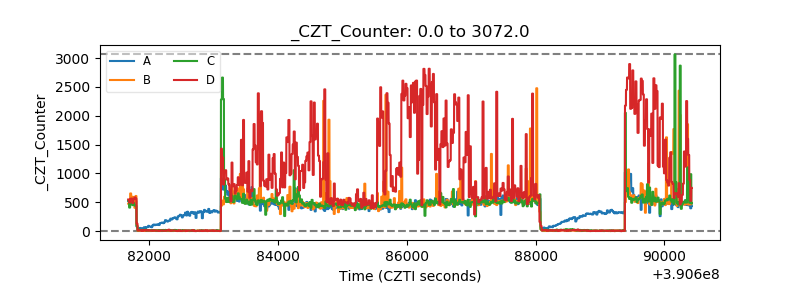 |
| +2.5 Volts monitor |  |
| +5 Volts monitor |  |
| _ROLL_ROT | 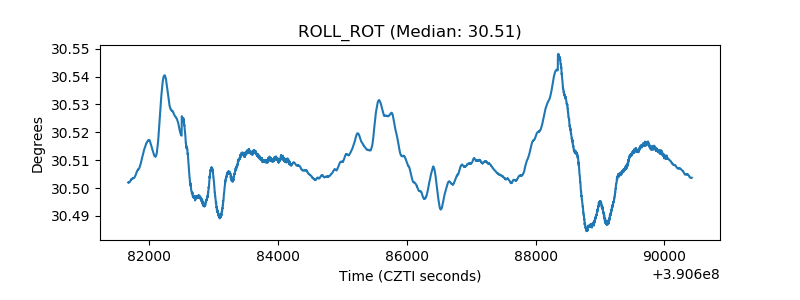 |
| _Roll_DEC | 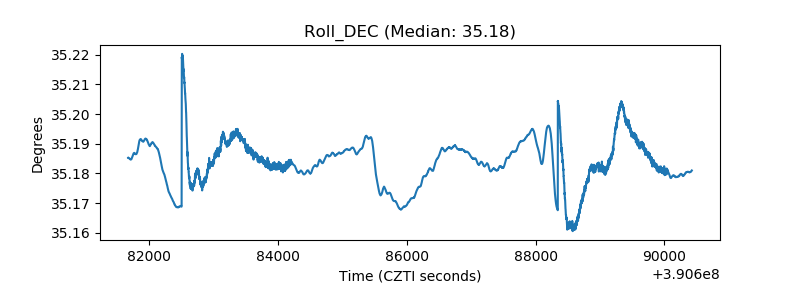 |
| _Roll_RA | 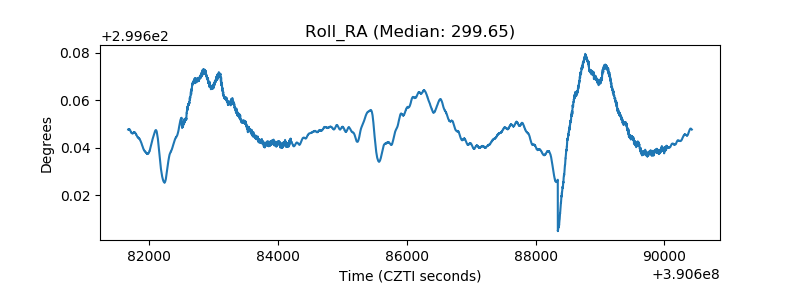 |
| Veto Counter | 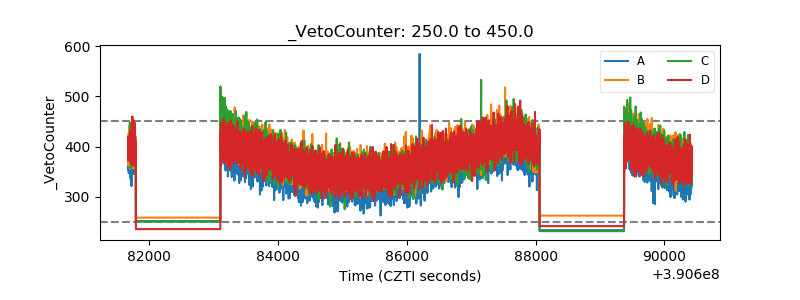 |