| Param | Original file | Final file |
|---|---|---|
| Filename | modeM0/AS1A11_080T01_9000005146_35908cztM0_level2.evt | modeM0/AS1A11_080T01_9000005146_35908cztM0_level2_quad_clean.evt |
| Size (bytes) | 479,704,320 | 77,840,640 |
| Size | 457.5 MB | 74.2 MB |
| Events in quadrant A | 2,846,976 | 511,036 |
| Events in quadrant B | 4,406,648 | 471,691 |
| Events in quadrant C | 2,908,261 | 504,674 |
| Events in quadrant D | 3,983,272 | 475,086 |
| Mode M9 | |||
|---|---|---|---|
| Quadrant | BADHDUFLAG | Total packets | Discarded packets |
| A | 0 | 28 | 0 |
| B | 0 | 28 | 0 |
| C | 0 | 28 | 0 |
| D | 0 | 29 | 0 |
| Mode SS | |||
|---|---|---|---|
| Quadrant | BADHDUFLAG | Total packets | Discarded packets |
| A | 0 | 116 | 0 |
| B | 0 | 116 | 0 |
| C | 0 | 116 | 0 |
| D | 0 | 116 | 0 |
| Mode M0 | |||
|---|---|---|---|
| Quadrant | BADHDUFLAG | Total packets | Discarded packets |
| A | 0 | 12010 | 3 |
| B | 0 | 16804 | 2 |
| C | 0 | 12038 | 2 |
| D | 0 | 15555 | 2 |
| Quadrant | Total seconds | Saturated seconds | Saturation percentage |
|---|---|---|---|
| A | 5636 | 16 | 0.283889% |
| B | 5636 | 573 | 10.166785% |
| C | 5636 | 50 | 0.887154% |
| D | 5636 | 145 | 2.572747% |
Noise dominated data is calculated using 1-second bins in cleaned event files. If a bin has >2000 counts, and if more than 50% of those come from <1% of pixels, then it is considered to be noise-dominated and hence unusable.
| Quadrant | # 1 sec bins | Bins with >0 counts | Bins with >2000 counts | High rate bins dominated by noise | Noise dominated (total time) | Noise dominated (detector-on time) | Marked lightcurve |
|---|---|---|---|---|---|---|---|
| A | 7220 | 5637 | 12 | 12 | 0.17% | 0.21% | 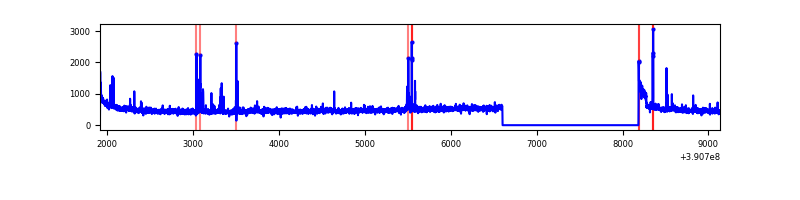 |
| B | 7220 | 5637 | 394 | 394 | 5.46% | 6.99% | 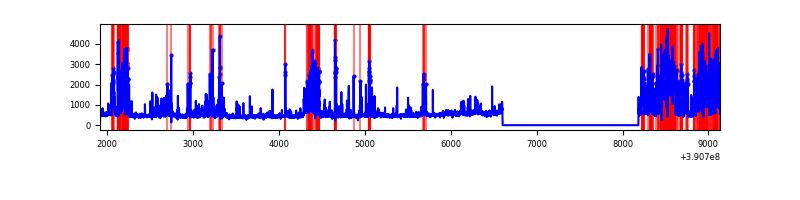 |
| C | 7220 | 5637 | 34 | 34 | 0.47% | 0.60% | 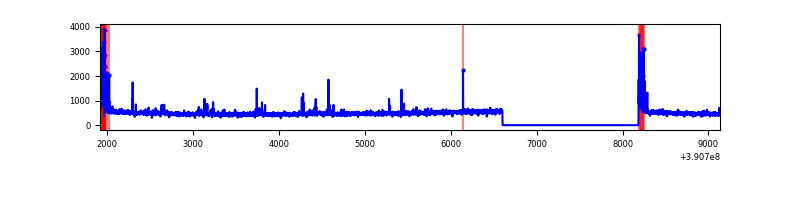 |
| D | 7220 | 5637 | 122 | 122 | 1.69% | 2.16% | 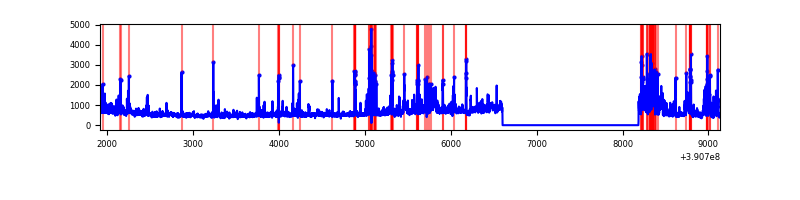 |
Top three noisy pixels from each quadrant. If the there are fewer than three noisy pixels in the level2.evt file, extra rows are filled as -1
| Pixel properties | Quadrant properties | ||||||
|---|---|---|---|---|---|---|---|
| Quadrant | DetID | PixID | Counts | Sigma | Mean | Median | Sigma |
| A | 10 | 83 | 167096 | 1256.72 | 651 | 638 | 132.5 |
| A | 9 | 143 | 67288 | 503.19 | 651 | 638 | 132.5 |
| A | 15 | 169 | 50357 | 375.37 | 651 | 638 | 132.5 |
| B | 5 | 172 | 1731742 | 14468.92 | 620 | 606 | 119.6 |
| B | 5 | 255 | 76153 | 631.43 | 620 | 606 | 119.6 |
| B | 5 | 63 | 58923 | 487.42 | 620 | 606 | 119.6 |
| C | 15 | 214 | 237630 | 1610.44 | 629 | 634 | 147.2 |
| C | 0 | 10 | 168525 | 1140.85 | 629 | 634 | 147.2 |
| C | 0 | 207 | 48313 | 323.99 | 629 | 634 | 147.2 |
| D | 8 | 195 | 569833 | 3725.24 | 622 | 604 | 152.8 |
| D | 7 | 223 | 330477 | 2158.81 | 622 | 604 | 152.8 |
| D | 13 | 249 | 173855 | 1133.82 | 622 | 604 | 152.8 |
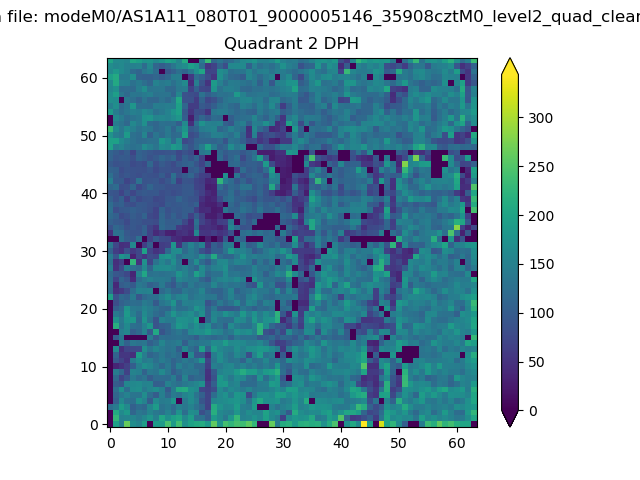
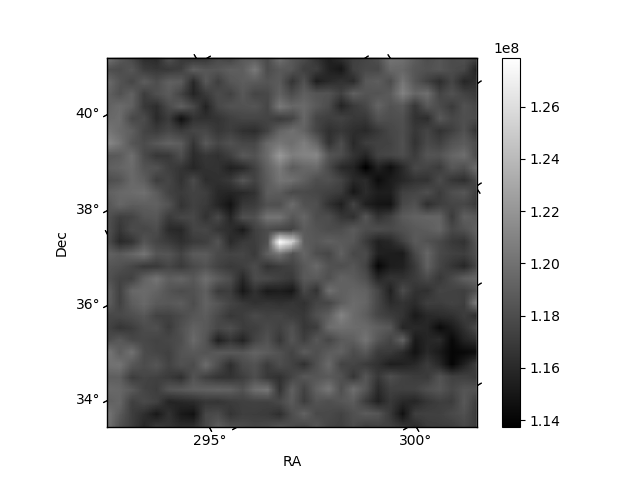
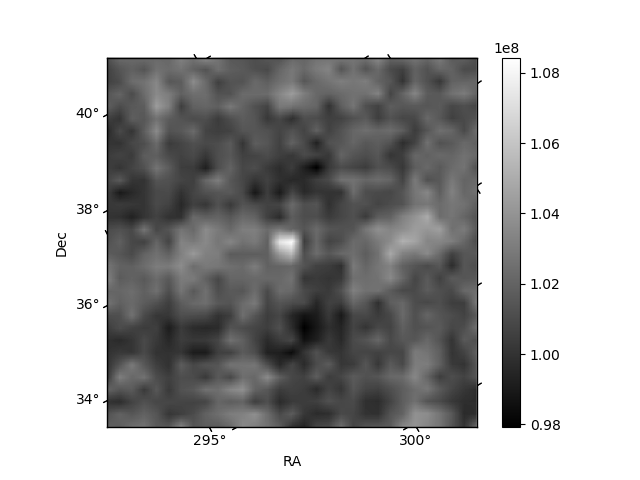
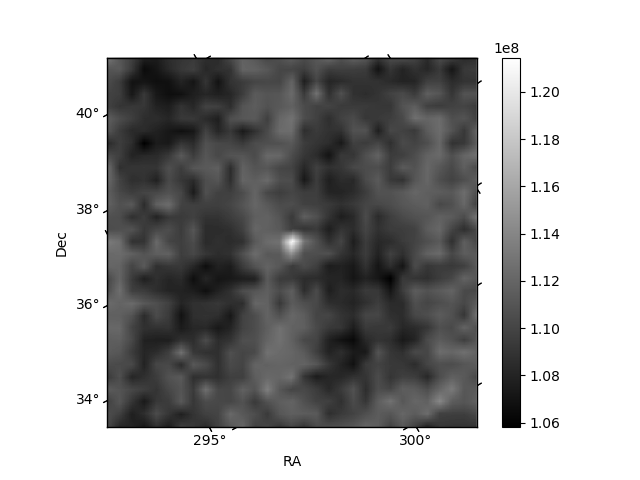
Histogram calculated using DETX and DETY for each event in the final _common_clean file
| Quadrant A | 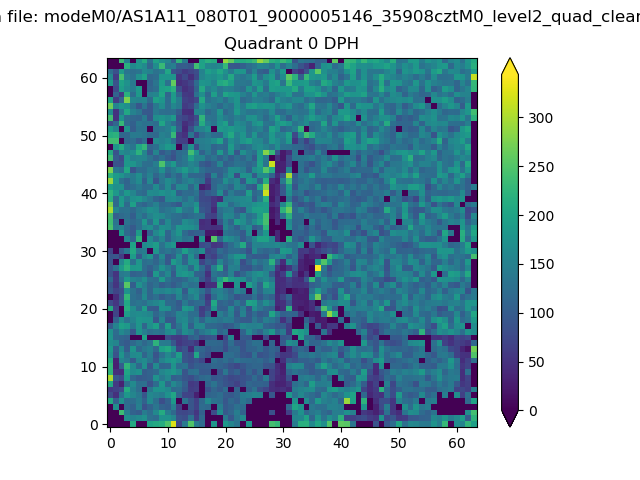 |
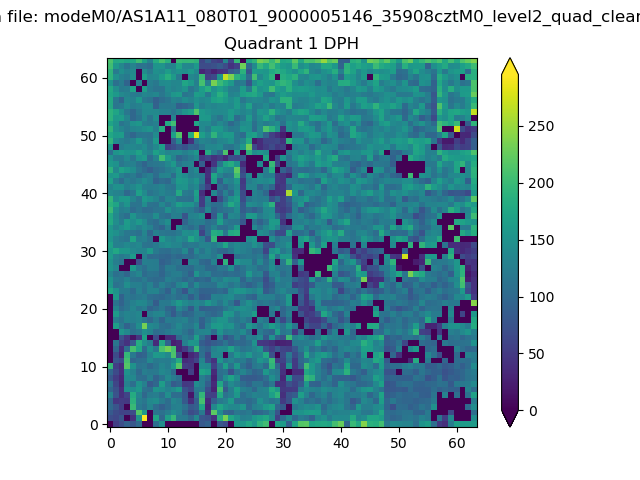 |
Quadrant B |
|---|---|---|---|
| Quadrant D | 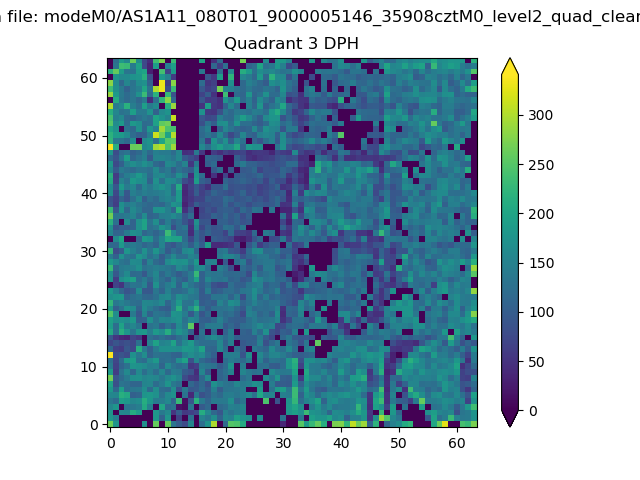 |
 |
Quadrant C |
| Plot type | Count rate plots | Images |
|---|---|---|
| Comparison with Poisson distribution Blue bars denote a histogram of data divided into 1 sec bins. Red curve is a Poisson curve with rate = median count rate of data. |
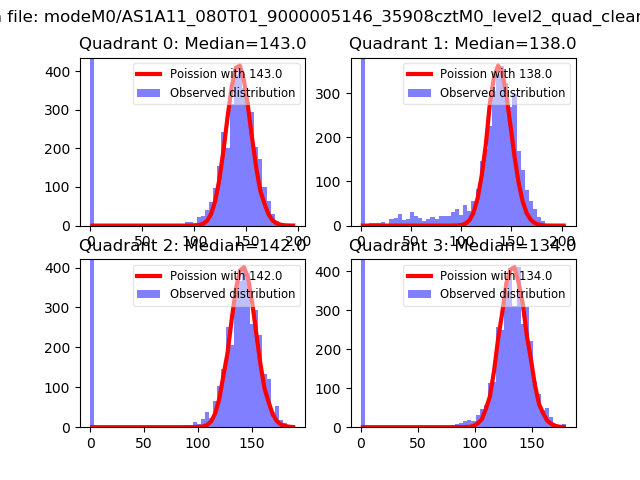 |
 |
| Quadrant-wise count rates Data is divided into 100 sec bins |
 |
|
| Module-wise count rates for Quadrant A Data is divided into 100 sec bins |
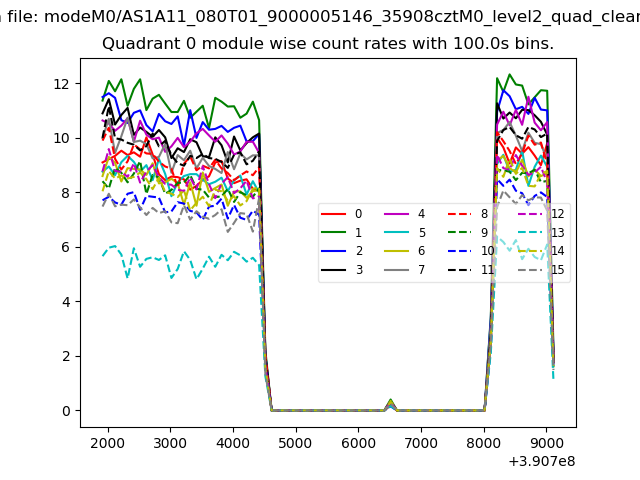 |
 |
| Module-wise count rates for Quadrant B Data is divided into 100 sec bins |
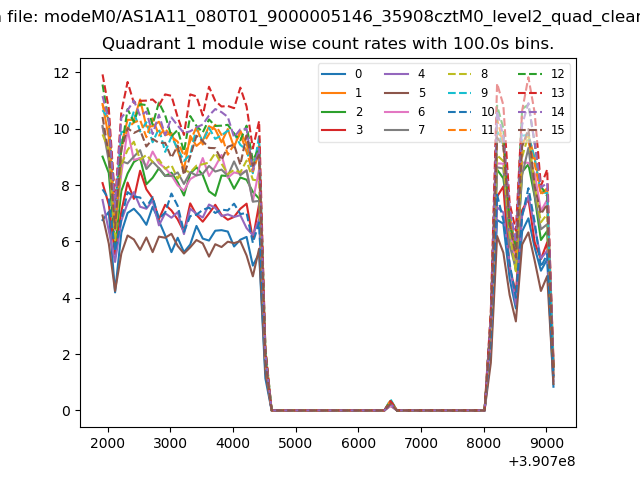 |
 |
| Module-wise count rates for Quadrant C Data is divided into 100 sec bins |
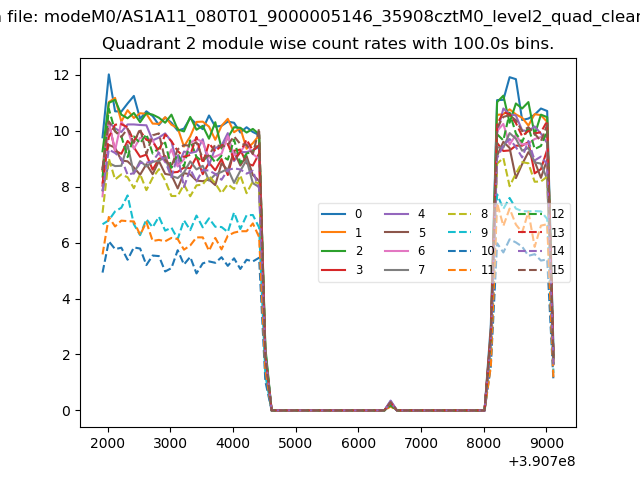 |
 |
| Module-wise count rates for Quadrant D Data is divided into 100 sec bins |
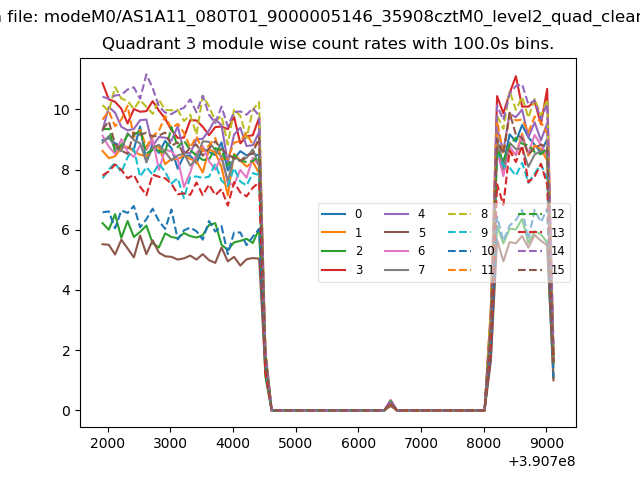 |
 |
| Parameter | Plot |
|---|---|
| CZT HV Monitor | 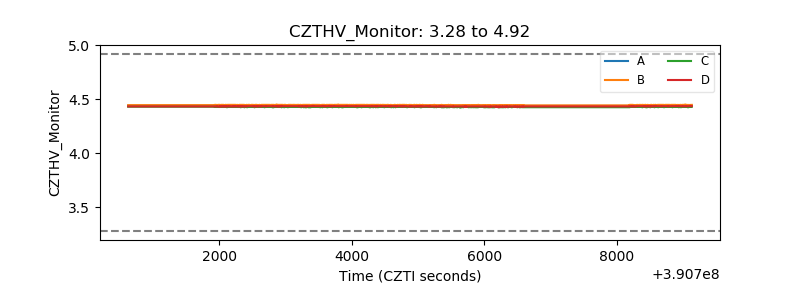 |
| D_VDD | 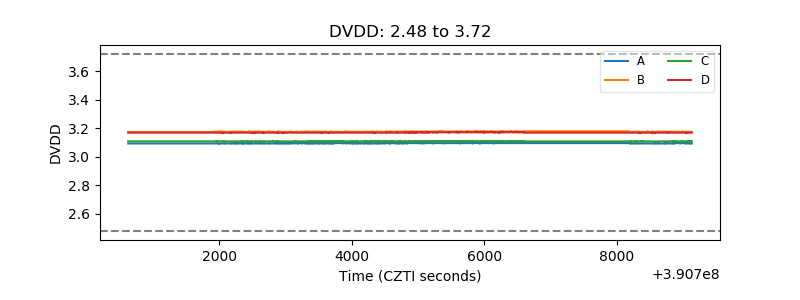 |
| Temperature 1 | 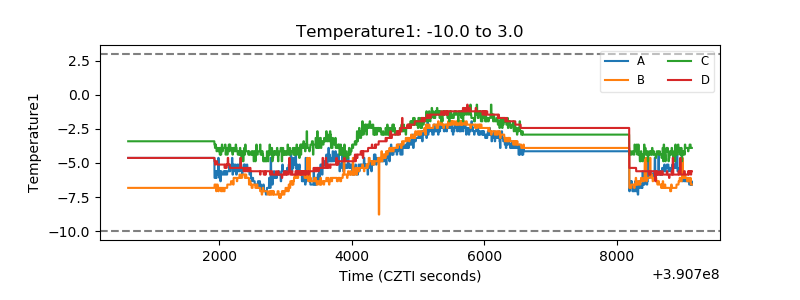 |
| Veto HV Monitor | 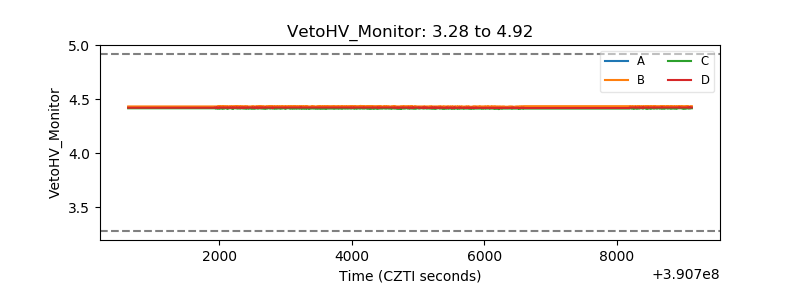 |
| Veto LLD | 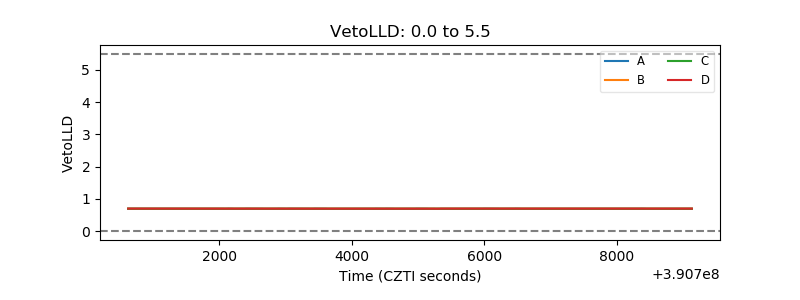 |
| Alpha Counter | 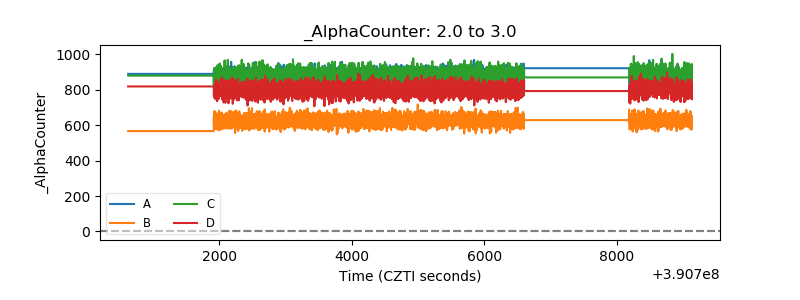 |
| _CPM_Rate | 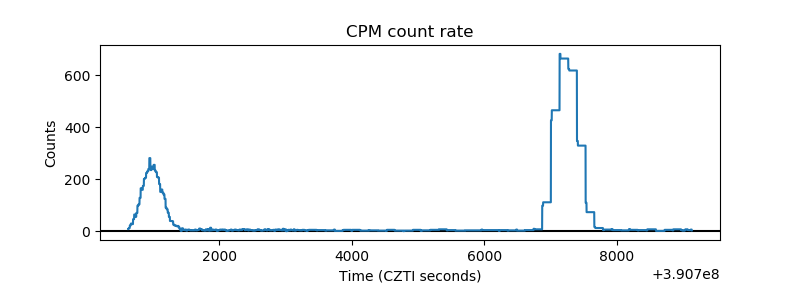 |
| CZT Counter | 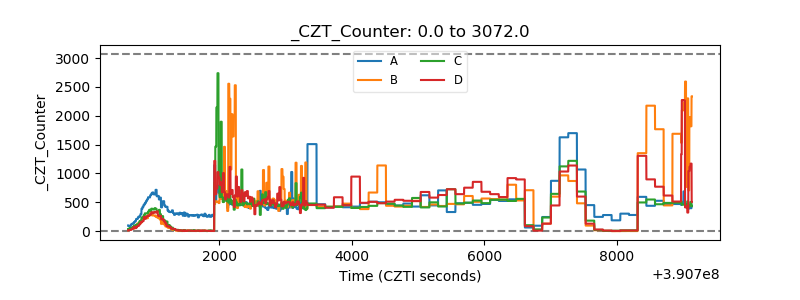 |
| +2.5 Volts monitor |  |
| +5 Volts monitor |  |
| _ROLL_ROT | 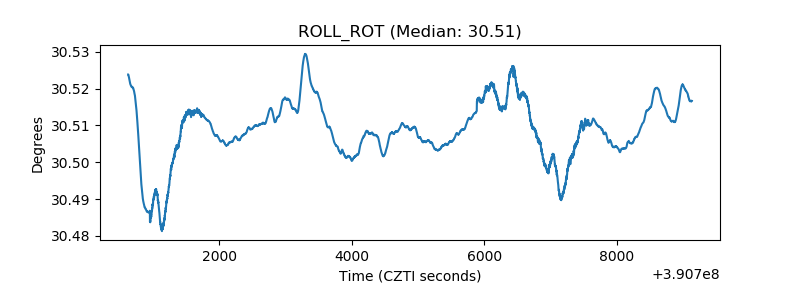 |
| _Roll_DEC | 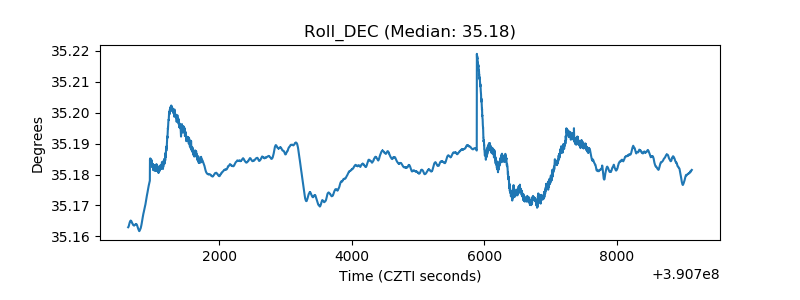 |
| _Roll_RA | 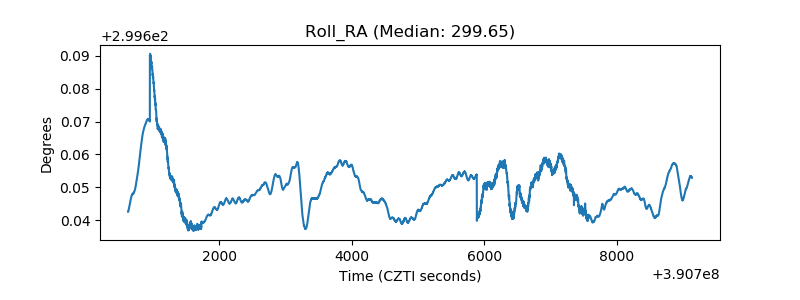 |
| Veto Counter | 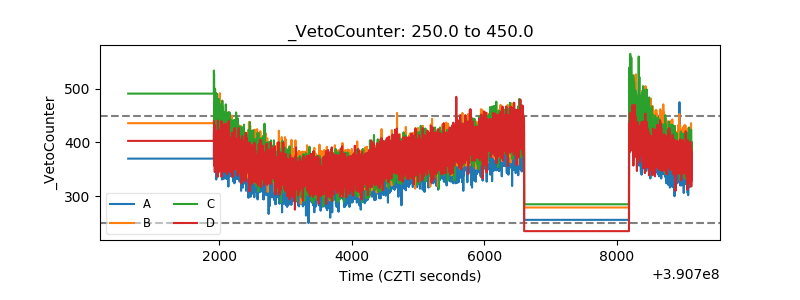 |