| Param | Original file | Final file |
|---|---|---|
| Filename | modeM0/AS1A11_080T01_9000005146_35915cztM0_level2.evt | modeM0/AS1A11_080T01_9000005146_35915cztM0_level2_quad_clean.evt |
| Size (bytes) | 529,119,360 | 54,760,320 |
| Size | 504.6 MB | 52.2 MB |
| Events in quadrant A | 3,579,826 | 342,489 |
| Events in quadrant B | 4,147,282 | 318,503 |
| Events in quadrant C | 2,846,955 | 330,889 |
| Events in quadrant D | 5,106,605 | 309,358 |
| Mode M9 | |||
|---|---|---|---|
| Quadrant | BADHDUFLAG | Total packets | Discarded packets |
| A | 0 | 23 | 0 |
| B | 0 | 23 | 0 |
| C | 0 | 23 | 0 |
| D | 0 | 24 | 0 |
| Mode SS | |||
|---|---|---|---|
| Quadrant | BADHDUFLAG | Total packets | Discarded packets |
| A | 0 | 104 | 0 |
| B | 0 | 104 | 0 |
| C | 0 | 104 | 0 |
| D | 0 | 104 | 0 |
| Mode M0 | |||
|---|---|---|---|
| Quadrant | BADHDUFLAG | Total packets | Discarded packets |
| A | 0 | 14054 | 3 |
| B | 0 | 15520 | 2 |
| C | 0 | 11130 | 2 |
| D | 0 | 18765 | 2 |
| Quadrant | Total seconds | Saturated seconds | Saturation percentage |
|---|---|---|---|
| A | 5084 | 25 | 0.491739% |
| B | 5084 | 475 | 9.343037% |
| C | 5084 | 85 | 1.671912% |
| D | 5084 | 255 | 5.015736% |
Noise dominated data is calculated using 1-second bins in cleaned event files. If a bin has >2000 counts, and if more than 50% of those come from <1% of pixels, then it is considered to be noise-dominated and hence unusable.
| Quadrant | # 1 sec bins | Bins with >0 counts | Bins with >2000 counts | High rate bins dominated by noise | Noise dominated (total time) | Noise dominated (detector-on time) | Marked lightcurve |
|---|---|---|---|---|---|---|---|
| A | 7207 | 5085 | 4 | 4 | 0.06% | 0.08% | 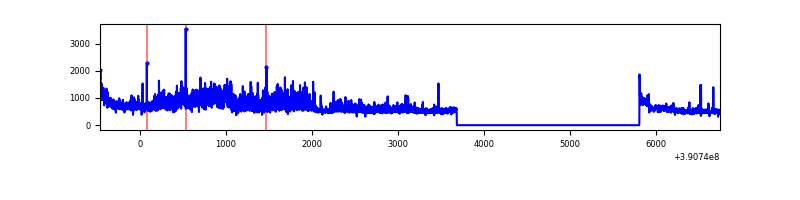 |
| B | 7207 | 5085 | 324 | 324 | 4.50% | 6.37% | 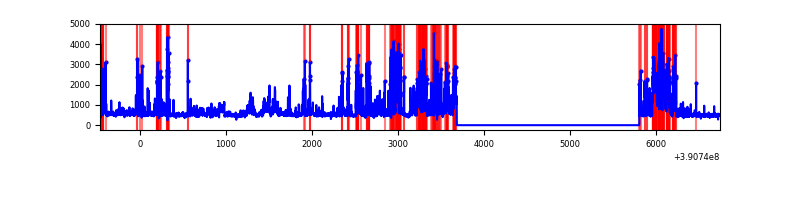 |
| C | 7207 | 5085 | 57 | 57 | 0.79% | 1.12% | 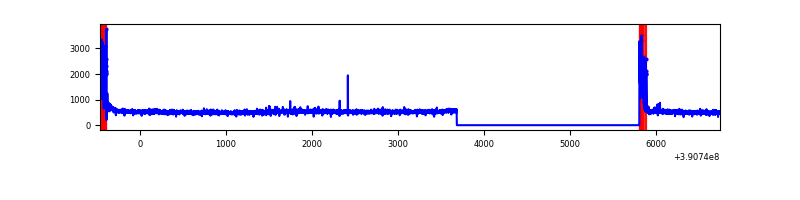 |
| D | 7207 | 5085 | 234 | 234 | 3.25% | 4.60% | 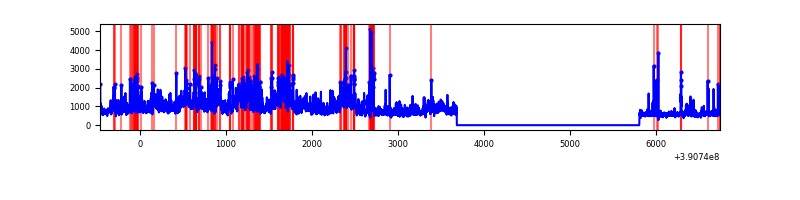 |
Top three noisy pixels from each quadrant. If the there are fewer than three noisy pixels in the level2.evt file, extra rows are filled as -1
| Pixel properties | Quadrant properties | ||||||
|---|---|---|---|---|---|---|---|
| Quadrant | DetID | PixID | Counts | Sigma | Mean | Median | Sigma |
| A | 15 | 169 | 848278 | 6550.42 | 644 | 634 | 129.4 |
| A | 10 | 83 | 163135 | 1255.78 | 644 | 634 | 129.4 |
| A | 9 | 143 | 42063 | 320.16 | 644 | 634 | 129.4 |
| B | 5 | 172 | 1411975 | 12334.26 | 608 | 594 | 114.4 |
| B | 5 | 63 | 200696 | 1748.72 | 608 | 594 | 114.4 |
| B | 5 | 255 | 65047 | 563.26 | 608 | 594 | 114.4 |
| C | 0 | 10 | 230113 | 1621.4 | 612 | 618 | 141.5 |
| C | 15 | 214 | 215378 | 1517.3 | 612 | 618 | 141.5 |
| C | 0 | 207 | 10232 | 67.92 | 612 | 618 | 141.5 |
| D | 12 | 227 | 958179 | 6349.33 | 612 | 596 | 150.8 |
| D | 1 | 52 | 837726 | 5550.66 | 612 | 596 | 150.8 |
| D | 8 | 195 | 341261 | 2258.81 | 612 | 596 | 150.8 |
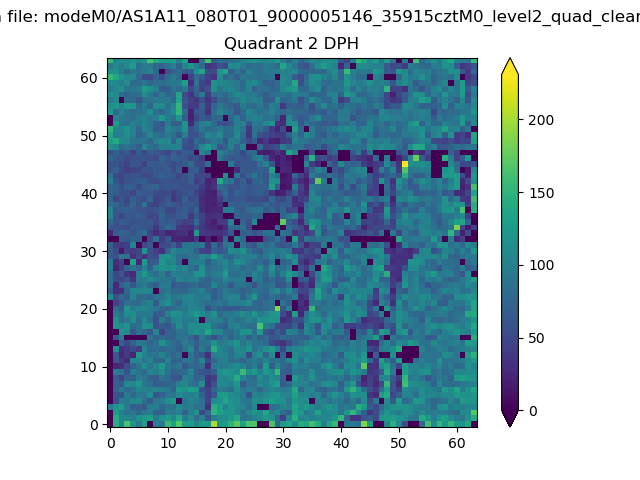
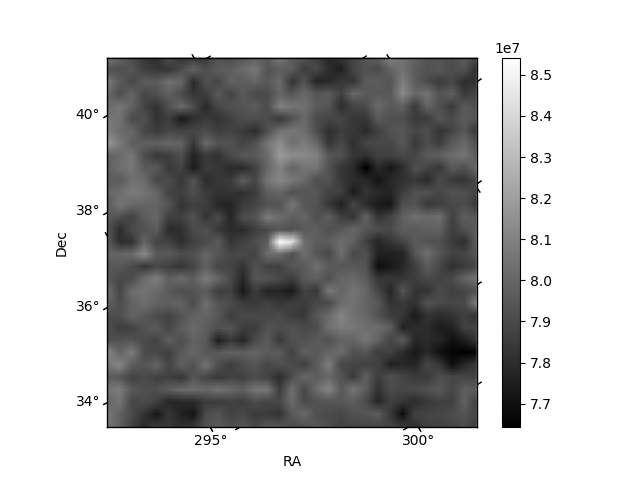
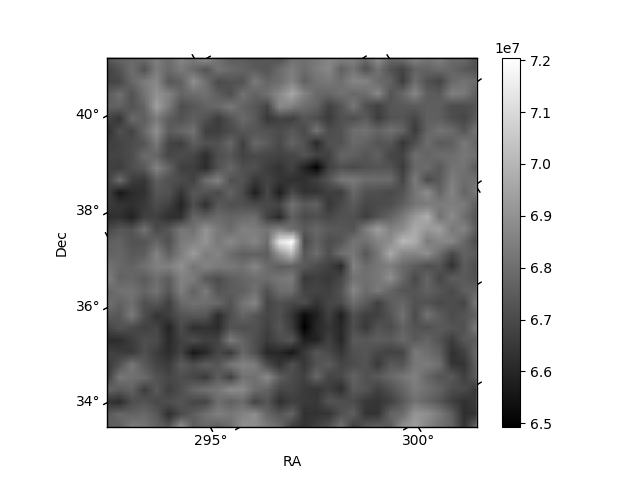
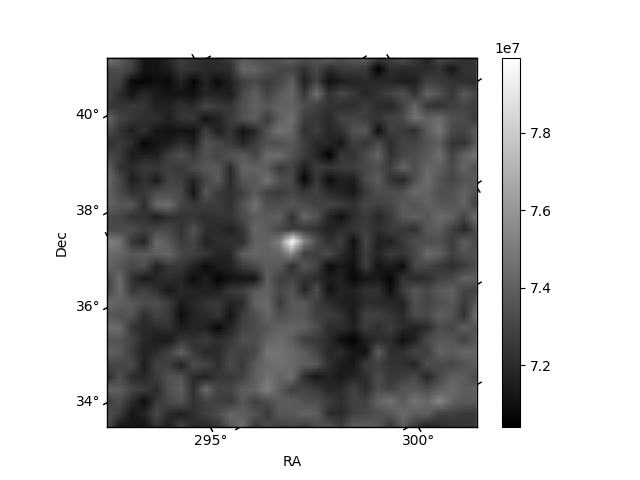
Histogram calculated using DETX and DETY for each event in the final _common_clean file
| Quadrant A | 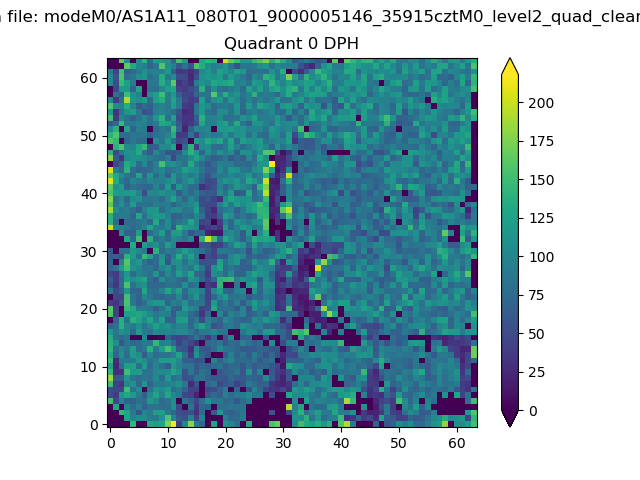 |
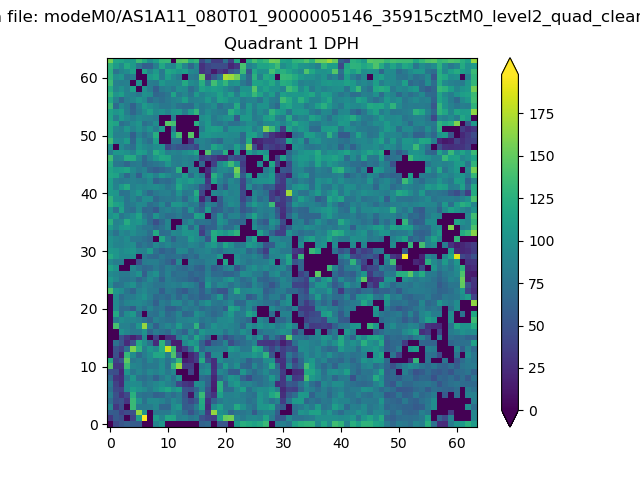 |
Quadrant B |
|---|---|---|---|
| Quadrant D | 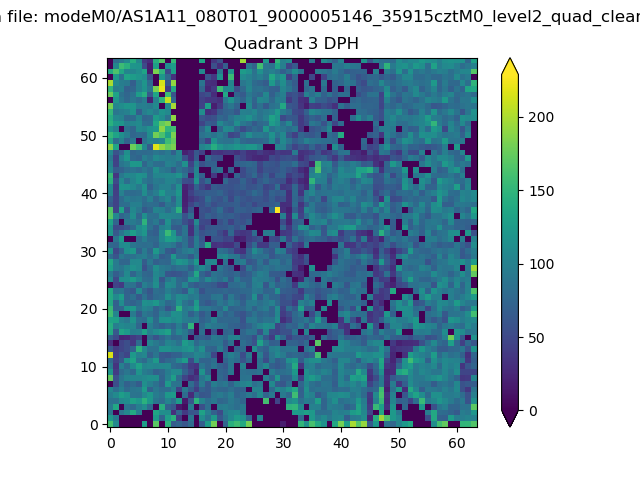 |
 |
Quadrant C |
| Plot type | Count rate plots | Images |
|---|---|---|
| Comparison with Poisson distribution Blue bars denote a histogram of data divided into 1 sec bins. Red curve is a Poisson curve with rate = median count rate of data. |
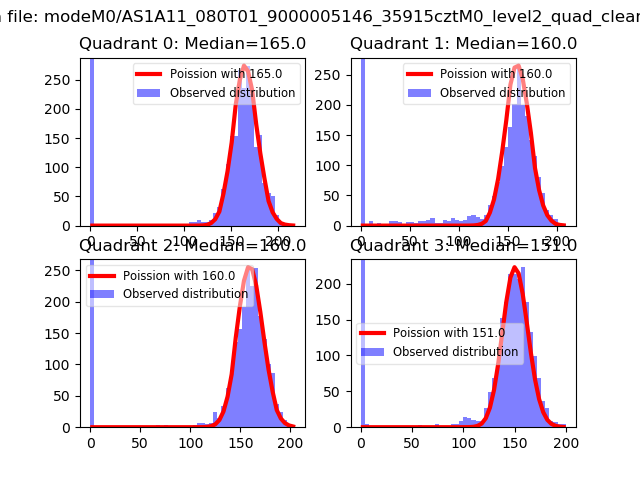 |
 |
| Quadrant-wise count rates Data is divided into 100 sec bins |
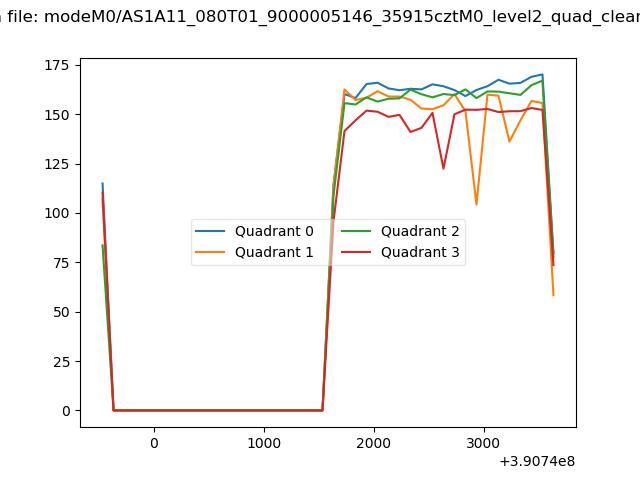 |
|
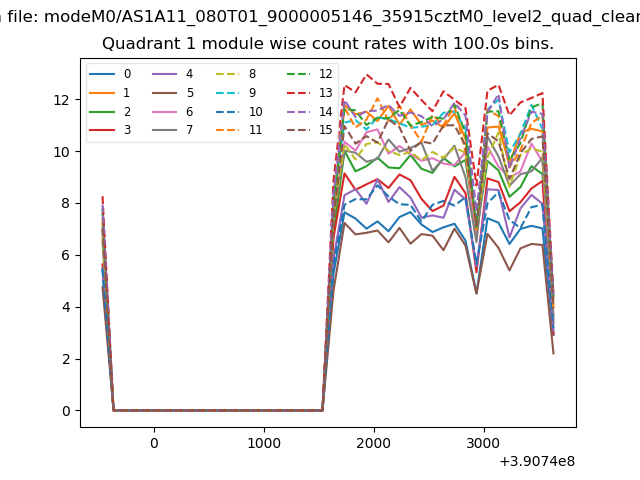
| Module-wise count rates for Quadrant A Data is divided into 100 sec bins |
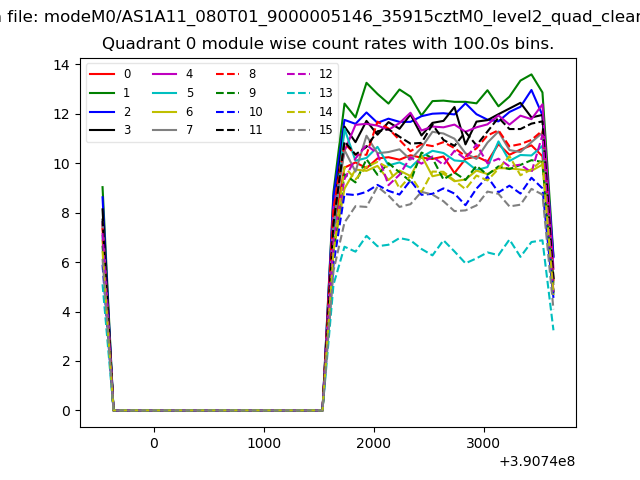 |
 |
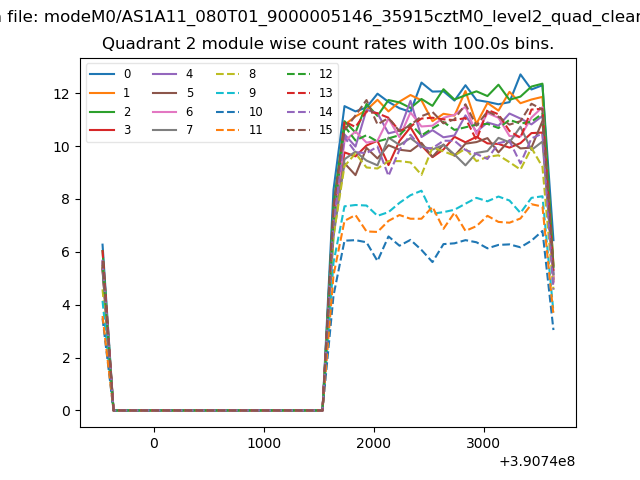
| Module-wise count rates for Quadrant B Data is divided into 100 sec bins |
 |
 |
| Module-wise count rates for Quadrant C Data is divided into 100 sec bins |
 |
 |
| Module-wise count rates for Quadrant D Data is divided into 100 sec bins |
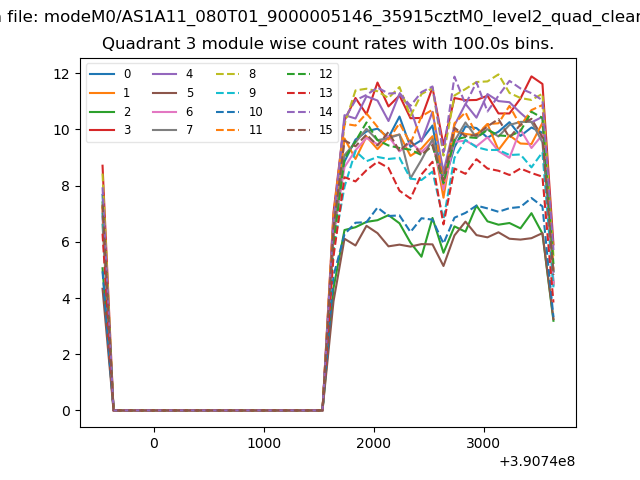 |
 |
| Parameter | Plot |
|---|---|
| CZT HV Monitor | 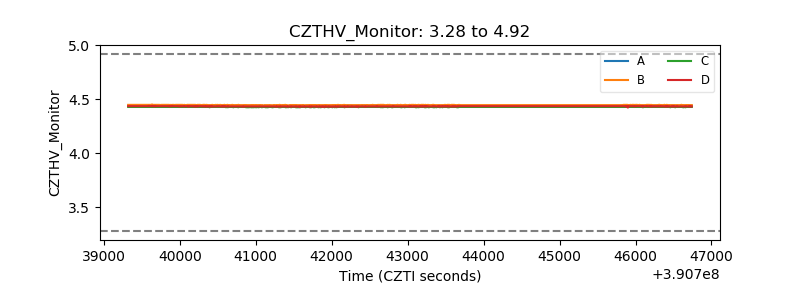 |
| D_VDD | 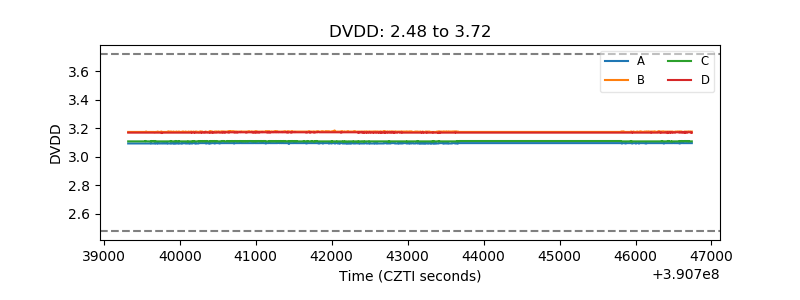 |
| Temperature 1 | 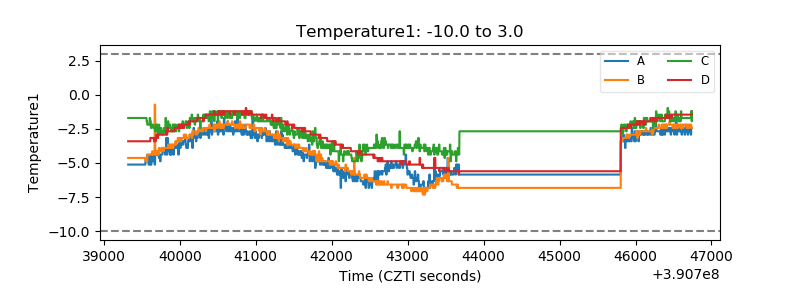 |
| Veto HV Monitor | 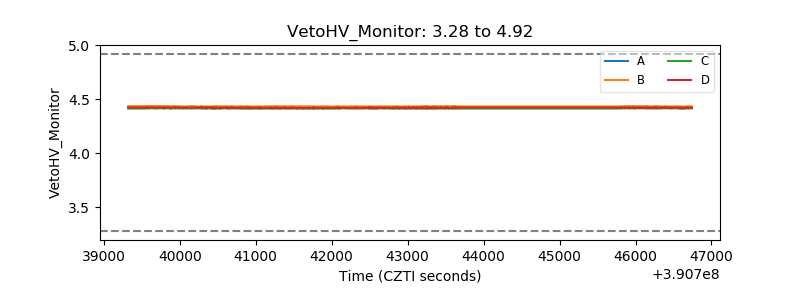 |
| Veto LLD | 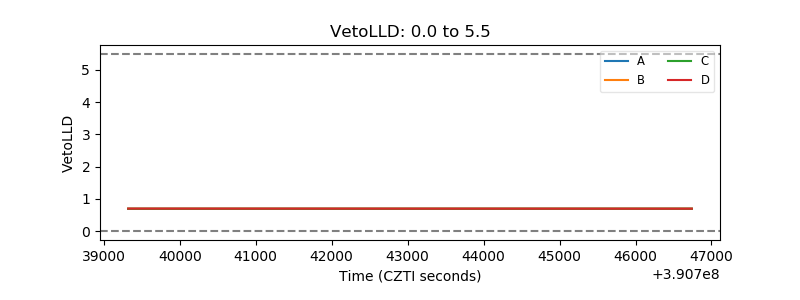 |
| Alpha Counter | 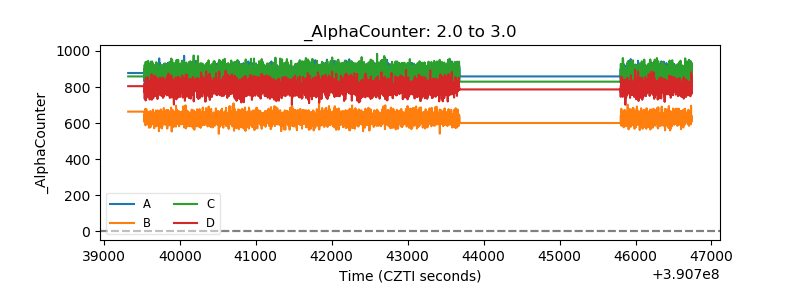 |
| _CPM_Rate | 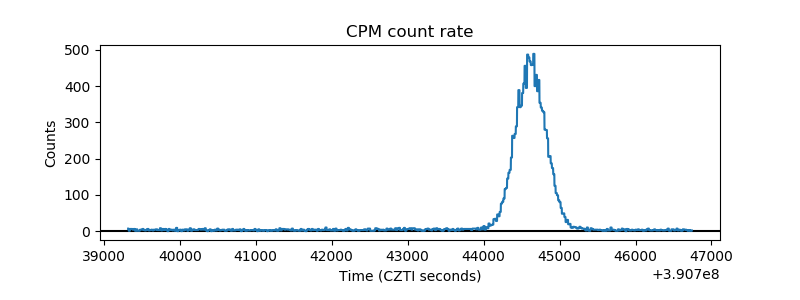 |
| CZT Counter | 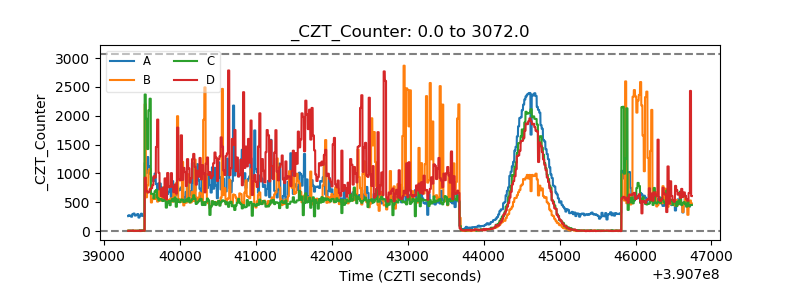 |
| +2.5 Volts monitor | 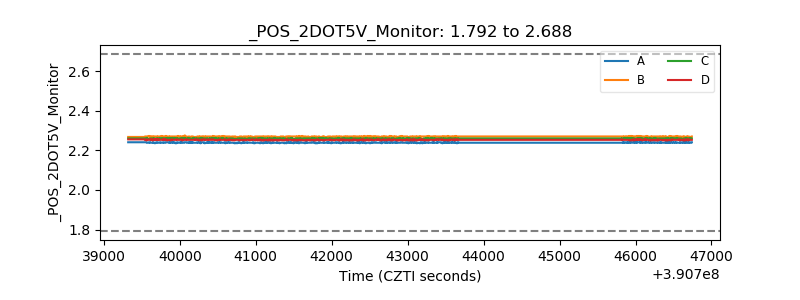 |
| +5 Volts monitor | 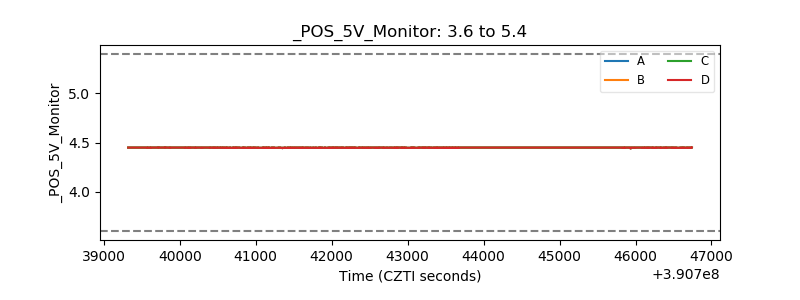 |
| _ROLL_ROT | 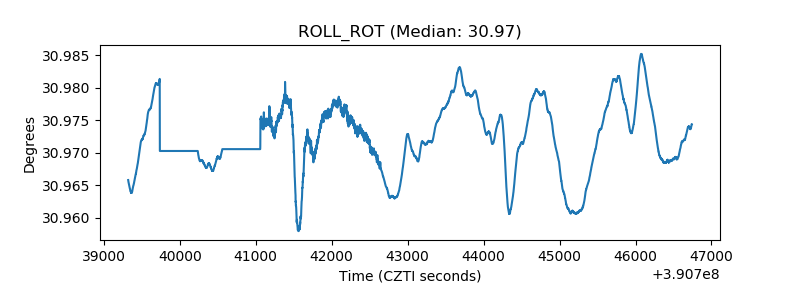 |
| _Roll_DEC |  |
| _Roll_RA | 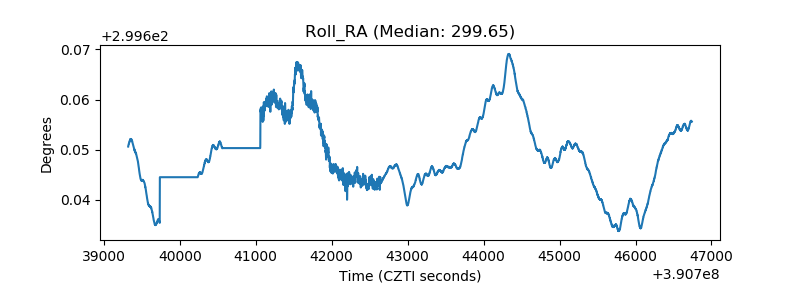 |
| Veto Counter |  |