| Param | Original file | Final file |
|---|---|---|
| Filename | modeM0/AS1A11_080T01_9000005146_35928cztM0_level2.evt | modeM0/AS1A11_080T01_9000005146_35928cztM0_level2_quad_clean.evt |
| Size (bytes) | 1,286,490,240 | 168,140,160 |
| Size | 1.2 GB | 160.4 MB |
| Events in quadrant A | 8,967,985 | 1,081,337 |
| Events in quadrant B | 8,411,173 | 1,085,959 |
| Events in quadrant C | 7,498,115 | 1,046,347 |
| Events in quadrant D | 13,189,189 | 960,673 |
| Mode M9 | |||
|---|---|---|---|
| Quadrant | BADHDUFLAG | Total packets | Discarded packets |
| A | 0 | 61 | 0 |
| B | 0 | 61 | 0 |
| C | 0 | 61 | 0 |
| D | 0 | 61 | 0 |
| Mode SS | |||
|---|---|---|---|
| Quadrant | BADHDUFLAG | Total packets | Discarded packets |
| A | 0 | 270 | 0 |
| B | 0 | 270 | 0 |
| C | 0 | 270 | 0 |
| D | 0 | 270 | 0 |
| Mode M0 | |||
|---|---|---|---|
| Quadrant | BADHDUFLAG | Total packets | Discarded packets |
| A | 0 | 34701 | 7 |
| B | 0 | 32894 | 3 |
| C | 0 | 29693 | 3 |
| D | 0 | 47678 | 3 |
| Quadrant | Total seconds | Saturated seconds | Saturation percentage |
|---|---|---|---|
| A | 13287 | 313 | 2.355686% |
| B | 13288 | 536 | 4.033715% |
| C | 13288 | 205 | 1.542745% |
| D | 13288 | 2394 | 18.016255% |
Noise dominated data is calculated using 1-second bins in cleaned event files. If a bin has >2000 counts, and if more than 50% of those come from <1% of pixels, then it is considered to be noise-dominated and hence unusable.
| Quadrant | # 1 sec bins | Bins with >0 counts | Bins with >2000 counts | High rate bins dominated by noise | Noise dominated (total time) | Noise dominated (detector-on time) | Marked lightcurve |
|---|---|---|---|---|---|---|---|
| A | 19356 | 13291 | 210 | 210 | 1.08% | 1.58% | 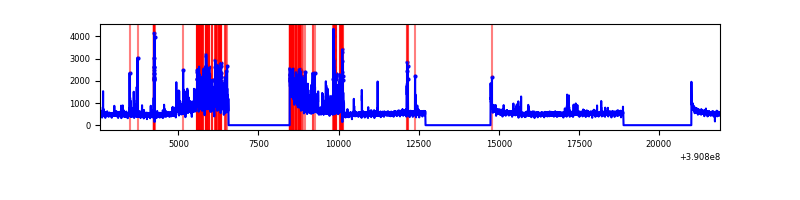 |
| B | 19356 | 13291 | 362 | 362 | 1.87% | 2.72% | 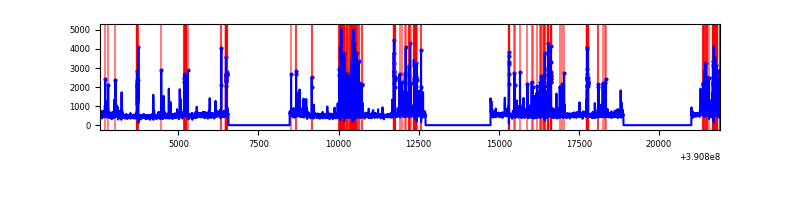 |
| C | 19356 | 13291 | 153 | 153 | 0.79% | 1.15% | 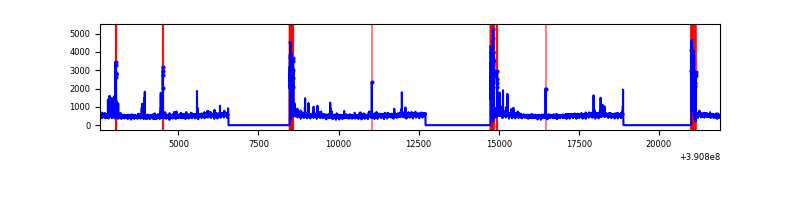 |
| D | 19356 | 13291 | 2177 | 2177 | 11.25% | 16.38% | 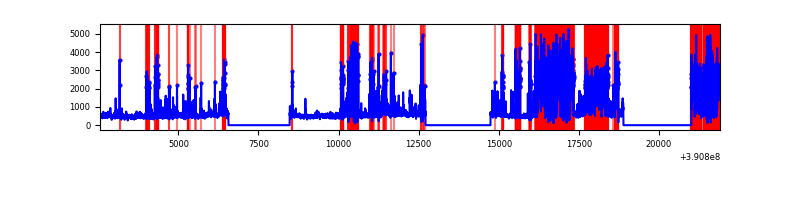 |
Top three noisy pixels from each quadrant. If the there are fewer than three noisy pixels in the level2.evt file, extra rows are filled as -1
| Pixel properties | Quadrant properties | ||||||
|---|---|---|---|---|---|---|---|
| Quadrant | DetID | PixID | Counts | Sigma | Mean | Median | Sigma |
| A | 15 | 169 | 1900217 | 5678.33 | 1685 | 1661 | 334.4 |
| A | 10 | 83 | 323719 | 963.23 | 1685 | 1661 | 334.4 |
| A | 9 | 143 | 187290 | 555.19 | 1685 | 1661 | 334.4 |
| B | 5 | 172 | 1647286 | 5439.83 | 1631 | 1596 | 302.5 |
| B | 5 | 255 | 192350 | 630.54 | 1631 | 1596 | 302.5 |
| B | 4 | 67 | 39369 | 124.86 | 1631 | 1596 | 302.5 |
| C | 0 | 10 | 592330 | 1617.75 | 1595 | 1614 | 365.1 |
| C | 15 | 214 | 549203 | 1499.64 | 1595 | 1614 | 365.1 |
| C | 0 | 207 | 138264 | 374.23 | 1595 | 1614 | 365.1 |
| D | 8 | 230 | 5181648 | 14419.93 | 1478 | 1441 | 359.2 |
| D | 13 | 249 | 484458 | 1344.55 | 1478 | 1441 | 359.2 |
| D | 8 | 195 | 469890 | 1304.0 | 1478 | 1441 | 359.2 |
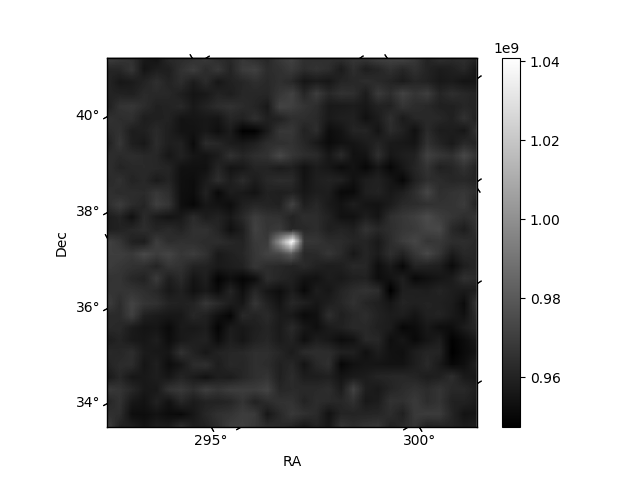
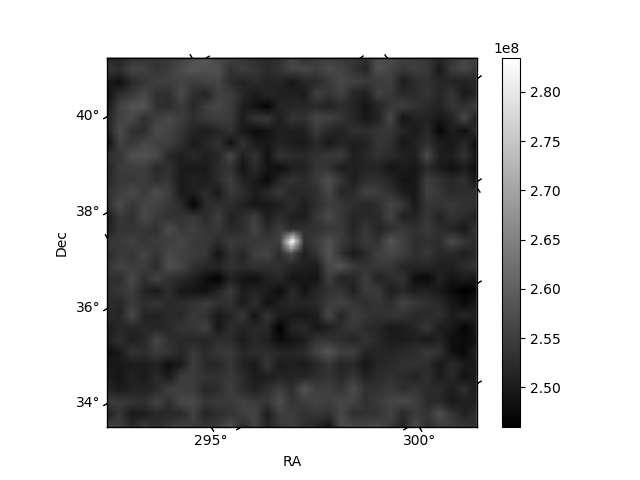
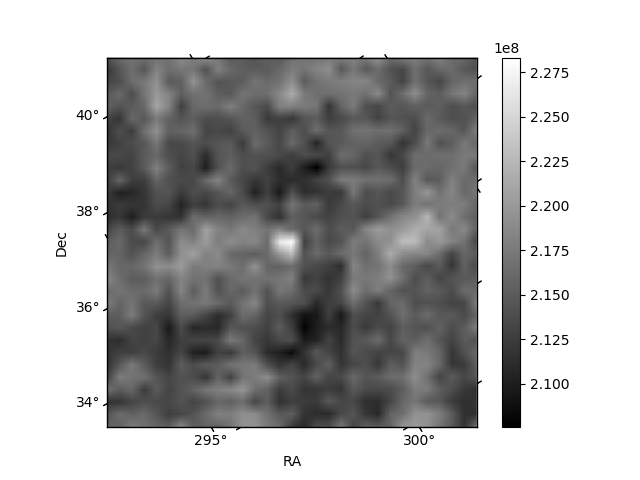
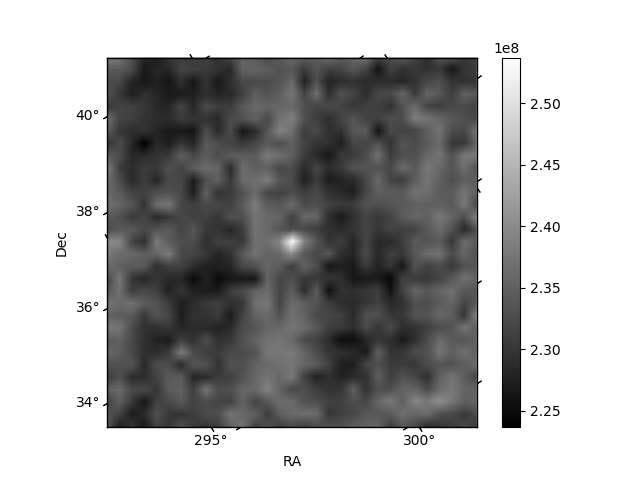
Histogram calculated using DETX and DETY for each event in the final _common_clean file
| Quadrant A | 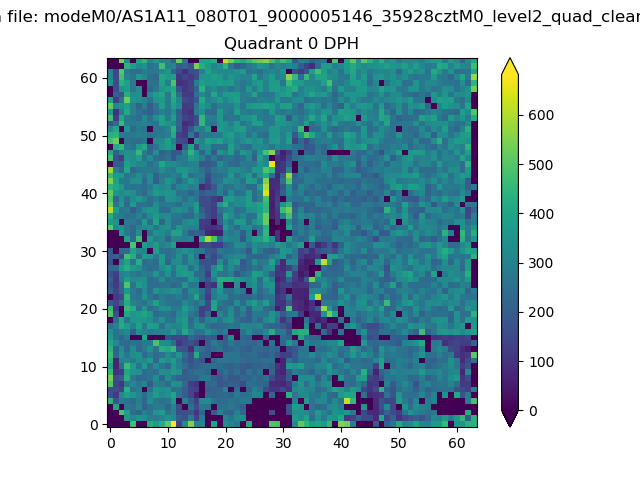 |
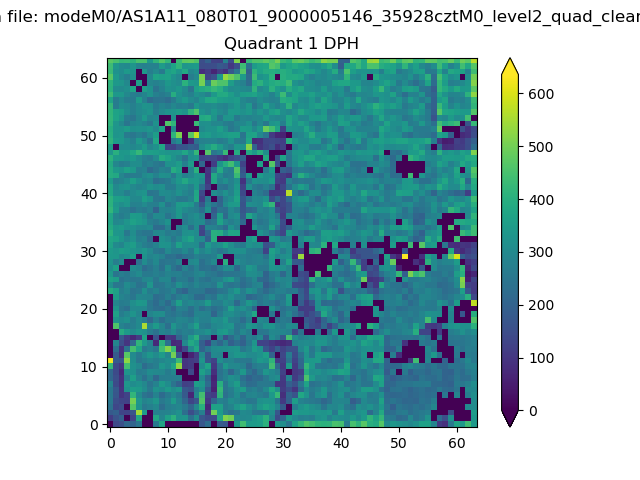 |
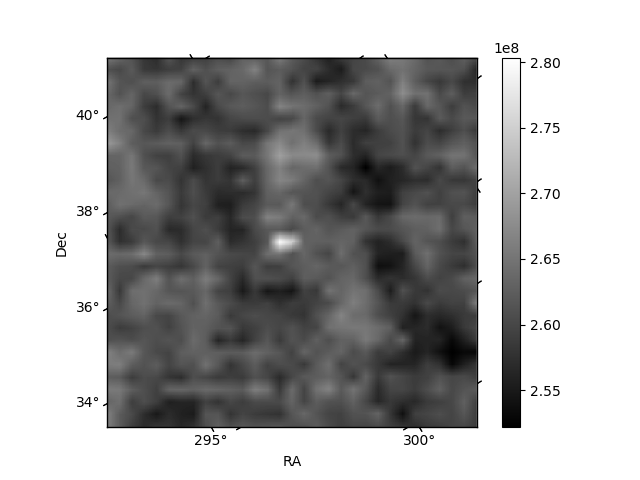
Quadrant B |
|---|---|---|---|
| Quadrant D | 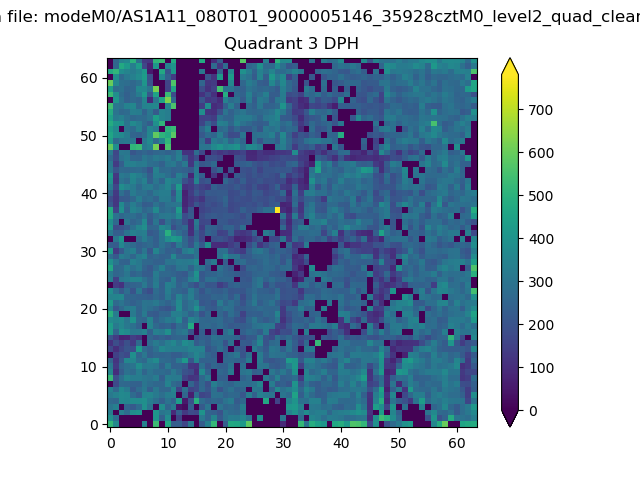 |
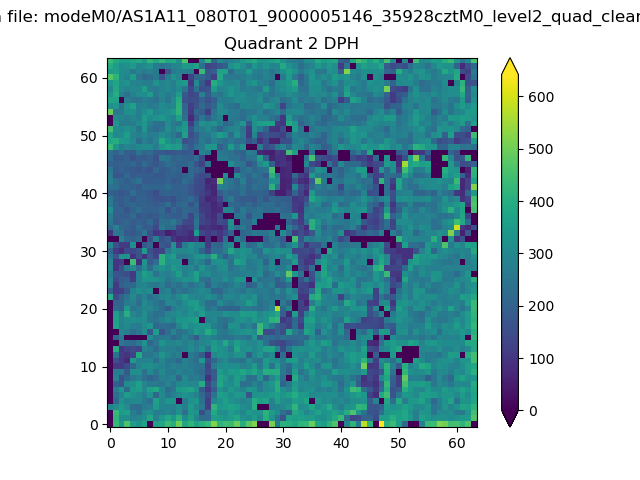 |
Quadrant C |
| Plot type | Count rate plots | Images |
|---|---|---|
| Comparison with Poisson distribution Blue bars denote a histogram of data divided into 1 sec bins. Red curve is a Poisson curve with rate = median count rate of data. |
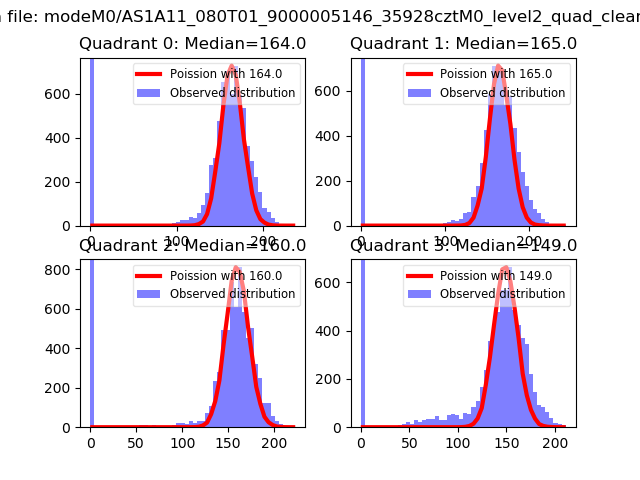 |
 |
| Quadrant-wise count rates Data is divided into 100 sec bins |
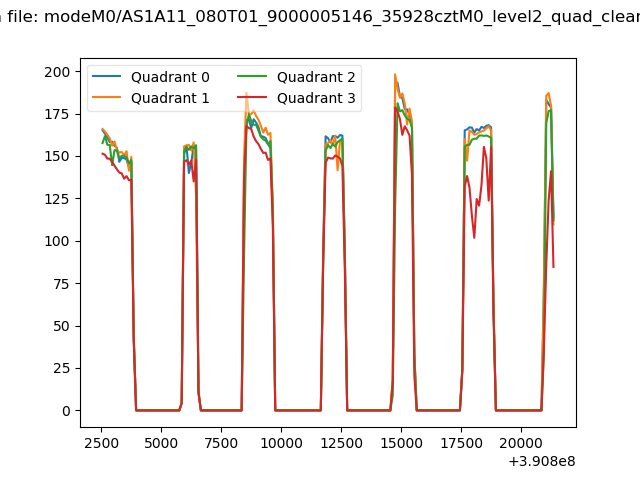 |
|
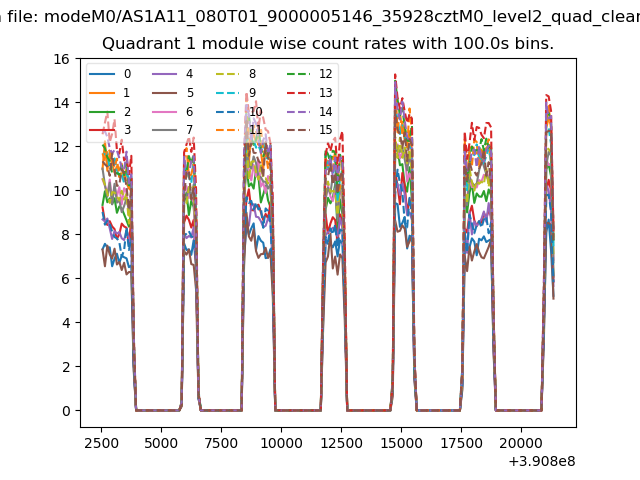
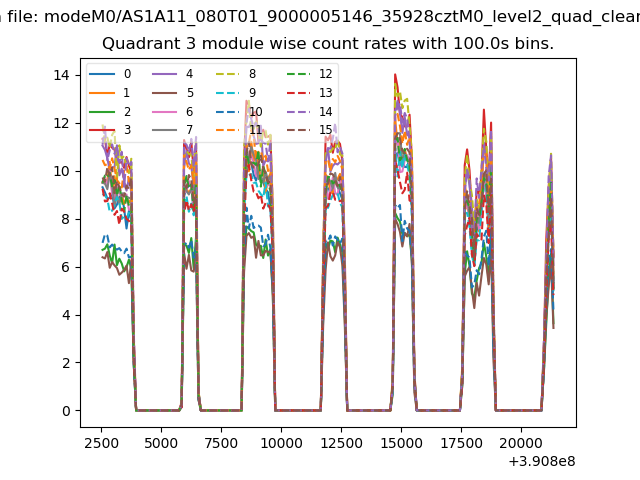
| Module-wise count rates for Quadrant A Data is divided into 100 sec bins |
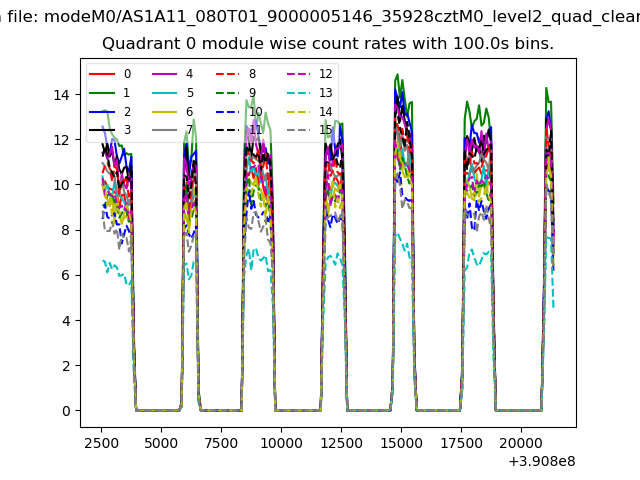 |
 |
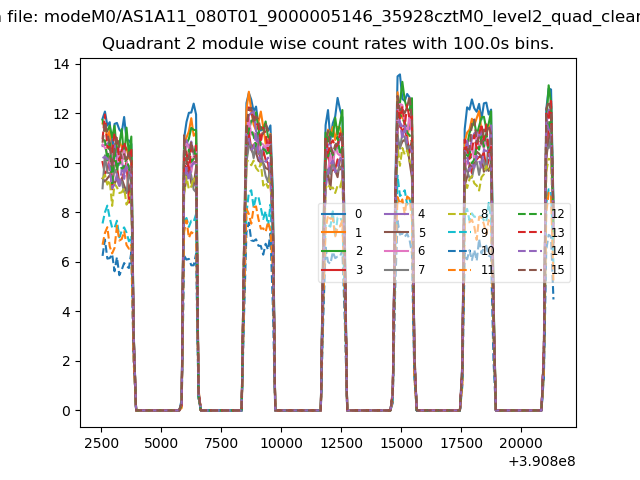
| Module-wise count rates for Quadrant B Data is divided into 100 sec bins |
 |
 |
| Module-wise count rates for Quadrant C Data is divided into 100 sec bins |
 |
 |
| Module-wise count rates for Quadrant D Data is divided into 100 sec bins |
 |
 |
| Parameter | Plot |
|---|---|
| CZT HV Monitor |  |
| D_VDD | 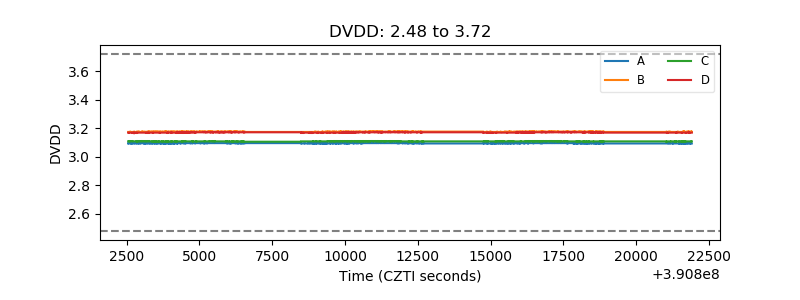 |
| Temperature 1 | 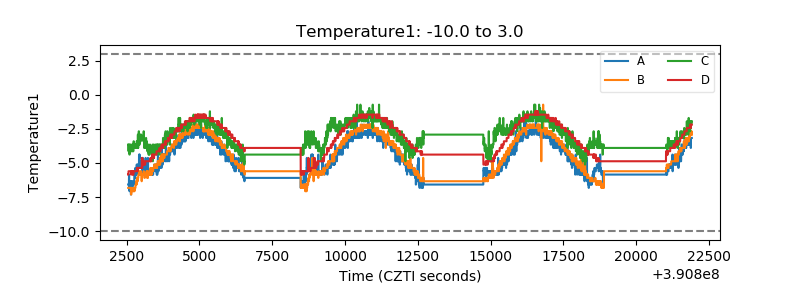 |
| Veto HV Monitor | 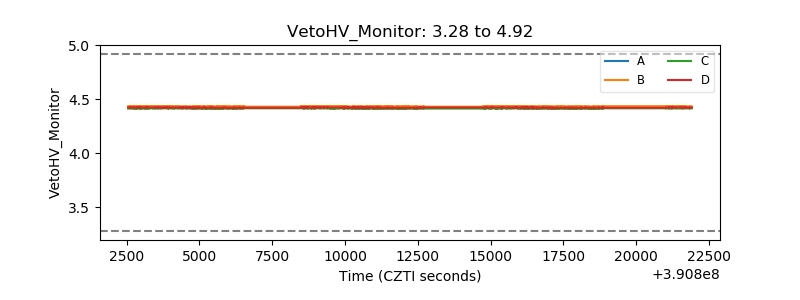 |
| Veto LLD |  |
| Alpha Counter | 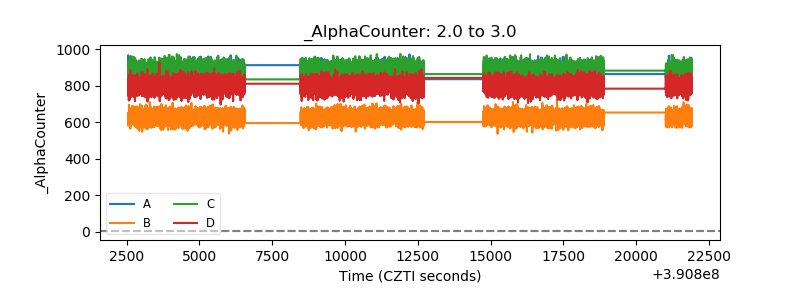 |
| _CPM_Rate | 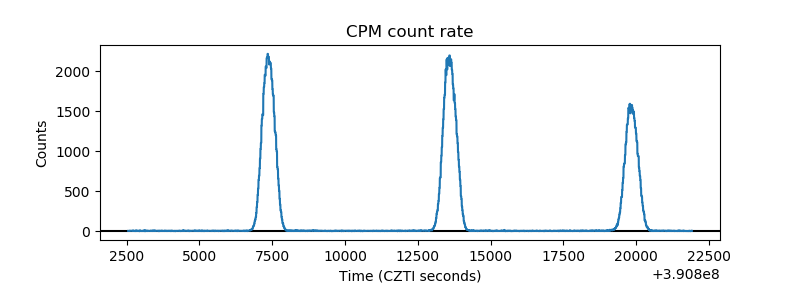 |
| CZT Counter | 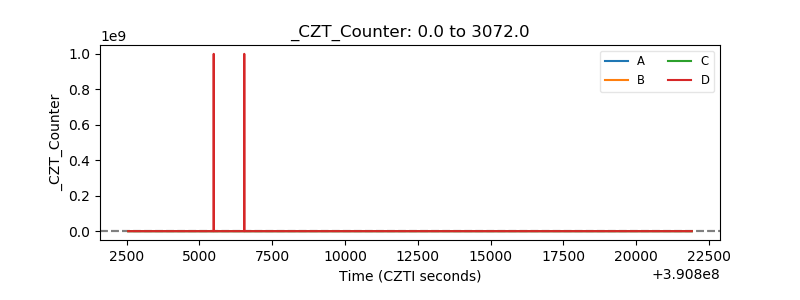 |
| +2.5 Volts monitor |  |
| +5 Volts monitor |  |
| _ROLL_ROT |  |
| _Roll_DEC | 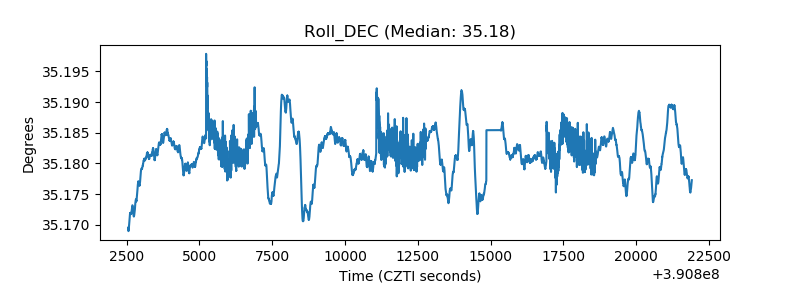 |
| _Roll_RA | 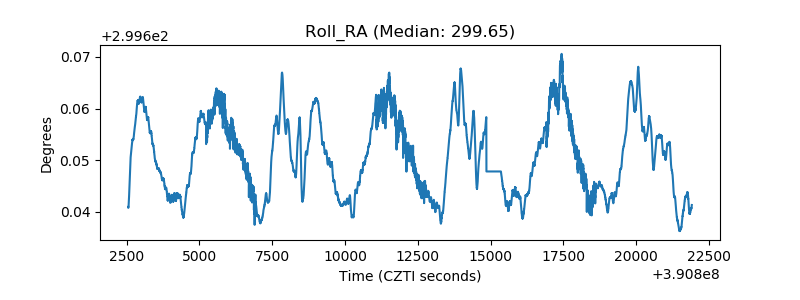 |
| Veto Counter | 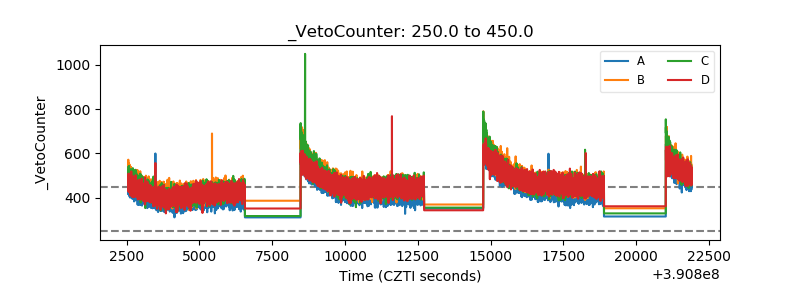 |