| Param | Original file | Final file |
|---|---|---|
| Filename | modeM0/AS1A11_080T01_9000005146_35950cztM0_level2.evt | modeM0/AS1A11_080T01_9000005146_35950cztM0_level2_quad_clean.evt |
| Size (bytes) | 1,385,709,120 | 172,249,920 |
| Size | 1.3 GB | 164.3 MB |
| Events in quadrant A | 5,236,848 | 1,232,814 |
| Events in quadrant B | 22,457,003 | 910,099 |
| Events in quadrant C | 6,456,114 | 1,193,389 |
| Events in quadrant D | 7,093,792 | 1,135,755 |
| Mode M9 | |||
|---|---|---|---|
| Quadrant | BADHDUFLAG | Total packets | Discarded packets |
| A | 0 | 27 | 0 |
| B | 0 | 27 | 0 |
| C | 0 | 27 | 0 |
| D | 0 | 27 | 0 |
| Mode SS | |||
|---|---|---|---|
| Quadrant | BADHDUFLAG | Total packets | Discarded packets |
| A | 0 | 218 | 0 |
| B | 0 | 218 | 0 |
| C | 0 | 218 | 0 |
| D | 0 | 218 | 0 |
| Mode M0 | |||
|---|---|---|---|
| Quadrant | BADHDUFLAG | Total packets | Discarded packets |
| A | 0 | 22221 | 3 |
| B | 0 | 74070 | 2 |
| C | 0 | 25492 | 2 |
| D | 0 | 28235 | 2 |
| Quadrant | Total seconds | Saturated seconds | Saturation percentage |
|---|---|---|---|
| A | 10720 | 13 | 0.121269% |
| B | 10720 | 8171 | 76.222015% |
| C | 10720 | 530 | 4.944030% |
| D | 10720 | 426 | 3.973881% |
Noise dominated data is calculated using 1-second bins in cleaned event files. If a bin has >2000 counts, and if more than 50% of those come from <1% of pixels, then it is considered to be noise-dominated and hence unusable.
| Quadrant | # 1 sec bins | Bins with >0 counts | Bins with >2000 counts | High rate bins dominated by noise | Noise dominated (total time) | Noise dominated (detector-on time) | Marked lightcurve |
|---|---|---|---|---|---|---|---|
| A | 13434 | 10722 | 1 | 1 | 0.01% | 0.01% | 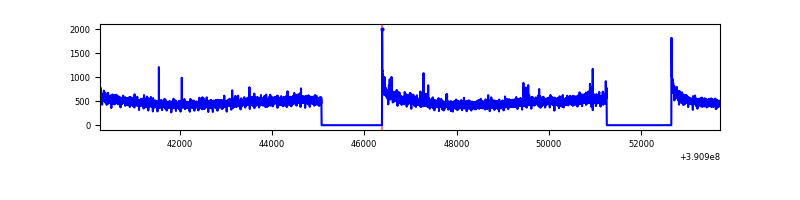 |
| B | 13434 | 10722 | 7405 | 7405 | 55.12% | 69.06% | 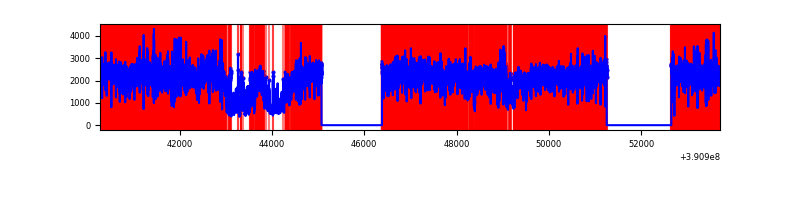 |
| C | 13434 | 10722 | 417 | 417 | 3.10% | 3.89% | 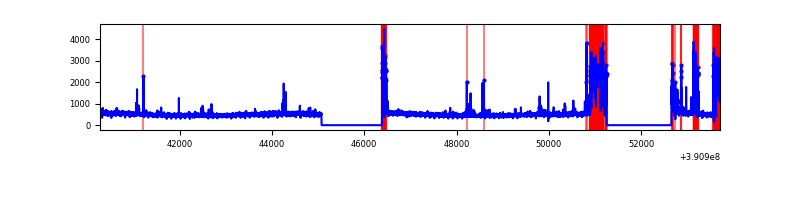 |
| D | 13434 | 10722 | 322 | 322 | 2.40% | 3.00% | 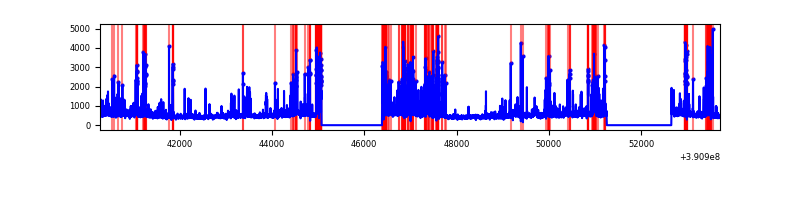 |
Top three noisy pixels from each quadrant. If the there are fewer than three noisy pixels in the level2.evt file, extra rows are filled as -1
| Pixel properties | Quadrant properties | ||||||
|---|---|---|---|---|---|---|---|
| Quadrant | DetID | PixID | Counts | Sigma | Mean | Median | Sigma |
| A | 10 | 83 | 257729 | 987.34 | 1274 | 1252 | 259.8 |
| A | 15 | 169 | 26175 | 95.94 | 1274 | 1252 | 259.8 |
| A | 13 | 6 | 20089 | 72.51 | 1274 | 1252 | 259.8 |
| B | 5 | 14 | 5707618 | 30961.87 | 955 | 937 | 184.3 |
| B | 5 | 31 | 5655099 | 30676.92 | 955 | 937 | 184.3 |
| B | 5 | 15 | 5644638 | 30620.17 | 955 | 937 | 184.3 |
| C | 9 | 187 | 998358 | 3519.67 | 1202 | 1215 | 283.3 |
| C | 15 | 214 | 432614 | 1522.73 | 1202 | 1215 | 283.3 |
| C | 0 | 10 | 203158 | 712.81 | 1202 | 1215 | 283.3 |
| D | 1 | 52 | 579948 | 1949.35 | 1214 | 1187 | 296.9 |
| D | 10 | 118 | 380722 | 1278.33 | 1214 | 1187 | 296.9 |
| D | 12 | 6 | 317227 | 1064.47 | 1214 | 1187 | 296.9 |
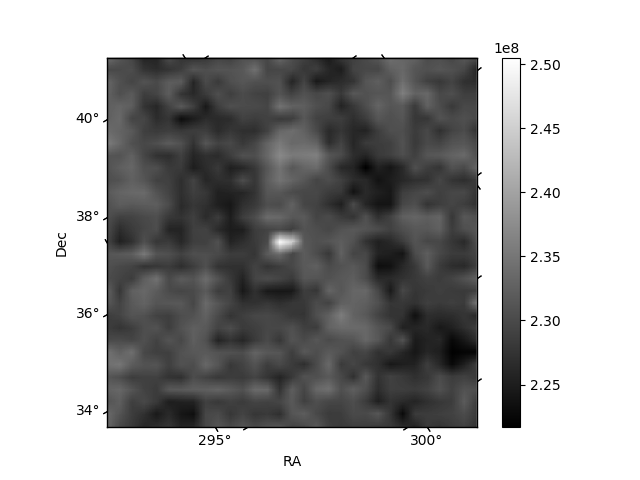
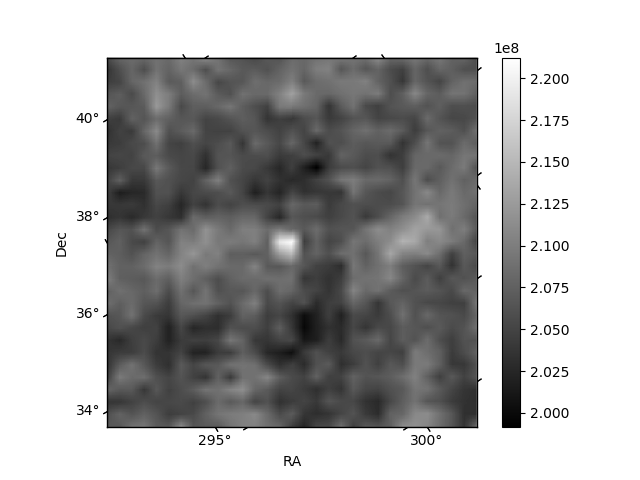
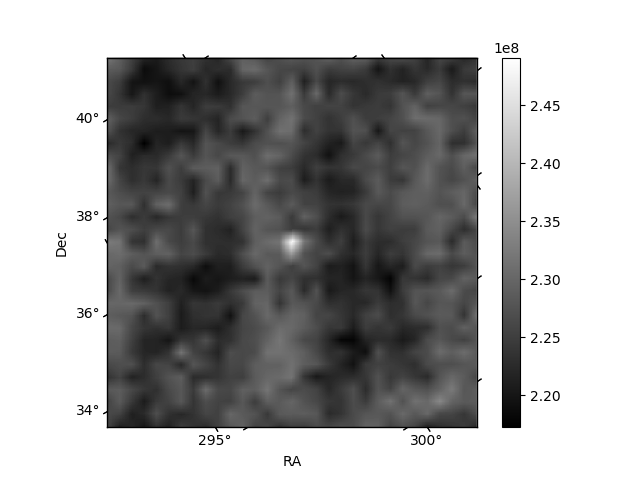
Histogram calculated using DETX and DETY for each event in the final _common_clean file
| Quadrant A | 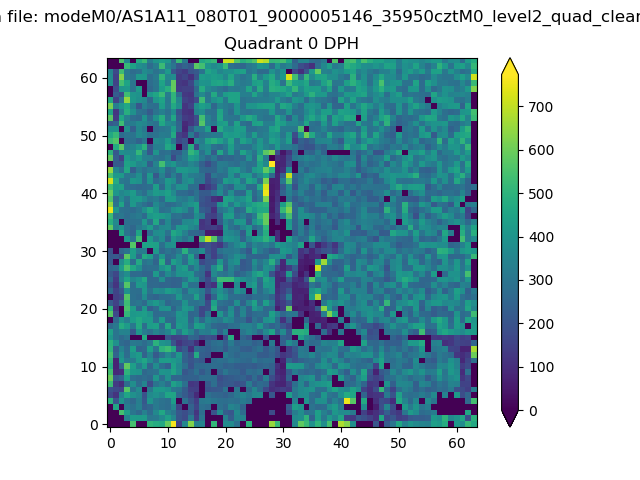 |
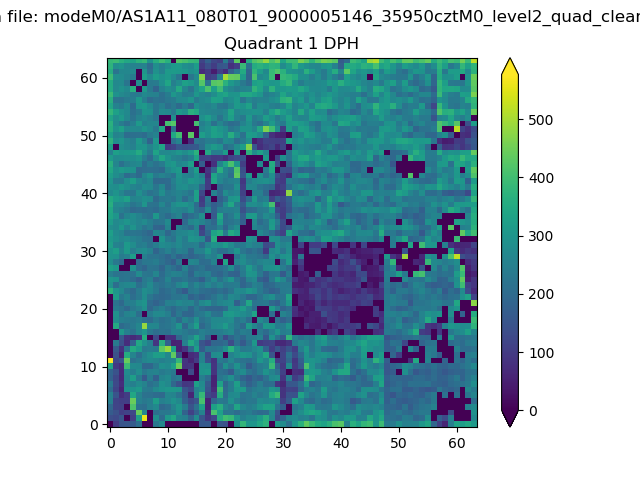 |
Quadrant B |
|---|---|---|---|
| Quadrant D | 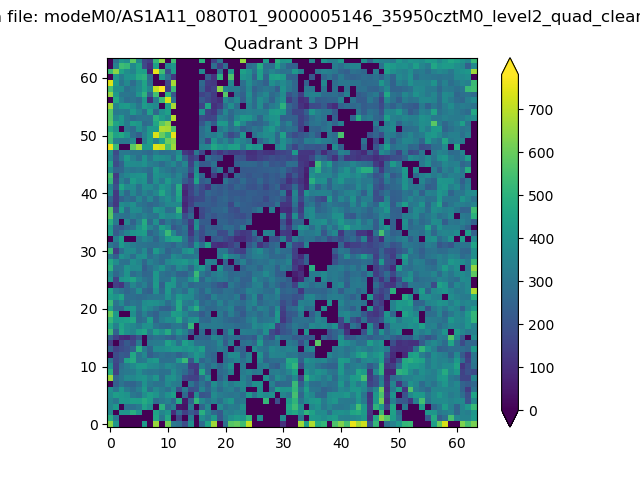 |
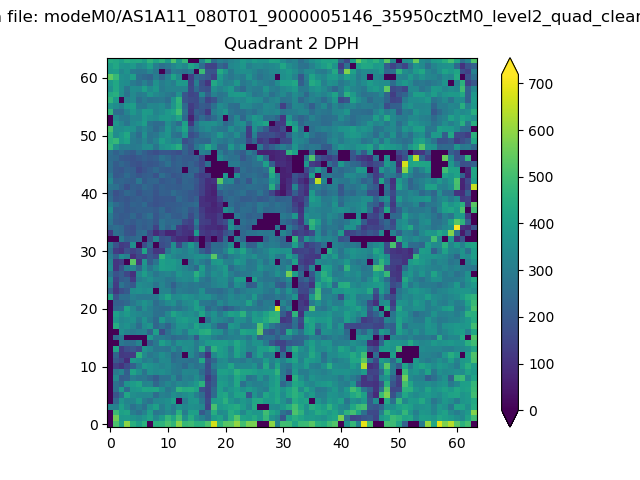 |
Quadrant C |
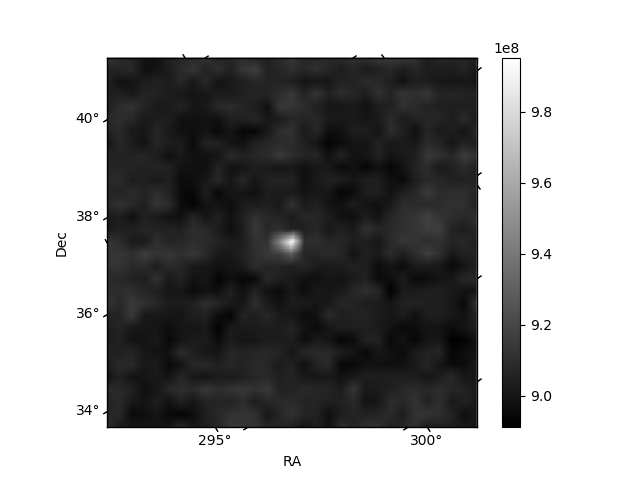
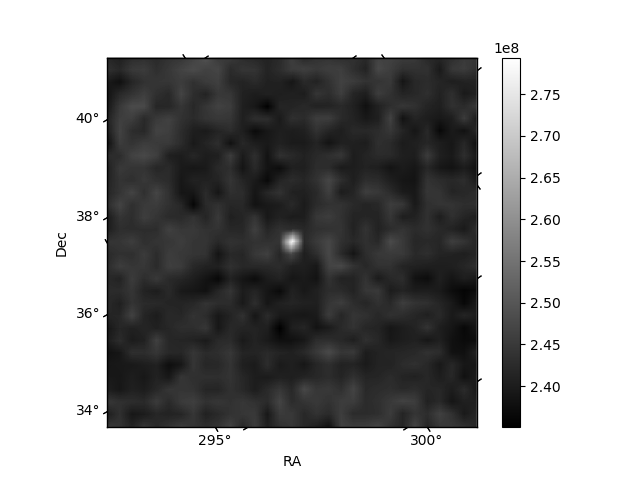
| Plot type | Count rate plots | Images |
|---|---|---|
| Comparison with Poisson distribution Blue bars denote a histogram of data divided into 1 sec bins. Red curve is a Poisson curve with rate = median count rate of data. |
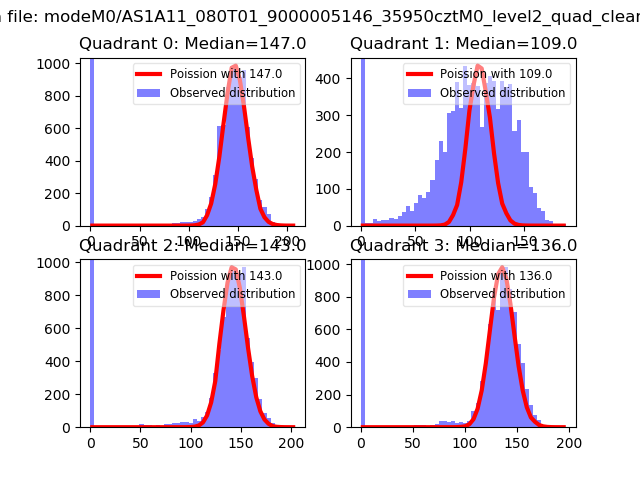 |
 |
| Quadrant-wise count rates Data is divided into 100 sec bins |
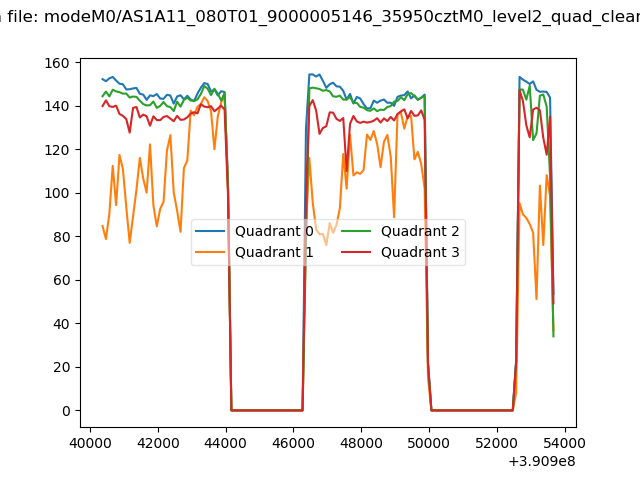 |
|
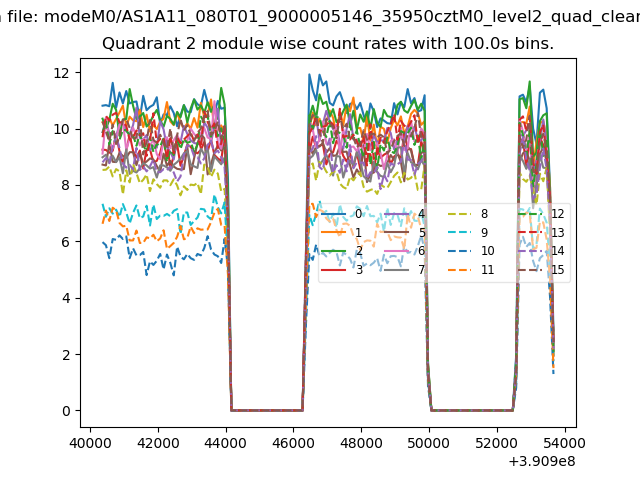
| Module-wise count rates for Quadrant A Data is divided into 100 sec bins |
 |
 |
| Module-wise count rates for Quadrant B Data is divided into 100 sec bins |
 |
 |
| Module-wise count rates for Quadrant C Data is divided into 100 sec bins |
 |
 |
| Module-wise count rates for Quadrant D Data is divided into 100 sec bins |
 |
 |
| Parameter | Plot |
|---|---|
| CZT HV Monitor |  |
| D_VDD | 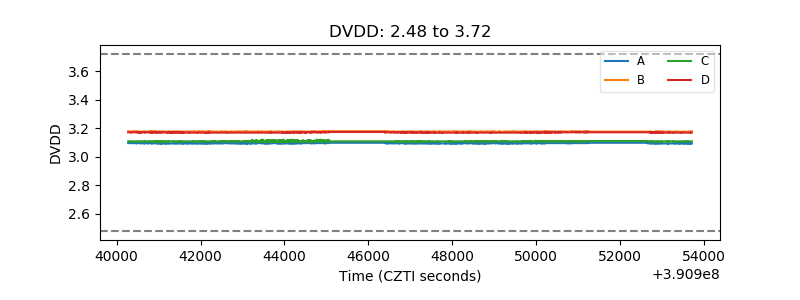 |
| Temperature 1 |  |
| Veto HV Monitor | 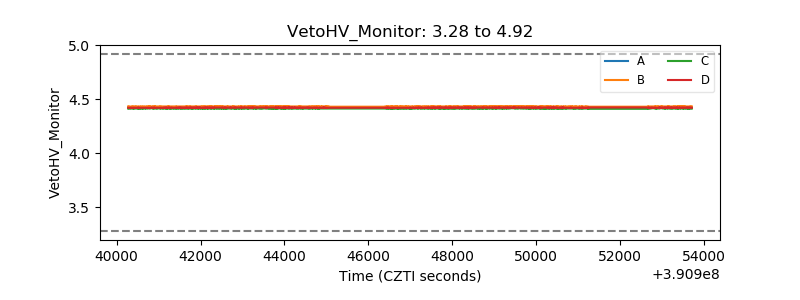 |
| Veto LLD |  |
| Alpha Counter | 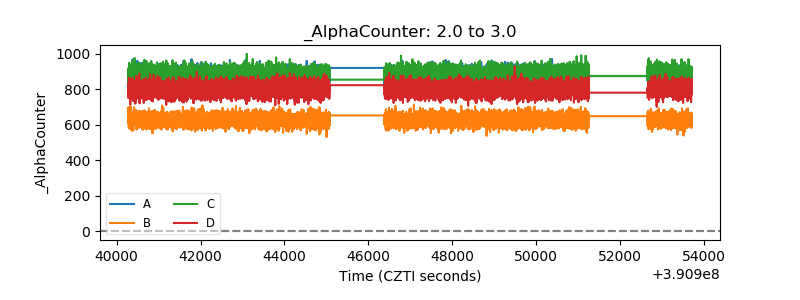 |
| _CPM_Rate | 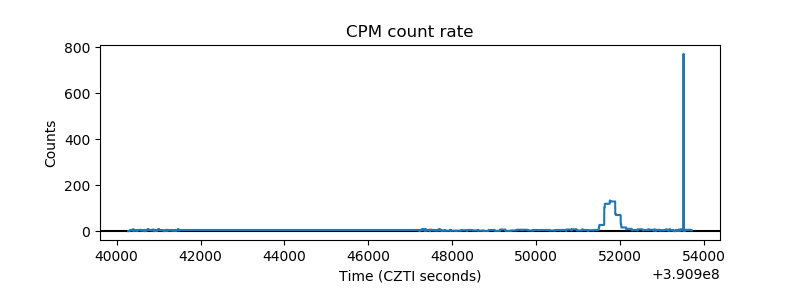 |
| CZT Counter | 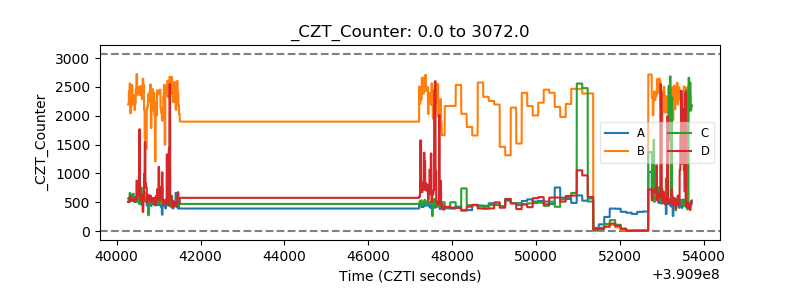 |
| +2.5 Volts monitor |  |
| +5 Volts monitor | 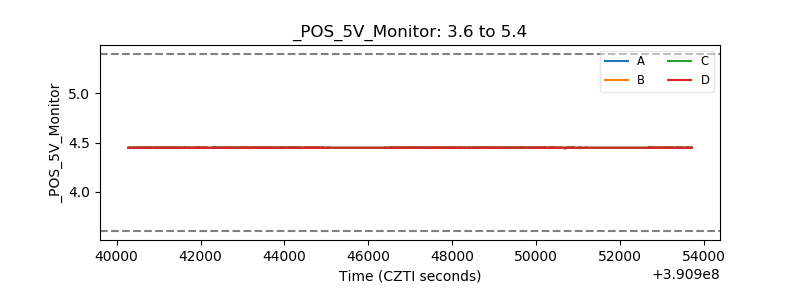 |
| _ROLL_ROT | 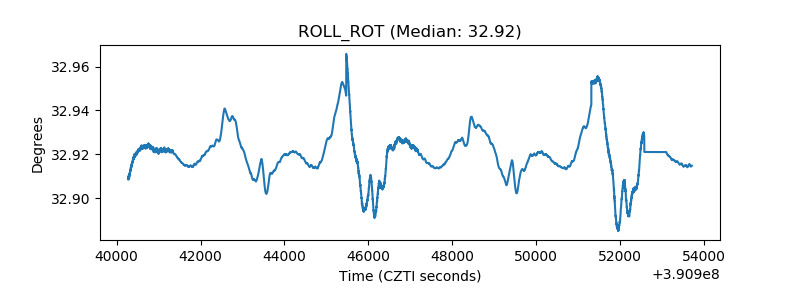 |
| _Roll_DEC | 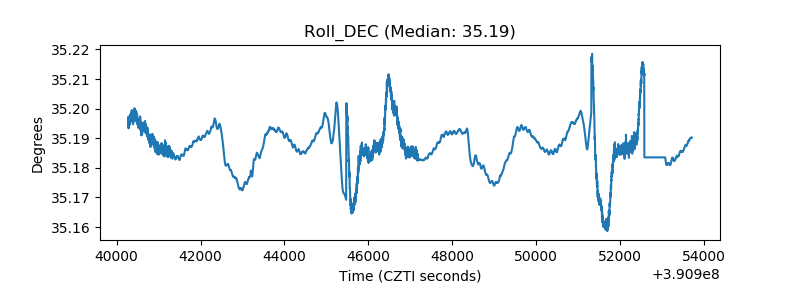 |
| _Roll_RA | 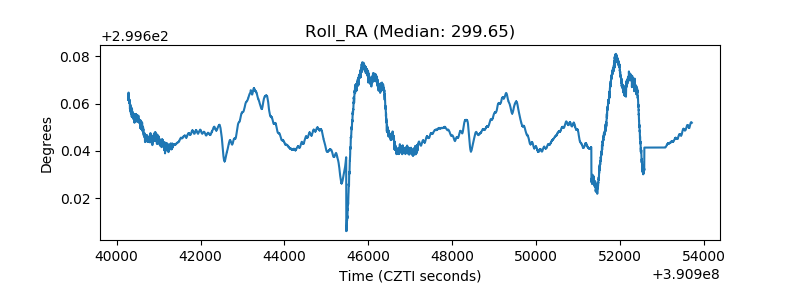 |
| Veto Counter |  |