| Param | Original file | Final file |
|---|---|---|
| Filename | modeM0/AS1T05_009T09_9000005148_35966cztM0_level2.evt | modeM0/AS1T05_009T09_9000005148_35966cztM0_level2_quad_clean.evt |
| Size (bytes) | 614,211,840 | 63,123,840 |
| Size | 585.8 MB | 60.2 MB |
| Events in quadrant A | 1,942,989 | 490,380 |
| Events in quadrant B | 11,059,519 | 158,043 |
| Events in quadrant C | 2,650,013 | 496,324 |
| Events in quadrant D | 2,662,523 | 467,406 |
| Mode M0 | |||
|---|---|---|---|
| Quadrant | BADHDUFLAG | Total packets | Discarded packets |
| A | 0 | 8662 | 2 |
| B | 0 | 35780 | 1 |
| C | 0 | 10572 | 1 |
| D | 0 | 10869 | 1 |
| Mode SS | |||
|---|---|---|---|
| Quadrant | BADHDUFLAG | Total packets | Discarded packets |
| A | 0 | 86 | 0 |
| B | 0 | 86 | 0 |
| C | 0 | 86 | 0 |
| D | 0 | 86 | 0 |
| Mode M9 | |||
|---|---|---|---|
| Quadrant | BADHDUFLAG | Total packets | Discarded packets |
| A | 0 | 16 | 0 |
| B | 0 | 16 | 0 |
| C | 0 | 16 | 0 |
| D | 0 | 16 | 0 |
| Quadrant | Total seconds | Saturated seconds | Saturation percentage |
|---|---|---|---|
| A | 4221 | 8 | 0.189529% |
| B | 4221 | 4221 | 100.000000% |
| C | 4221 | 92 | 2.179578% |
| D | 4221 | 172 | 4.074864% |
Noise dominated data is calculated using 1-second bins in cleaned event files. If a bin has >2000 counts, and if more than 50% of those come from <1% of pixels, then it is considered to be noise-dominated and hence unusable.
| Quadrant | # 1 sec bins | Bins with >0 counts | Bins with >2000 counts | High rate bins dominated by noise | Noise dominated (total time) | Noise dominated (detector-on time) | Marked lightcurve |
|---|---|---|---|---|---|---|---|
| A | 5804 | 4222 | 0 | 0 | 0.00% | 0.00% | 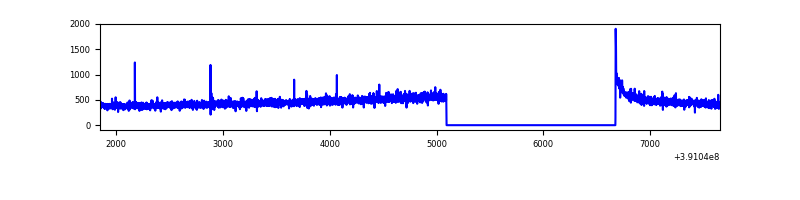 |
| B | 5803 | 4220 | 4168 | 4168 | 71.82% | 98.77% | 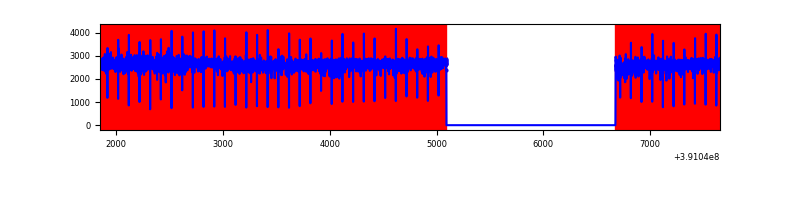 |
| C | 5804 | 4222 | 83 | 83 | 1.43% | 1.97% | 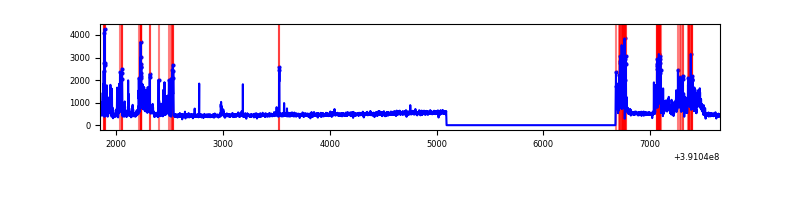 |
| D | 5804 | 4222 | 137 | 137 | 2.36% | 3.24% | 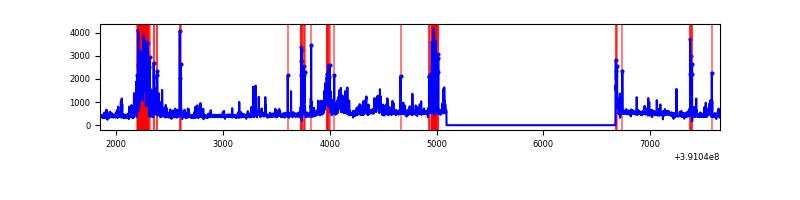 |
Top three noisy pixels from each quadrant. If the there are fewer than three noisy pixels in the level2.evt file, extra rows are filled as -1
| Pixel properties | Quadrant properties | ||||||
|---|---|---|---|---|---|---|---|
| Quadrant | DetID | PixID | Counts | Sigma | Mean | Median | Sigma |
| A | 10 | 83 | 103916 | 1083.9 | 468 | 458 | 95.4 |
| A | 15 | 169 | 12067 | 121.62 | 468 | 458 | 95.4 |
| A | 8 | 144 | 10306 | 103.17 | 468 | 458 | 95.4 |
| B | 5 | 31 | 3987185 | 116651.53 | 171 | 167 | 34.2 |
| B | 5 | 15 | 3828340 | 112004.07 | 171 | 167 | 34.2 |
| B | 5 | 14 | 2171401 | 63525.62 | 171 | 167 | 34.2 |
| C | 9 | 187 | 593898 | 5599.7 | 453 | 457 | 106.0 |
| C | 15 | 214 | 174179 | 1639.24 | 453 | 457 | 106.0 |
| C | 0 | 10 | 103490 | 972.22 | 453 | 457 | 106.0 |
| D | 2 | 250 | 327939 | 2987.96 | 448 | 435 | 109.6 |
| D | 10 | 118 | 140956 | 1282.03 | 448 | 435 | 109.6 |
| D | 12 | 227 | 104546 | 949.85 | 448 | 435 | 109.6 |
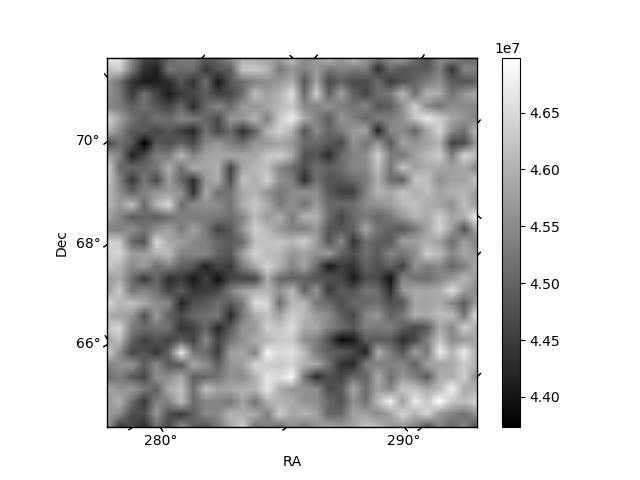
Histogram calculated using DETX and DETY for each event in the final _common_clean file
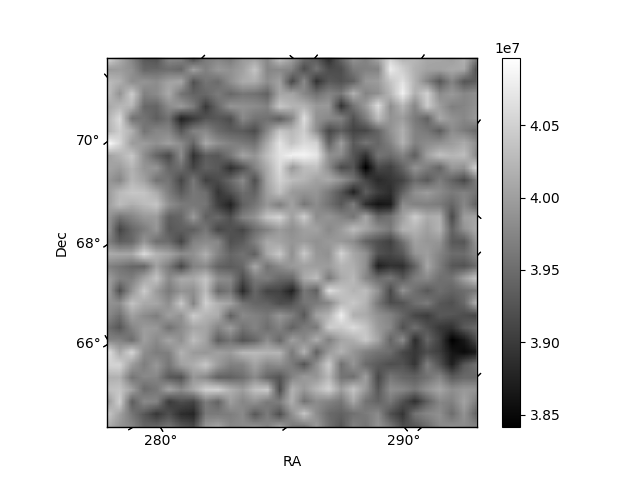
| Quadrant A | 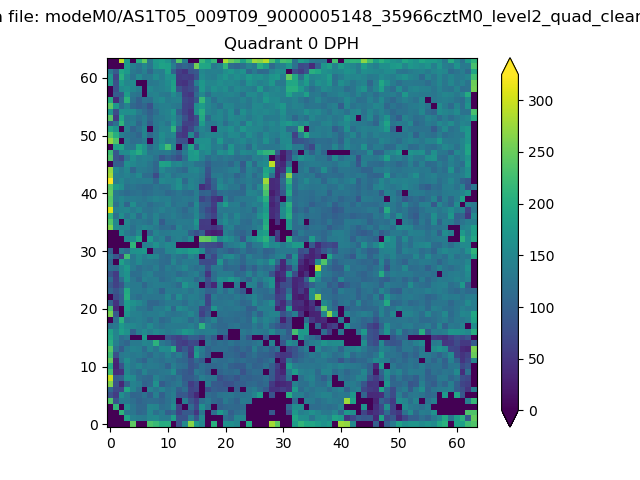 |
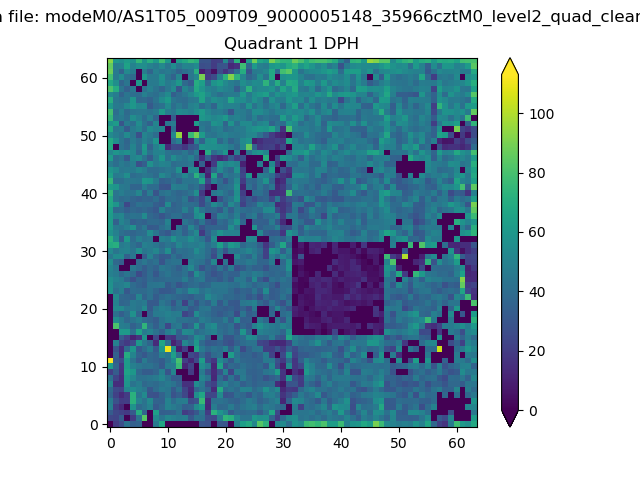 |
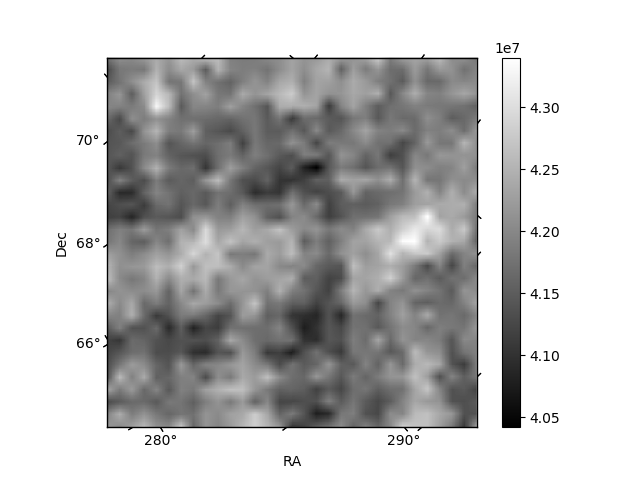
Quadrant B |
|---|---|---|---|
| Quadrant D | 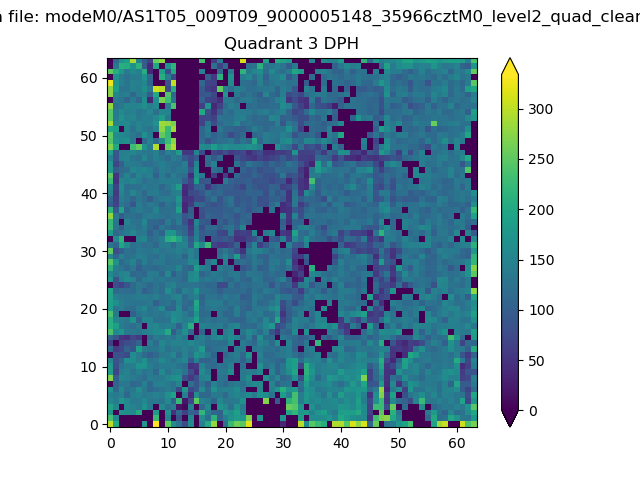 |
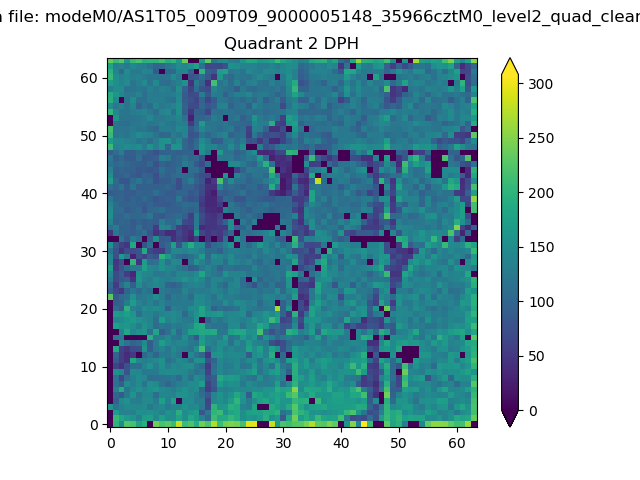 |
Quadrant C |
| Plot type | Count rate plots | Images |
|---|---|---|
| Comparison with Poisson distribution Blue bars denote a histogram of data divided into 1 sec bins. Red curve is a Poisson curve with rate = median count rate of data. |
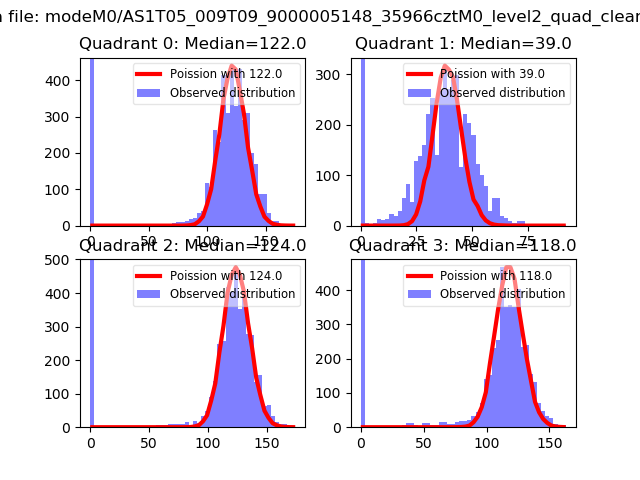 |
 |
| Quadrant-wise count rates Data is divided into 100 sec bins |
 |
|
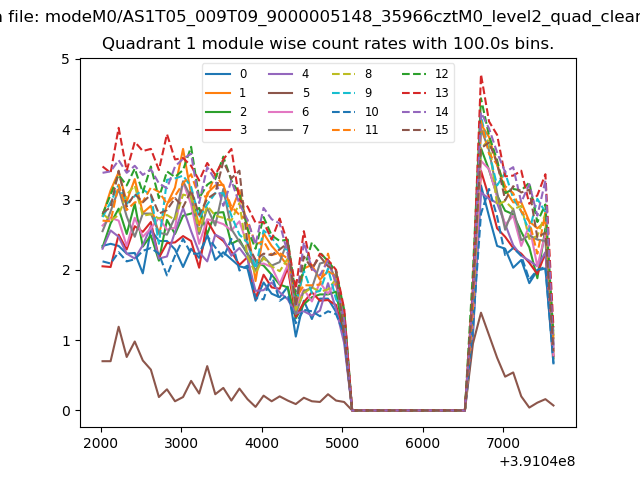
| Module-wise count rates for Quadrant A Data is divided into 100 sec bins |
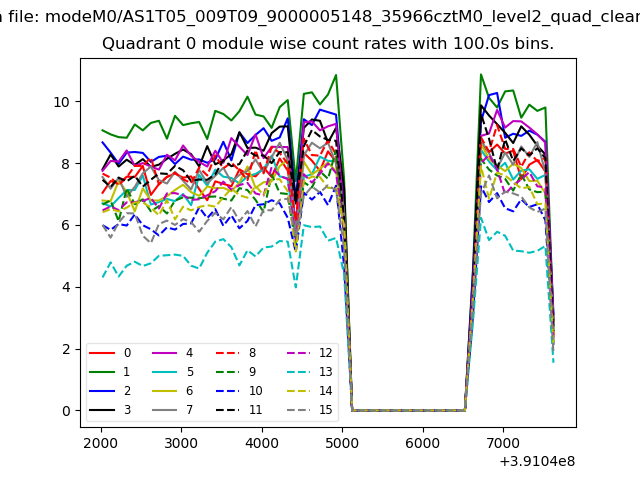 |
 |
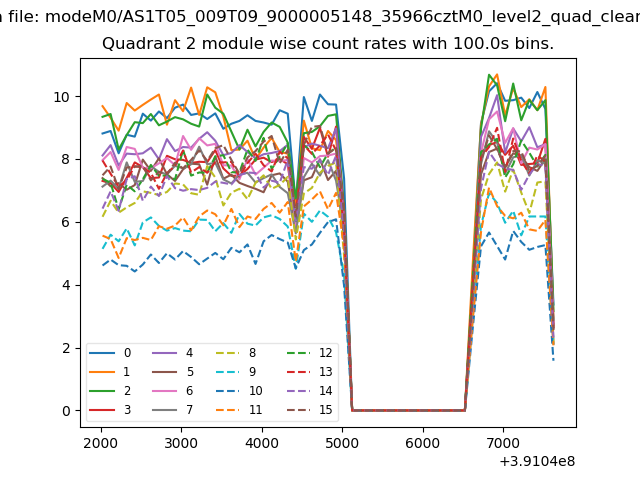
| Module-wise count rates for Quadrant B Data is divided into 100 sec bins |
 |
 |
| Module-wise count rates for Quadrant C Data is divided into 100 sec bins |
 |
 |
| Module-wise count rates for Quadrant D Data is divided into 100 sec bins |
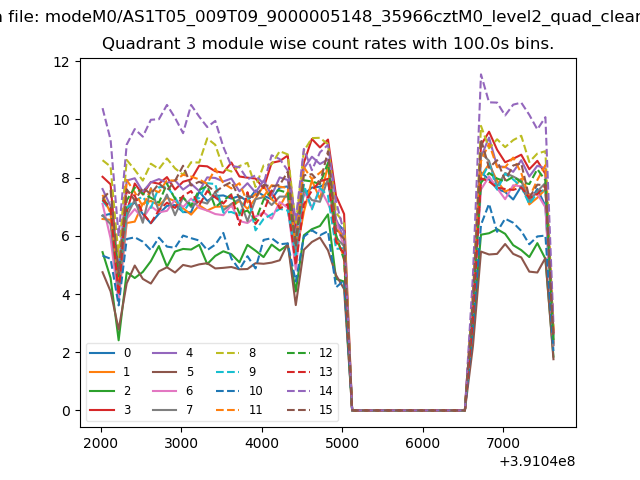 |
 |
| Parameter | Plot |
|---|---|
| CZT HV Monitor | 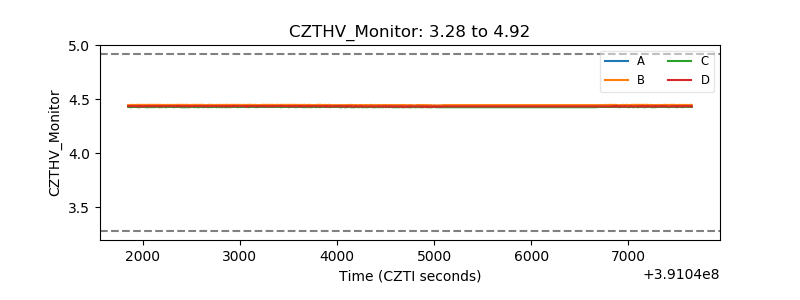 |
| D_VDD | 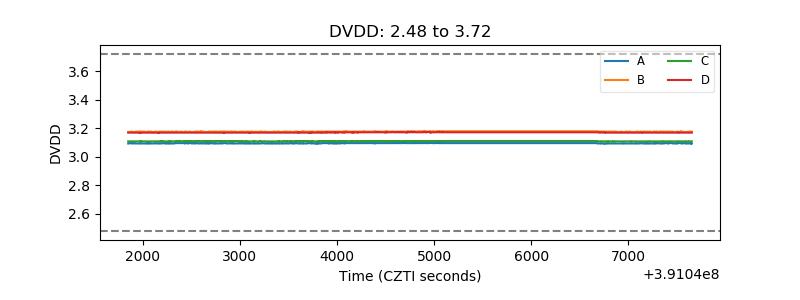 |
| Temperature 1 | 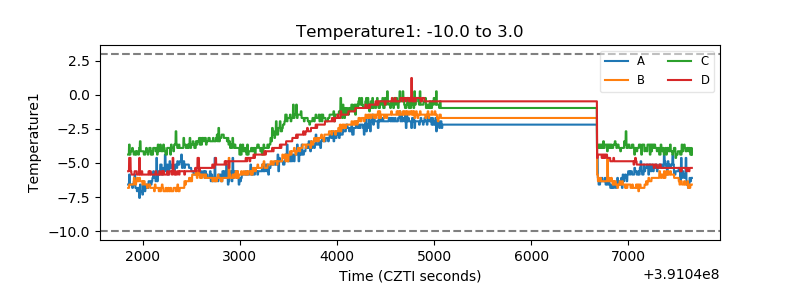 |
| Veto HV Monitor | 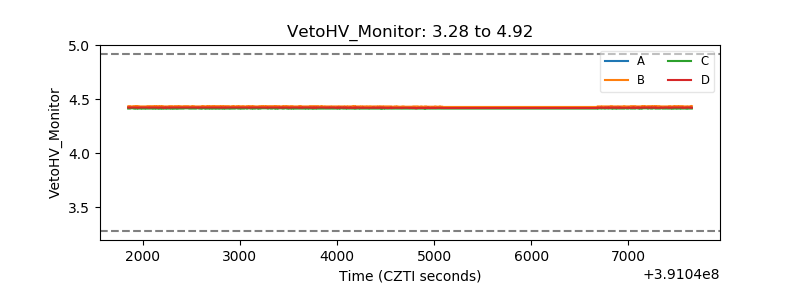 |
| Veto LLD |  |
| Alpha Counter | 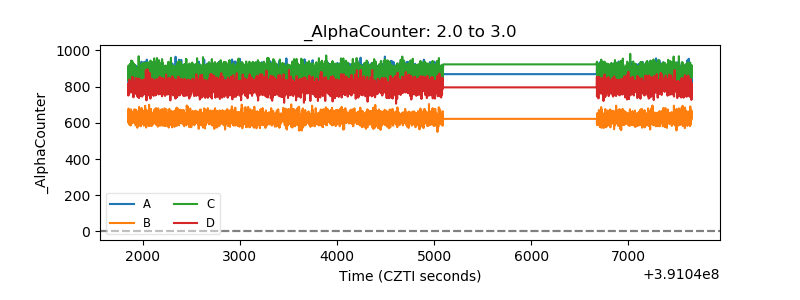 |
| _CPM_Rate | 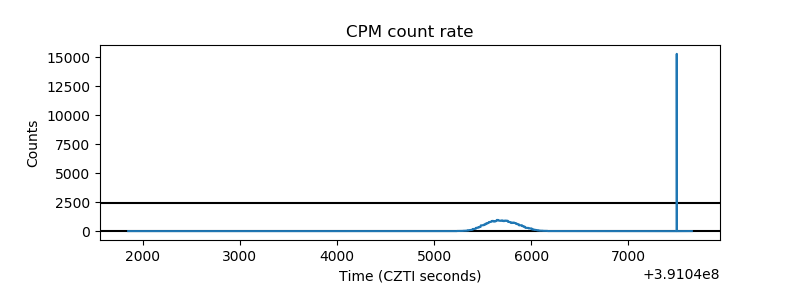 |
| CZT Counter | 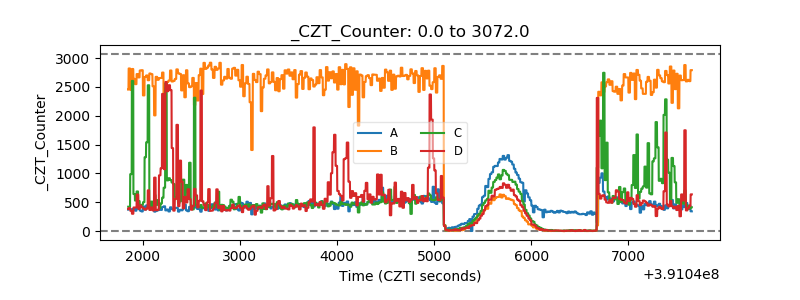 |
| +2.5 Volts monitor |  |
| +5 Volts monitor |  |
| _ROLL_ROT | 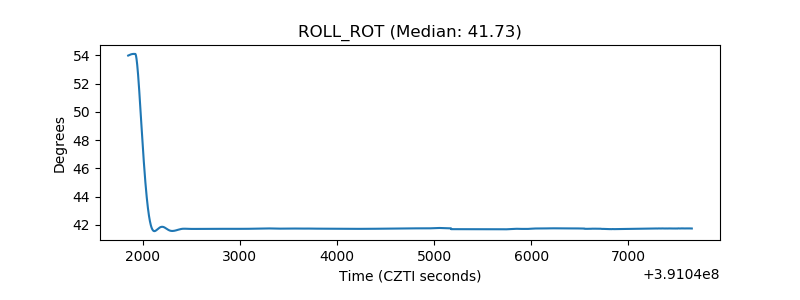 |
| _Roll_DEC | 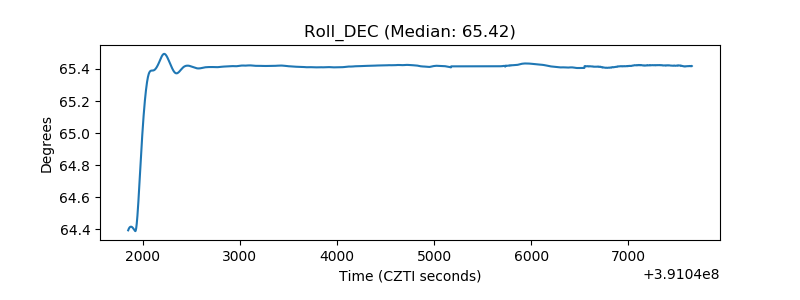 |
| _Roll_RA | 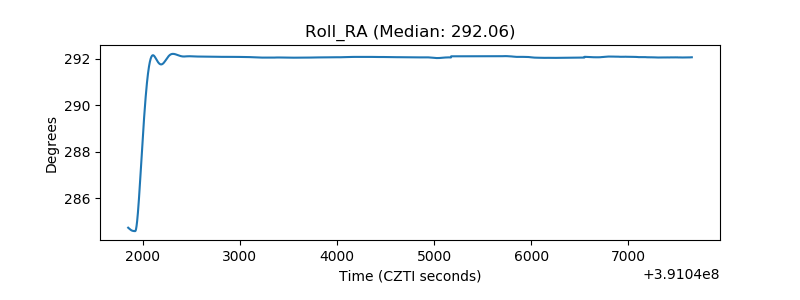 |
| Veto Counter | 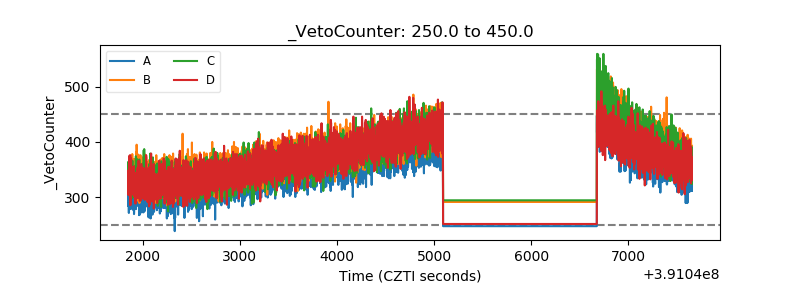 |