| Param | Original file | Final file |
|---|---|---|
| Filename | modeM0/AS1A11_050T19_9000005156cztM0_level2.fits | modeM0/AS1A11_050T19_9000005156cztM0_level2_quad_clean.evt |
| Size (bytes) | 86,860,800 | 125,441,280 |
| Size | 82.8 MB | 119.6 MB |
| Events in quadrant A | 538,828 | 856,966 |
| Events in quadrant B | 508,470 | 842,438 |
| Events in quadrant C | 495,168 | 749,788 |
| Events in quadrant D | 437,630 | 699,522 |
| Mode M0 | |||
|---|---|---|---|
| Quadrant | BADHDUFLAG | Total packets | Discarded packets |
| A | 0 | 19238 | 0 |
| B | 0 | 20269 | 0 |
| C | 0 | 29015 | 0 |
| D | 0 | 29865 | 0 |
| Mode SS | |||
|---|---|---|---|
| Quadrant | BADHDUFLAG | Total packets | Discarded packets |
| A | 0 | 192 | 0 |
| B | 0 | 192 | 0 |
| C | 0 | 192 | 0 |
| D | 0 | 190 | 0 |
| Mode M9 | |||
|---|---|---|---|
| Quadrant | BADHDUFLAG | Total packets | Discarded packets |
| A | 0 | 23 | 0 |
| B | 0 | 23 | 0 |
| C | 0 | 23 | 0 |
| D | 0 | 25 | 0 |
| Quadrant | Total seconds | Saturated seconds | Saturation percentage |
|---|---|---|---|
| A | 9364 | 13 | 0.138830% |
| B | 9376 | 43 | 0.458618% |
| C | 9364 | 860 | 9.184109% |
| D | 9364 | 723 | 7.721059% |
Noise dominated data is calculated using 1-second bins in cleaned event files. If a bin has >2000 counts, and if more than 50% of those come from <1% of pixels, then it is considered to be noise-dominated and hence unusable.
| Quadrant | # 1 sec bins | Bins with >0 counts | Bins with >2000 counts | High rate bins dominated by noise | Noise dominated (total time) | Noise dominated (detector-on time) | Marked lightcurve |
|---|---|---|---|---|---|---|---|
| A | 66254 | 9402 | 0 | 0 | 0.00% | 0.00% |  |
| B | 66254 | 9400 | 0 | 0 | 0.00% | 0.00% | 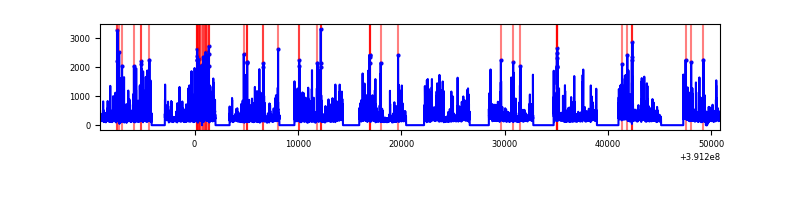 |
| C | 66254 | 9321 | 0 | 0 | 0.00% | 0.00% |  |
| D | 66254 | 9378 | 0 | 0 | 0.00% | 0.00% |  |
Top three noisy pixels from each quadrant. If the there are fewer than three noisy pixels in the level2.evt file, extra rows are filled as -1
| Pixel properties | Quadrant properties | ||||||
|---|---|---|---|---|---|---|---|
| Quadrant | DetID | PixID | Counts | Sigma | Mean | Median | Sigma |
| A | 7 | 110 | 456 | 8.99 | 140 | 132 | 36.1 |
| A | 9 | 19 | 437 | 8.46 | 140 | 132 | 36.1 |
| A | 0 | 29 | 423 | 8.07 | 140 | 132 | 36.1 |
| B | 2 | 9 | 401 | 9.64 | 134 | 129 | 28.2 |
| B | 3 | 80 | 372 | 8.61 | 134 | 129 | 28.2 |
| B | 2 | 8 | 351 | 7.87 | 134 | 129 | 28.2 |
| C | 1 | 81 | 423 | 8.47 | 131 | 123 | 35.4 |
| C | 1 | 80 | 419 | 8.36 | 131 | 123 | 35.4 |
| C | 3 | 203 | 395 | 7.68 | 131 | 123 | 35.4 |
| D | 10 | 189 | 350 | 6.78 | 125 | 115 | 34.7 |
| D | 6 | 67 | 322 | 5.97 | 125 | 115 | 34.7 |
| D | 4 | 160 | 320 | 5.91 | 125 | 115 | 34.7 |
Histogram calculated using DETX and DETY for each event in the final _common_clean file
| Quadrant A |  |
 |
Quadrant B |
|---|---|---|---|
| Quadrant D | 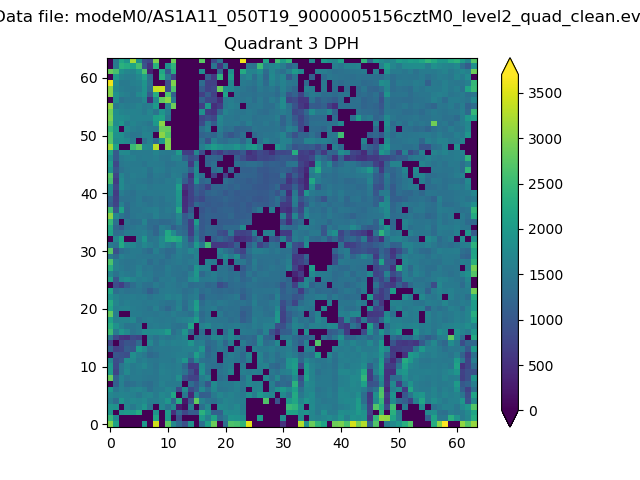 |
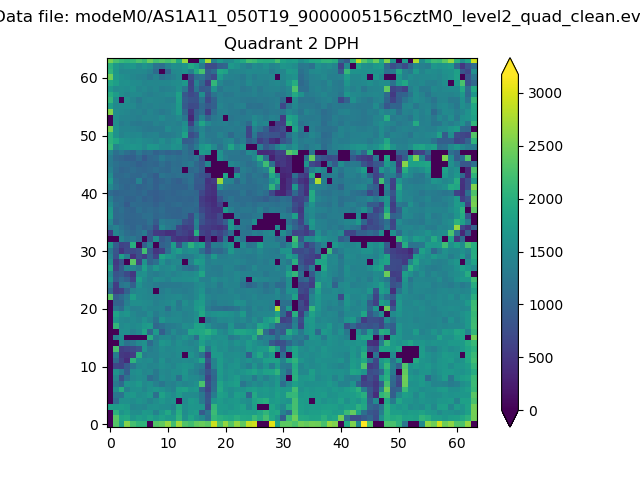 |
Quadrant C |
| Plot type | Count rate plots | Images |
|---|---|---|
| Comparison with Poisson distribution Blue bars denote a histogram of data divided into 1 sec bins. Red curve is a Poisson curve with rate = median count rate of data. |
 |
 |
| Quadrant-wise count rates Data is divided into 100 sec bins |
 |
|
| Module-wise count rates for Quadrant A Data is divided into 100 sec bins |
 |
 |
| Module-wise count rates for Quadrant B Data is divided into 100 sec bins |
 |
 |
| Module-wise count rates for Quadrant C Data is divided into 100 sec bins |
 |
 |
| Module-wise count rates for Quadrant D Data is divided into 100 sec bins |
 |
 |
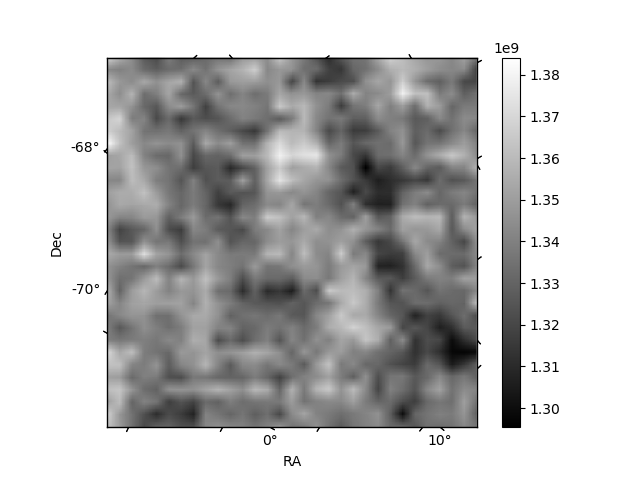
| Parameter | Plot |
|---|---|
| CZT HV Monitor |  |
| D_VDD |  |
| Temperature 1 |  |
| Veto HV Monitor | 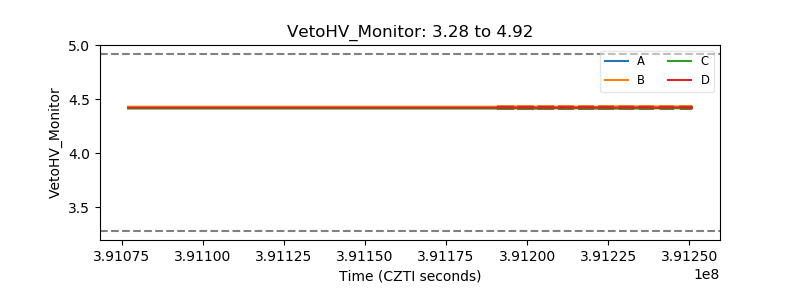 |
| Veto LLD | 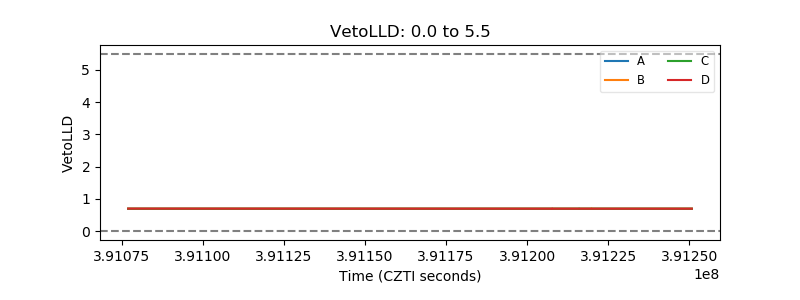 |
| Alpha Counter |  |
| _CPM_Rate |  |
| CZT Counter |  |
| +2.5 Volts monitor |  |
| +5 Volts monitor |  |
| _ROLL_ROT |  |
| _Roll_DEC |  |
| _Roll_RA |  |
| Veto Counter | 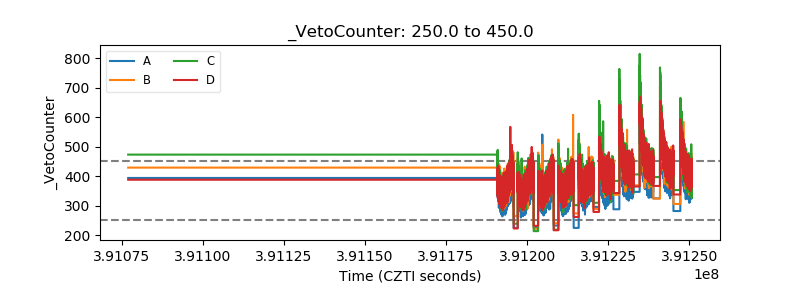 |