| Param | Original file | Final file |
|---|---|---|
| Filename | modeM0/AS1T05_009T07_9000005152_35972cztM0_level2.evt | modeM0/AS1T05_009T07_9000005152_35972cztM0_level2_quad_clean.evt |
| Size (bytes) | 590,587,200 | 63,538,560 |
| Size | 563.2 MB | 60.6 MB |
| Events in quadrant A | 1,901,215 | 514,053 |
| Events in quadrant B | 10,145,360 | 180,492 |
| Events in quadrant C | 2,363,288 | 493,977 |
| Events in quadrant D | 3,212,707 | 459,270 |
| Mode SS | |||
|---|---|---|---|
| Quadrant | BADHDUFLAG | Total packets | Discarded packets |
| A | 0 | 78 | 0 |
| B | 0 | 78 | 0 |
| C | 0 | 78 | 0 |
| D | 0 | 78 | 0 |
| Mode M0 | |||
|---|---|---|---|
| Quadrant | BADHDUFLAG | Total packets | Discarded packets |
| A | 0 | 7842 | 0 |
| B | 0 | 32807 | 0 |
| C | 0 | 9308 | 0 |
| D | 0 | 12195 | 0 |
| Quadrant | Total seconds | Saturated seconds | Saturation percentage |
|---|---|---|---|
| A | 3883 | 3 | 0.077260% |
| B | 3883 | 3880 | 99.922740% |
| C | 3883 | 78 | 2.008756% |
| D | 3883 | 308 | 7.932011% |
Noise dominated data is calculated using 1-second bins in cleaned event files. If a bin has >2000 counts, and if more than 50% of those come from <1% of pixels, then it is considered to be noise-dominated and hence unusable.
| Quadrant | # 1 sec bins | Bins with >0 counts | Bins with >2000 counts | High rate bins dominated by noise | Noise dominated (total time) | Noise dominated (detector-on time) | Marked lightcurve |
|---|---|---|---|---|---|---|---|
| A | 3883 | 3883 | 0 | 0 | 0.00% | 0.00% | 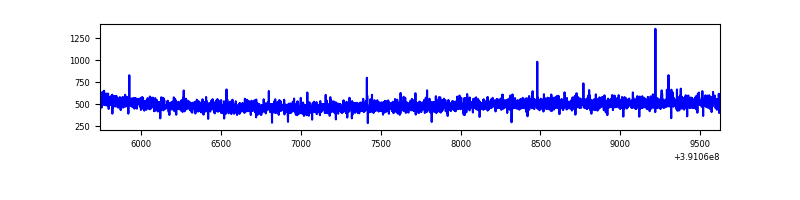 |
| B | 3882 | 3882 | 3784 | 3784 | 97.48% | 97.48% | 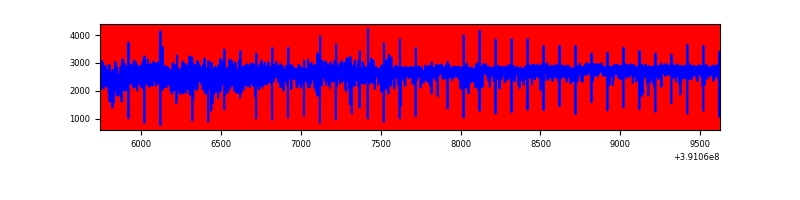 |
| C | 3883 | 3883 | 77 | 77 | 1.98% | 1.98% | 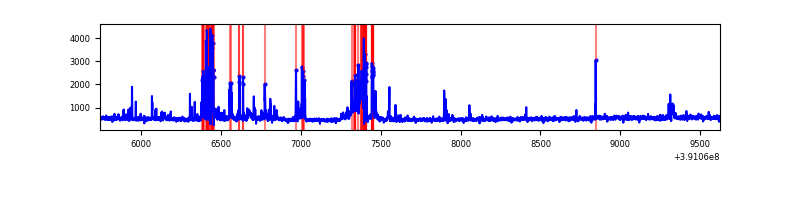 |
| D | 3883 | 3883 | 242 | 242 | 6.23% | 6.23% | 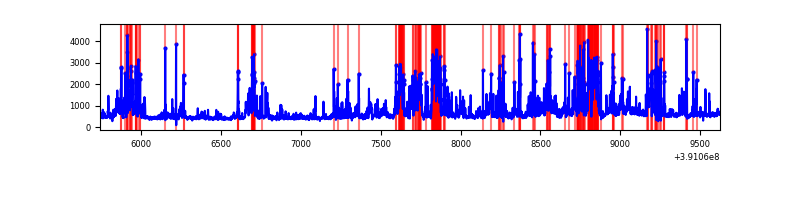 |
Top three noisy pixels from each quadrant. If the there are fewer than three noisy pixels in the level2.evt file, extra rows are filled as -1
| Pixel properties | Quadrant properties | ||||||
|---|---|---|---|---|---|---|---|
| Quadrant | DetID | PixID | Counts | Sigma | Mean | Median | Sigma |
| A | 10 | 83 | 70433 | 739.28 | 469 | 461 | 94.6 |
| A | 8 | 144 | 7262 | 71.86 | 469 | 461 | 94.6 |
| A | 13 | 254 | 5990 | 58.42 | 469 | 461 | 94.6 |
| B | 5 | 31 | 3755837 | 105616.73 | 180 | 176 | 35.6 |
| B | 5 | 15 | 3610274 | 101523.21 | 180 | 176 | 35.6 |
| B | 5 | 14 | 1809970 | 50895.04 | 180 | 176 | 35.6 |
| C | 9 | 187 | 386256 | 3797.05 | 441 | 443 | 101.6 |
| C | 15 | 214 | 155727 | 1528.26 | 441 | 443 | 101.6 |
| C | 0 | 207 | 91596 | 897.1 | 441 | 443 | 101.6 |
| D | 7 | 223 | 688779 | 6524.33 | 433 | 420 | 105.5 |
| D | 10 | 118 | 279335 | 2643.58 | 433 | 420 | 105.5 |
| D | 12 | 17 | 172555 | 1631.51 | 433 | 420 | 105.5 |
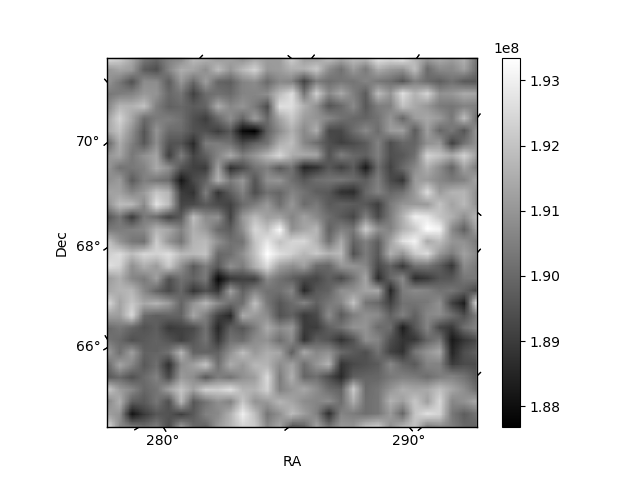
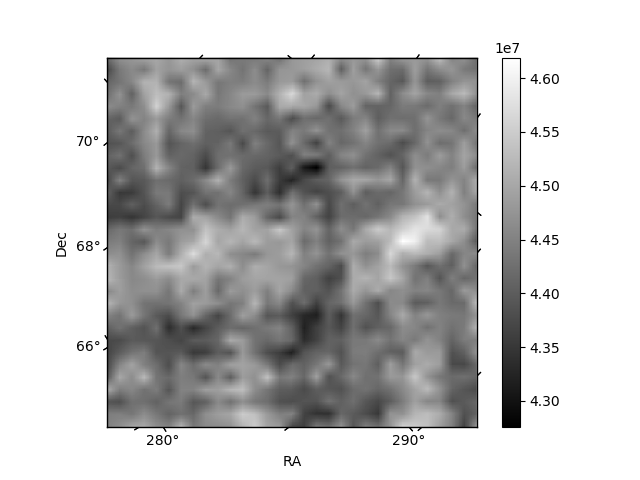
Histogram calculated using DETX and DETY for each event in the final _common_clean file
| Quadrant A | 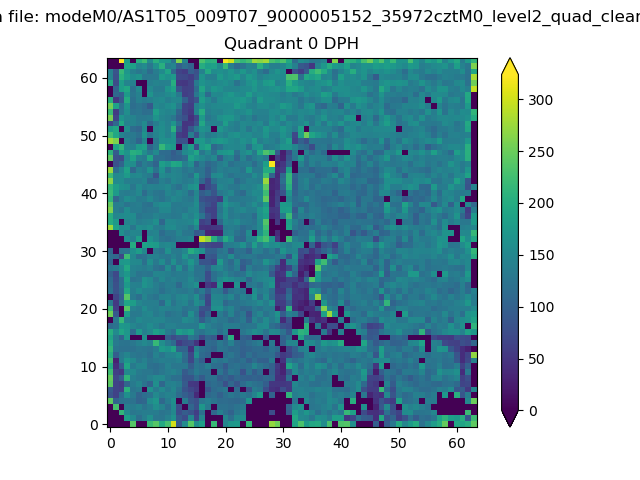 |
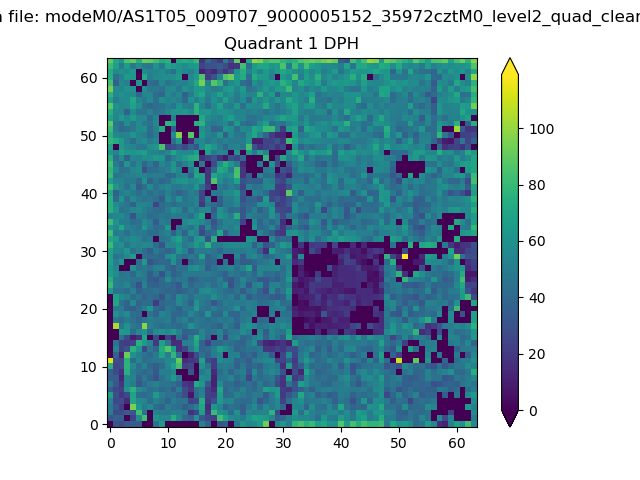 |
Quadrant B |
|---|---|---|---|
| Quadrant D | 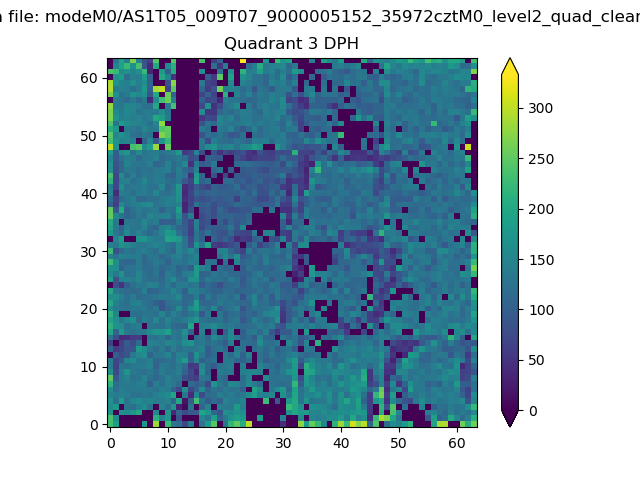 |
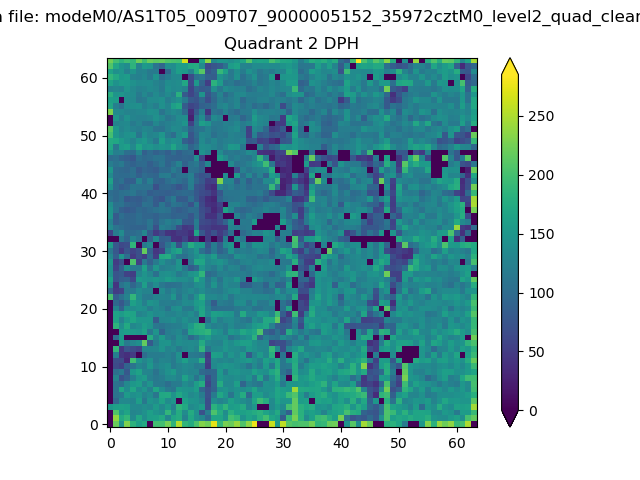 |
Quadrant C |
| Plot type | Count rate plots | Images |
|---|---|---|
| Comparison with Poisson distribution Blue bars denote a histogram of data divided into 1 sec bins. Red curve is a Poisson curve with rate = median count rate of data. |
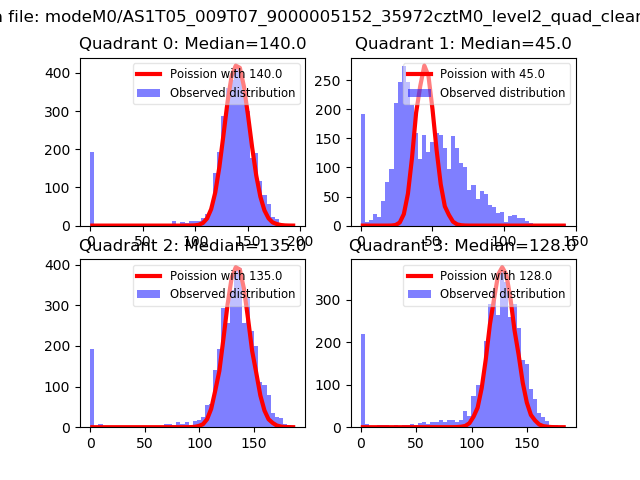 |
 |
| Quadrant-wise count rates Data is divided into 100 sec bins |
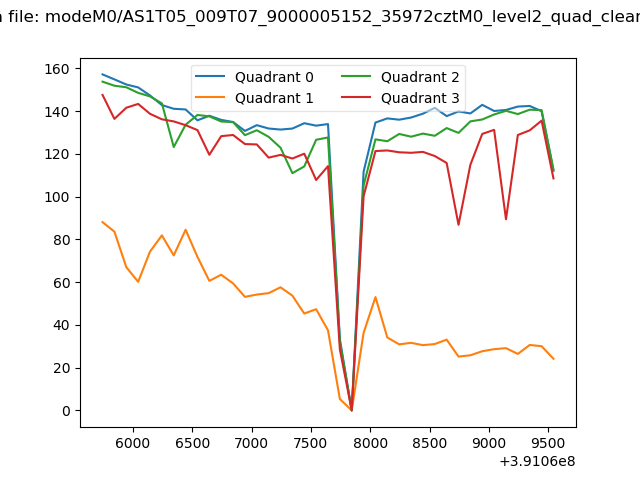 |
|
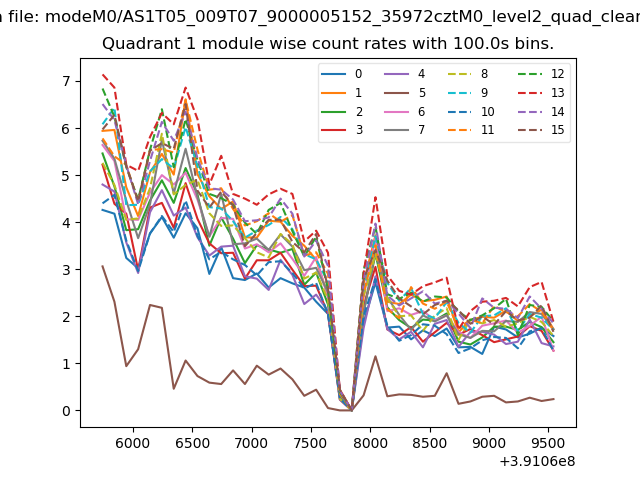
| Module-wise count rates for Quadrant A Data is divided into 100 sec bins |
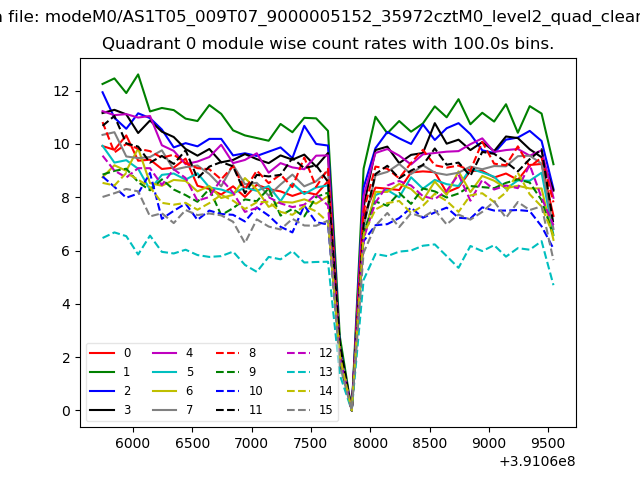 |
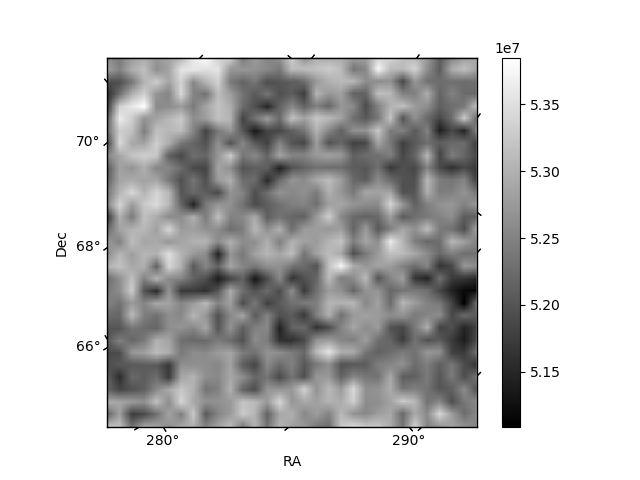 |
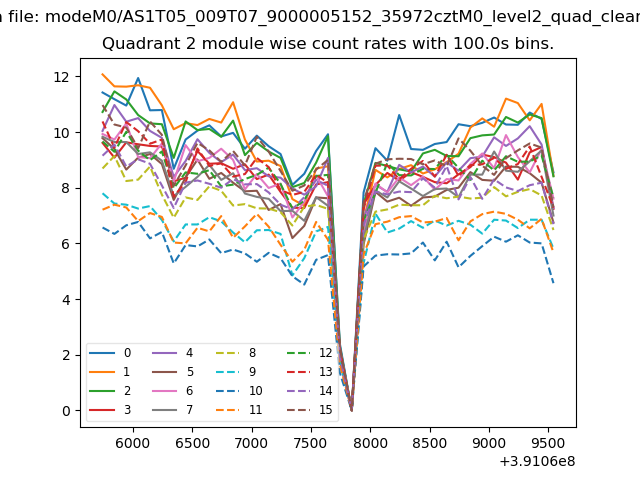
| Module-wise count rates for Quadrant B Data is divided into 100 sec bins |
 |
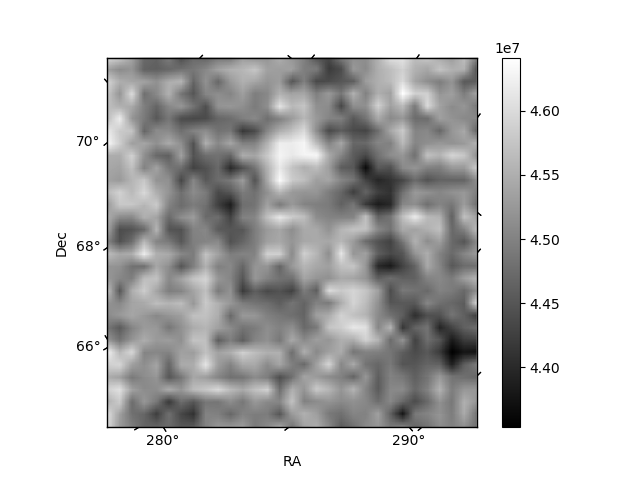 |
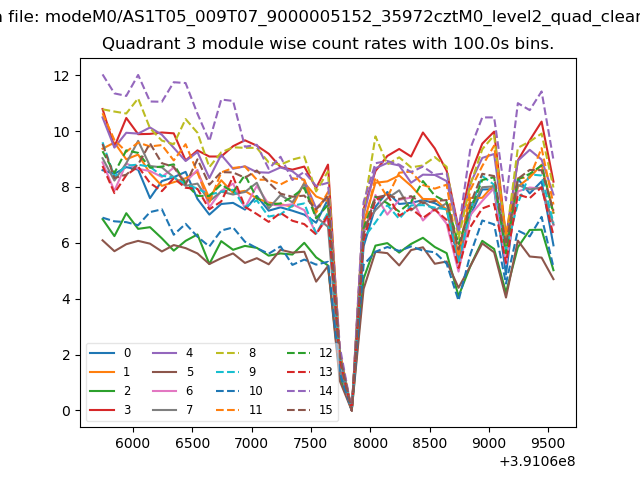
| Module-wise count rates for Quadrant C Data is divided into 100 sec bins |
 |
 |
| Module-wise count rates for Quadrant D Data is divided into 100 sec bins |
 |
 |
| Parameter | Plot |
|---|---|
| CZT HV Monitor | 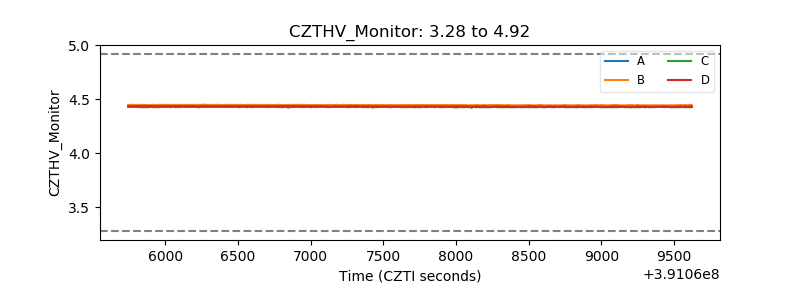 |
| D_VDD | 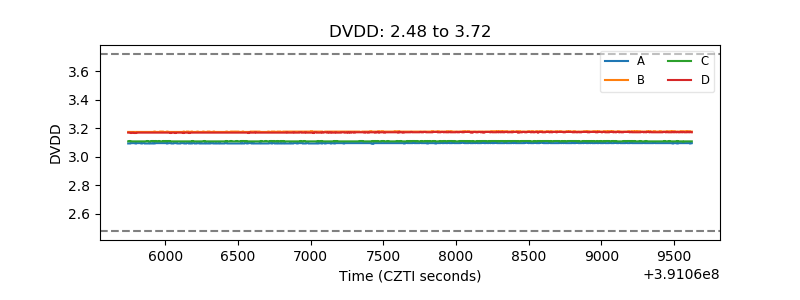 |
| Temperature 1 | 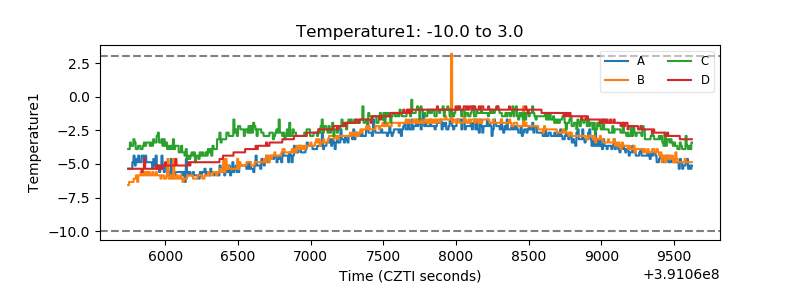 |
| Veto HV Monitor | 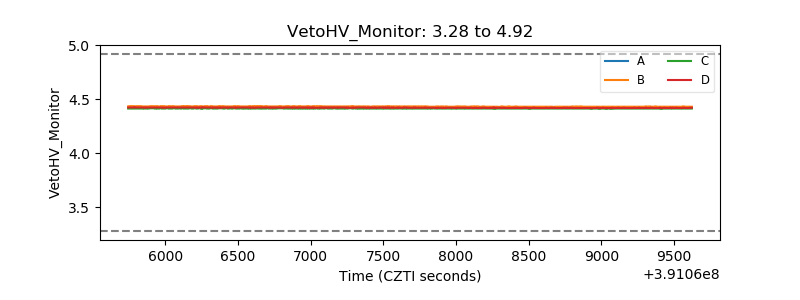 |
| Veto LLD | 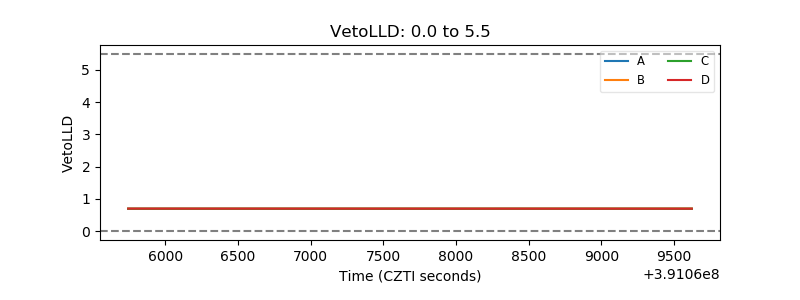 |
| Alpha Counter | 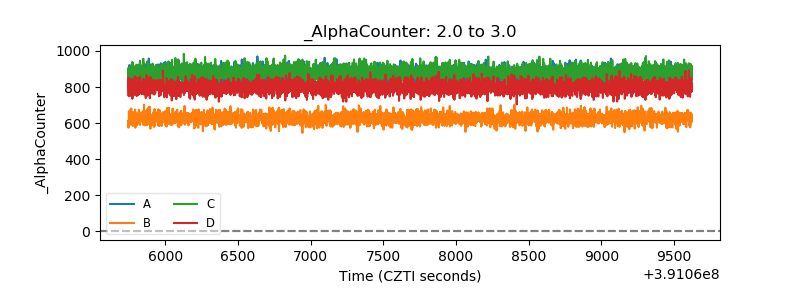 |
| _CPM_Rate | 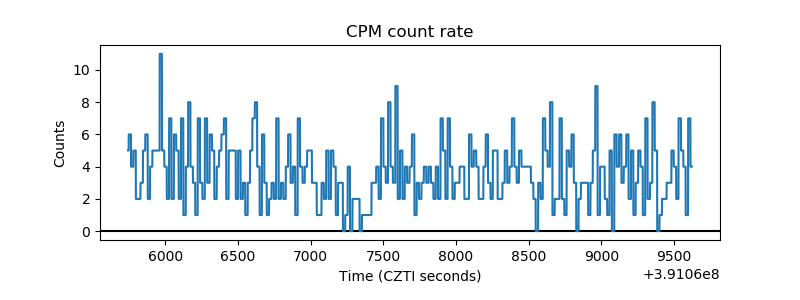 |
| CZT Counter | 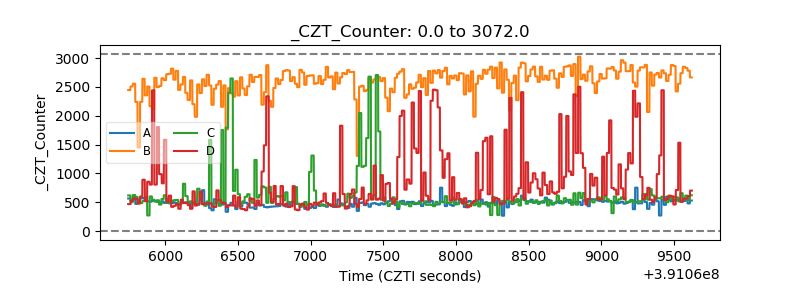 |
| +2.5 Volts monitor |  |
| +5 Volts monitor |  |
| _ROLL_ROT | 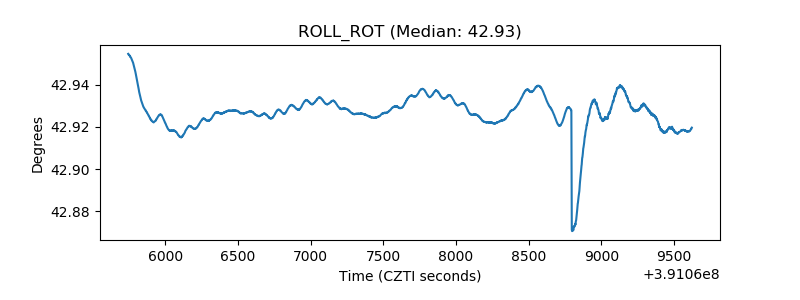 |
| _Roll_DEC | 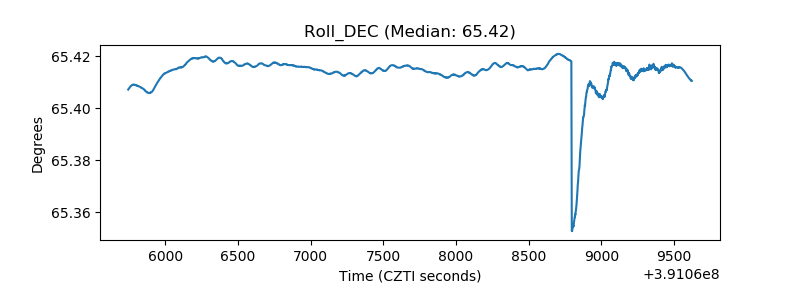 |
| _Roll_RA | 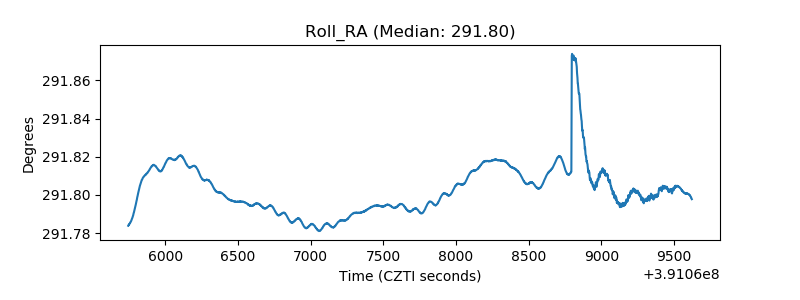 |
| Veto Counter | 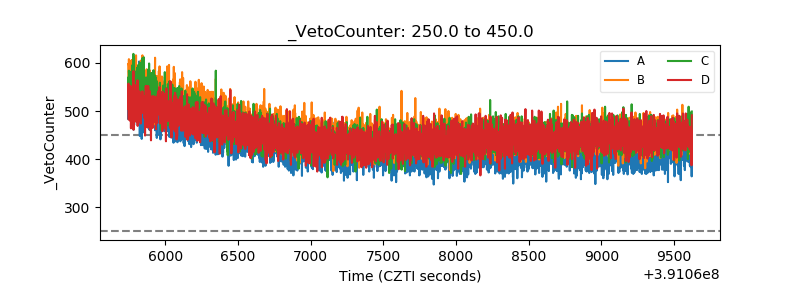 |