| Param | Original file | Final file |
|---|---|---|
| Filename | modeM0/AS1T05_009T08_9000005150_35968cztM0_level2.evt | modeM0/AS1T05_009T08_9000005150_35968cztM0_level2_quad_clean.evt |
| Size (bytes) | 344,928,960 | 40,052,160 |
| Size | 328.9 MB | 38.2 MB |
| Events in quadrant A | 1,201,807 | 312,561 |
| Events in quadrant B | 5,994,850 | 127,473 |
| Events in quadrant C | 1,404,033 | 308,853 |
| Events in quadrant D | 1,681,729 | 290,394 |
| Mode SS | |||
|---|---|---|---|
| Quadrant | BADHDUFLAG | Total packets | Discarded packets |
| A | 0 | 48 | 0 |
| B | 0 | 48 | 0 |
| C | 0 | 48 | 0 |
| D | 0 | 48 | 0 |
| Mode M0 | |||
|---|---|---|---|
| Quadrant | BADHDUFLAG | Total packets | Discarded packets |
| A | 0 | 5016 | 2 |
| B | 0 | 19473 | 1 |
| C | 0 | 5578 | 1 |
| D | 0 | 6616 | 1 |
| Mode M9 | |||
|---|---|---|---|
| Quadrant | BADHDUFLAG | Total packets | Discarded packets |
| A | 0 | 18 | 0 |
| B | 0 | 18 | 0 |
| C | 0 | 18 | 0 |
| D | 0 | 18 | 0 |
| Quadrant | Total seconds | Saturated seconds | Saturation percentage |
|---|---|---|---|
| A | 2399 | 6 | 0.250104% |
| B | 2399 | 2285 | 95.248020% |
| C | 2399 | 43 | 1.792414% |
| D | 2399 | 95 | 3.959983% |
Noise dominated data is calculated using 1-second bins in cleaned event files. If a bin has >2000 counts, and if more than 50% of those come from <1% of pixels, then it is considered to be noise-dominated and hence unusable.
| Quadrant | # 1 sec bins | Bins with >0 counts | Bins with >2000 counts | High rate bins dominated by noise | Noise dominated (total time) | Noise dominated (detector-on time) | Marked lightcurve |
|---|---|---|---|---|---|---|---|
| A | 4132 | 2400 | 2 | 2 | 0.05% | 0.08% | 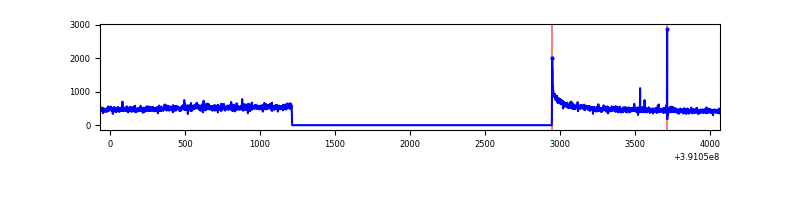 |
| B | 4132 | 2399 | 2191 | 2191 | 53.03% | 91.33% | 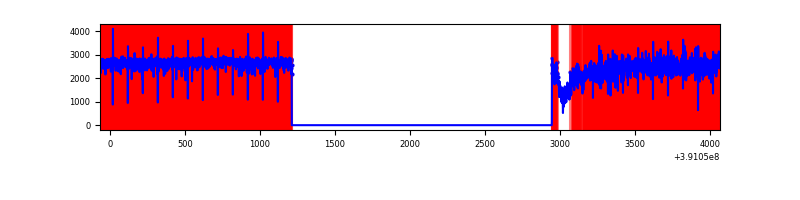 |
| C | 4132 | 2400 | 31 | 31 | 0.75% | 1.29% | 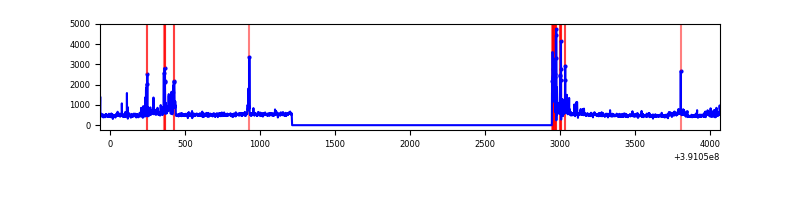 |
| D | 4132 | 2400 | 58 | 58 | 1.40% | 2.42% | 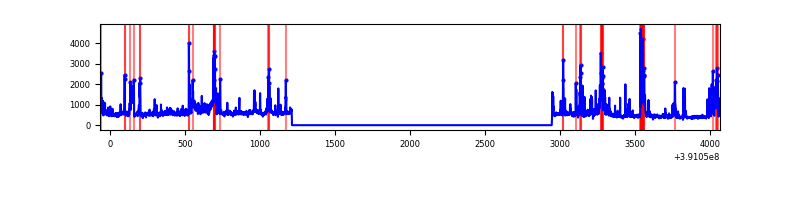 |
Top three noisy pixels from each quadrant. If the there are fewer than three noisy pixels in the level2.evt file, extra rows are filled as -1
| Pixel properties | Quadrant properties | ||||||
|---|---|---|---|---|---|---|---|
| Quadrant | DetID | PixID | Counts | Sigma | Mean | Median | Sigma |
| A | 10 | 83 | 82128 | 1394.25 | 283 | 277 | 58.7 |
| A | 8 | 144 | 11512 | 191.38 | 283 | 277 | 58.7 |
| A | 15 | 169 | 5239 | 84.52 | 283 | 277 | 58.7 |
| B | 5 | 31 | 2280479 | 87508.08 | 126 | 123 | 26.1 |
| B | 5 | 15 | 2091061 | 80239.21 | 126 | 123 | 26.1 |
| B | 5 | 14 | 771143 | 29587.69 | 126 | 123 | 26.1 |
| C | 9 | 187 | 139010 | 2119.78 | 274 | 276 | 65.4 |
| C | 15 | 214 | 101473 | 1546.23 | 274 | 276 | 65.4 |
| C | 0 | 10 | 68896 | 1048.48 | 274 | 276 | 65.4 |
| D | 12 | 17 | 97863 | 1440.98 | 271 | 262 | 67.7 |
| D | 2 | 250 | 92336 | 1359.38 | 271 | 262 | 67.7 |
| D | 8 | 195 | 87113 | 1282.26 | 271 | 262 | 67.7 |
Histogram calculated using DETX and DETY for each event in the final _common_clean file
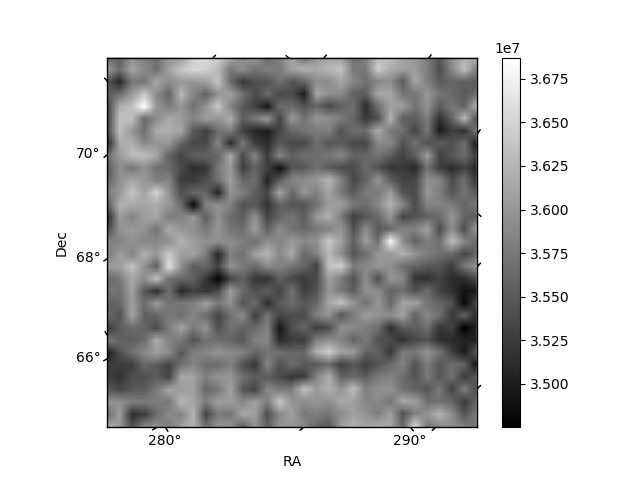
| Quadrant A |  |
 |
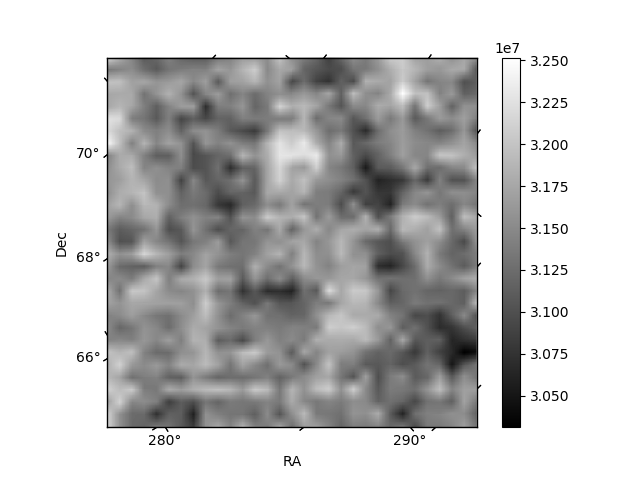
Quadrant B |
|---|---|---|---|
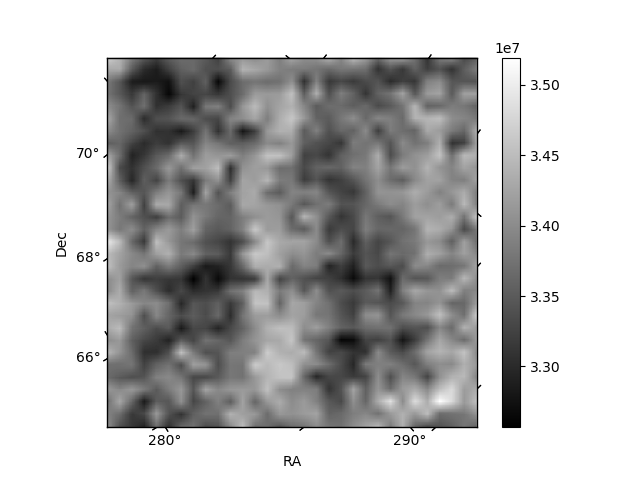
| Quadrant D | 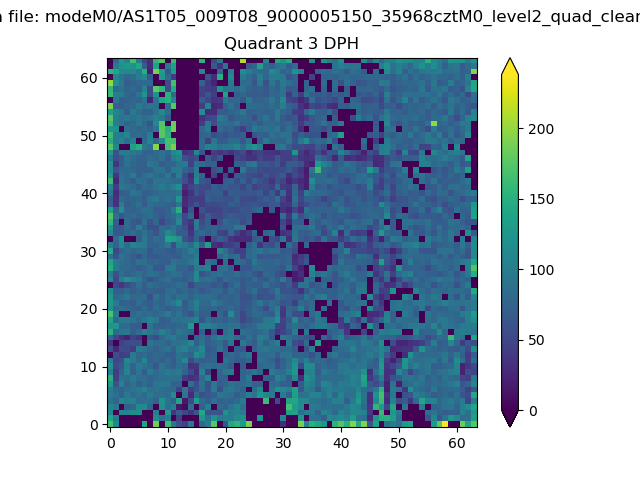 |
 |
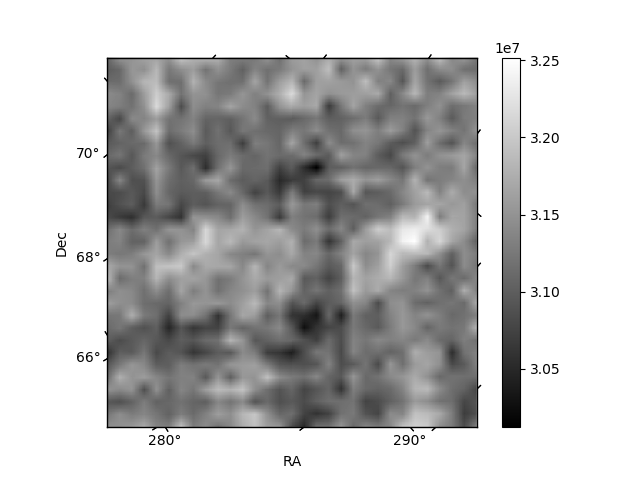
Quadrant C |
| Plot type | Count rate plots | Images |
|---|---|---|
| Comparison with Poisson distribution Blue bars denote a histogram of data divided into 1 sec bins. Red curve is a Poisson curve with rate = median count rate of data. |
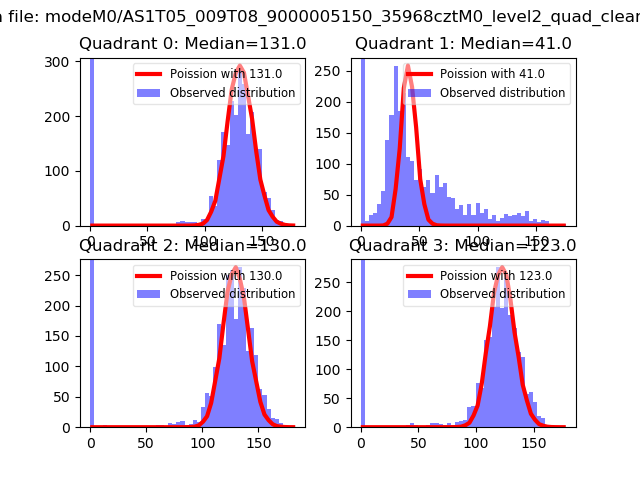 |
 |
| Quadrant-wise count rates Data is divided into 100 sec bins |
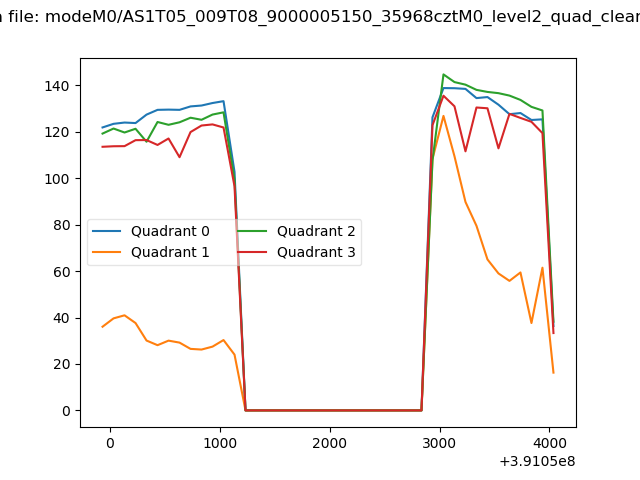 |
|
| Module-wise count rates for Quadrant A Data is divided into 100 sec bins |
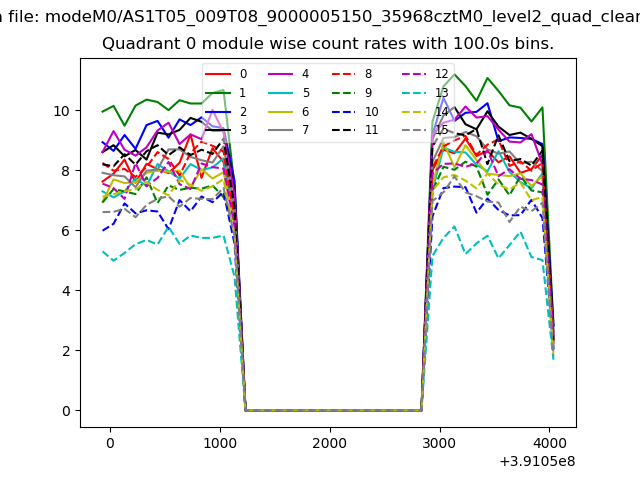 |
 |
| Module-wise count rates for Quadrant B Data is divided into 100 sec bins |
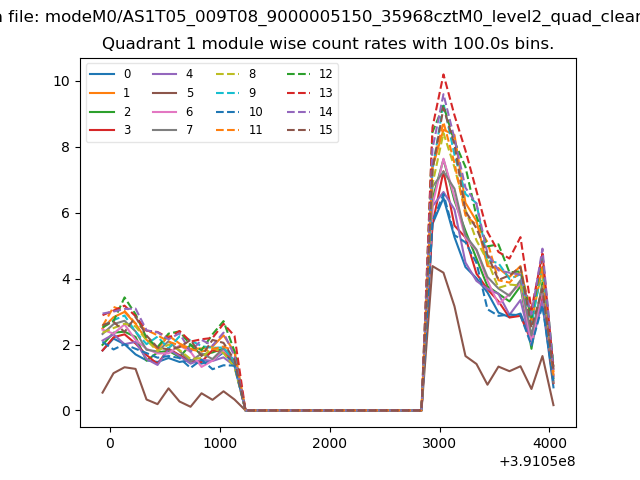 |
 |
| Module-wise count rates for Quadrant C Data is divided into 100 sec bins |
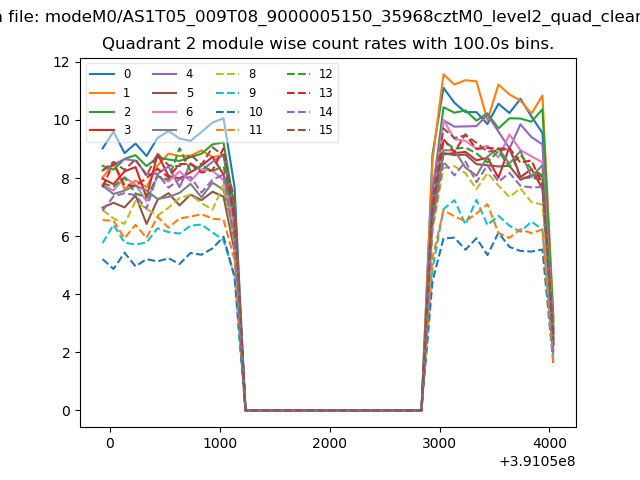 |
 |
| Module-wise count rates for Quadrant D Data is divided into 100 sec bins |
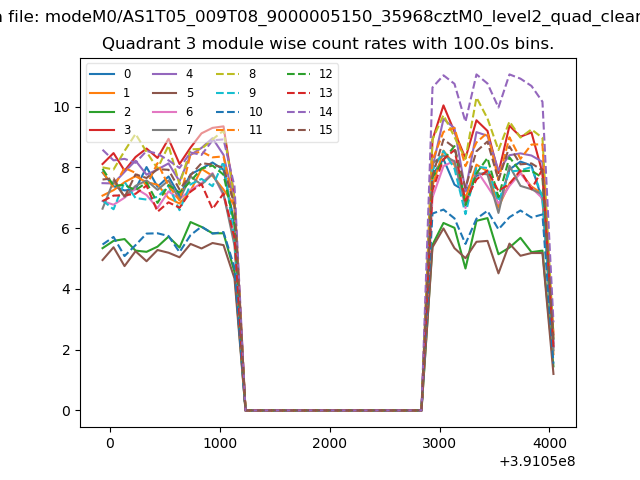 |
 |
| Parameter | Plot |
|---|---|
| CZT HV Monitor | 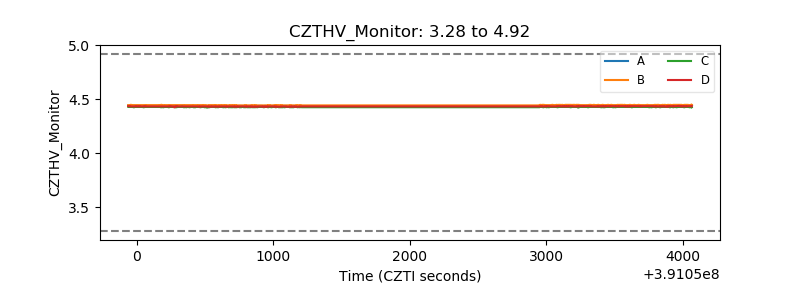 |
| D_VDD | 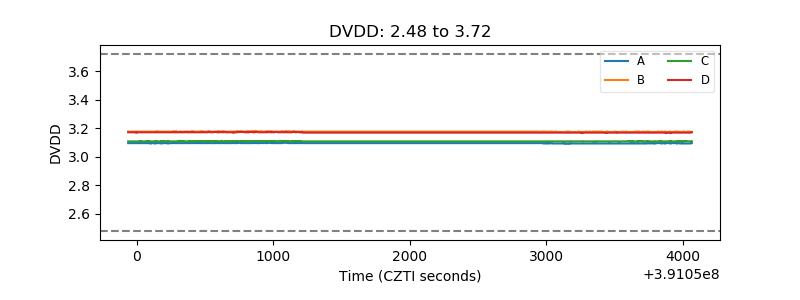 |
| Temperature 1 | 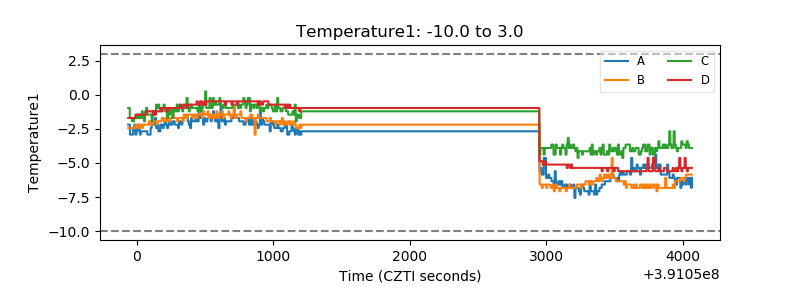 |
| Veto HV Monitor | 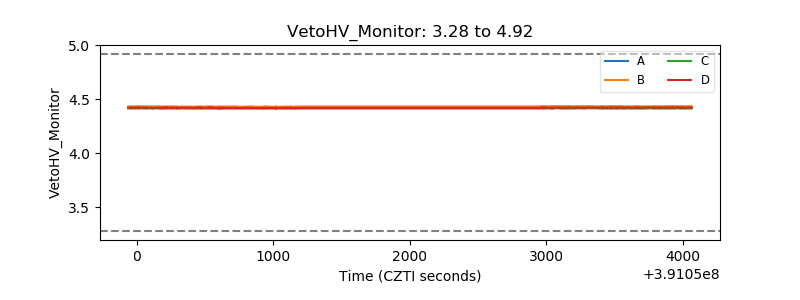 |
| Veto LLD |  |
| Alpha Counter | 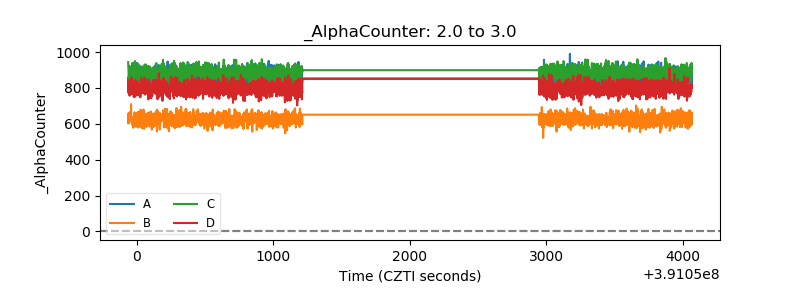 |
| _CPM_Rate | 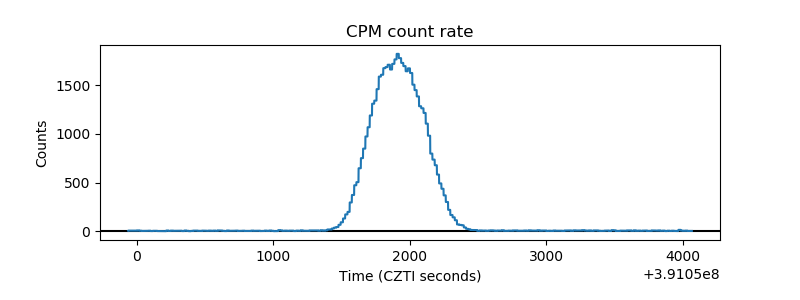 |
| CZT Counter | 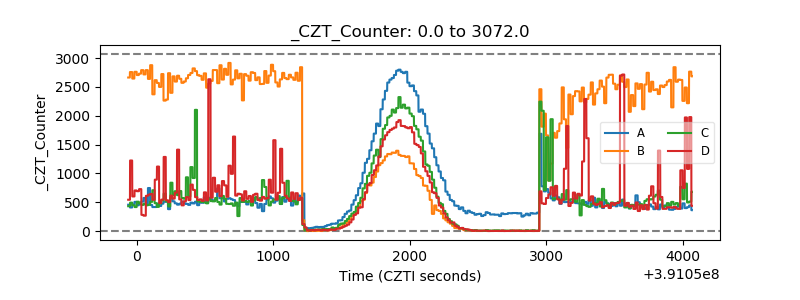 |
| +2.5 Volts monitor | 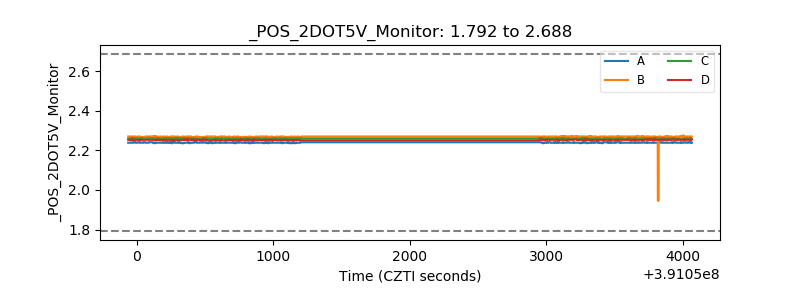 |
| +5 Volts monitor |  |
| _ROLL_ROT | 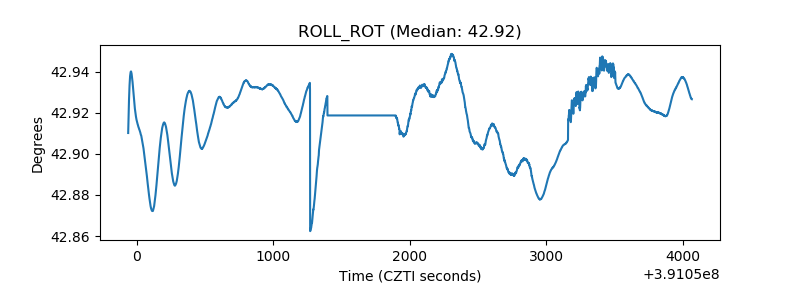 |
| _Roll_DEC | 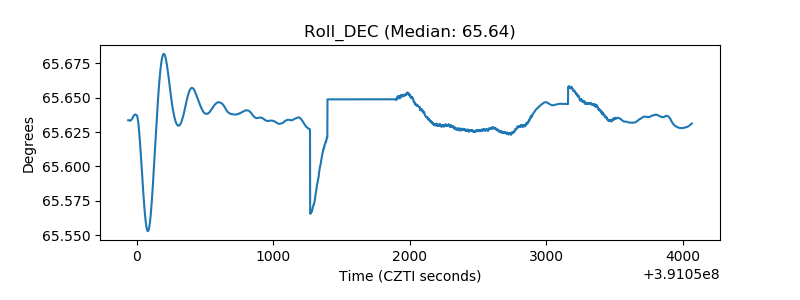 |
| _Roll_RA | 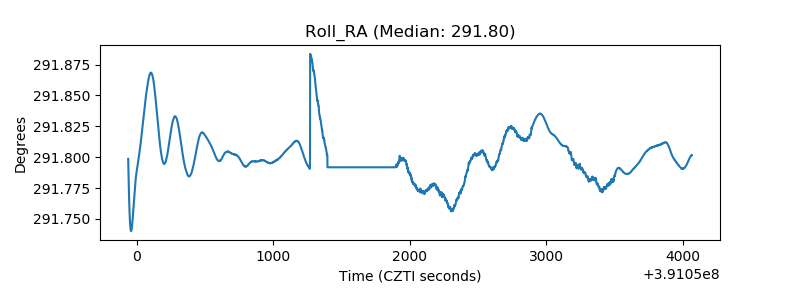 |
| Veto Counter | 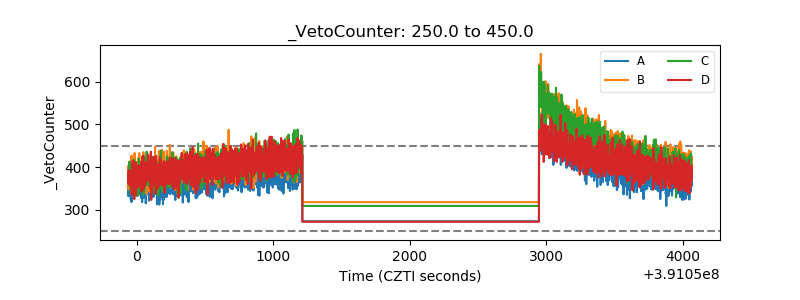 |