| Param | Original file | Final file |
|---|---|---|
| Filename | modeM0/AS1T05_009T08_9000005150_35969cztM0_level2.evt | modeM0/AS1T05_009T08_9000005150_35969cztM0_level2_quad_clean.evt |
| Size (bytes) | 792,780,480 | 90,129,600 |
| Size | 756.1 MB | 86.0 MB |
| Events in quadrant A | 2,602,499 | 706,213 |
| Events in quadrant B | 13,867,953 | 286,108 |
| Events in quadrant C | 3,337,407 | 693,658 |
| Events in quadrant D | 3,833,928 | 660,462 |
| Mode SS | |||
|---|---|---|---|
| Quadrant | BADHDUFLAG | Total packets | Discarded packets |
| A | 0 | 112 | 0 |
| B | 0 | 112 | 0 |
| C | 0 | 112 | 0 |
| D | 0 | 112 | 0 |
| Mode M0 | |||
|---|---|---|---|
| Quadrant | BADHDUFLAG | Total packets | Discarded packets |
| A | 0 | 11241 | 3 |
| B | 0 | 44882 | 2 |
| C | 0 | 13151 | 2 |
| D | 0 | 15213 | 2 |
| Mode M9 | |||
|---|---|---|---|
| Quadrant | BADHDUFLAG | Total packets | Discarded packets |
| A | 0 | 28 | 0 |
| B | 0 | 28 | 0 |
| C | 0 | 28 | 0 |
| D | 0 | 29 | 0 |
| Quadrant | Total seconds | Saturated seconds | Saturation percentage |
|---|---|---|---|
| A | 5429 | 9 | 0.165776% |
| B | 5429 | 5315 | 97.900166% |
| C | 5429 | 245 | 4.512802% |
| D | 5429 | 235 | 4.328606% |
Noise dominated data is calculated using 1-second bins in cleaned event files. If a bin has >2000 counts, and if more than 50% of those come from <1% of pixels, then it is considered to be noise-dominated and hence unusable.
| Quadrant | # 1 sec bins | Bins with >0 counts | Bins with >2000 counts | High rate bins dominated by noise | Noise dominated (total time) | Noise dominated (detector-on time) | Marked lightcurve |
|---|---|---|---|---|---|---|---|
| A | 7281 | 5430 | 3 | 3 | 0.04% | 0.06% | 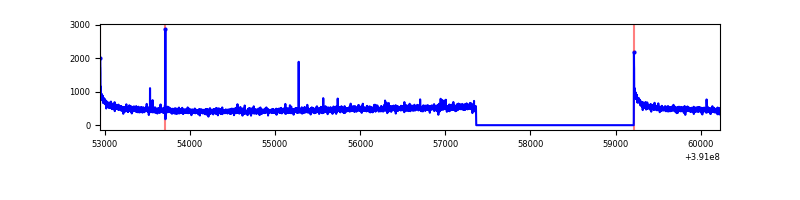 |
| B | 7281 | 5429 | 5179 | 5179 | 71.13% | 95.40% | 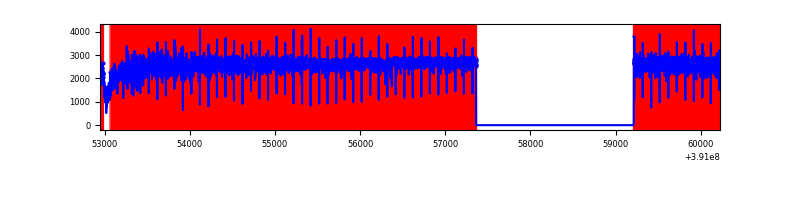 |
| C | 7281 | 5430 | 172 | 172 | 2.36% | 3.17% | 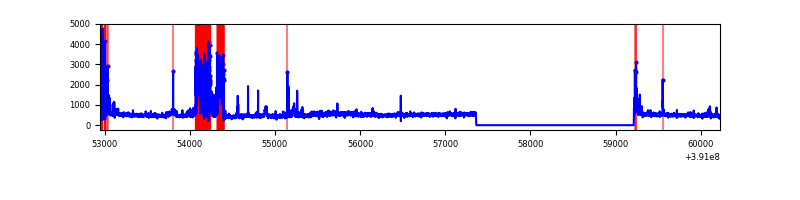 |
| D | 7281 | 5430 | 201 | 201 | 2.76% | 3.70% | 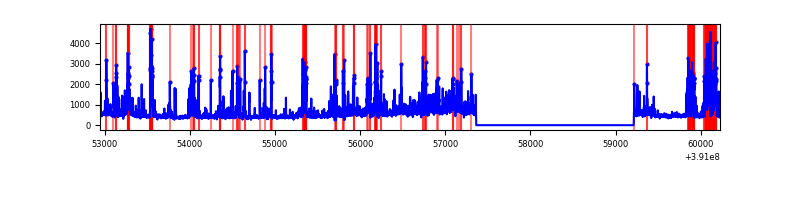 |
Top three noisy pixels from each quadrant. If the there are fewer than three noisy pixels in the level2.evt file, extra rows are filled as -1
| Pixel properties | Quadrant properties | ||||||
|---|---|---|---|---|---|---|---|
| Quadrant | DetID | PixID | Counts | Sigma | Mean | Median | Sigma |
| A | 10 | 83 | 170612 | 1370.08 | 619 | 606 | 124.1 |
| A | 15 | 169 | 16052 | 124.48 | 619 | 606 | 124.1 |
| A | 8 | 144 | 12721 | 97.64 | 619 | 606 | 124.1 |
| B | 5 | 31 | 4854754 | 90754.47 | 273 | 266 | 53.5 |
| B | 5 | 15 | 4699230 | 87846.96 | 273 | 266 | 53.5 |
| B | 5 | 14 | 2695567 | 50388.55 | 273 | 266 | 53.5 |
| C | 9 | 187 | 640572 | 4695.01 | 588 | 592 | 136.3 |
| C | 15 | 214 | 224194 | 1640.38 | 588 | 592 | 136.3 |
| C | 0 | 10 | 109200 | 796.77 | 588 | 592 | 136.3 |
| D | 2 | 250 | 482261 | 3387.51 | 590 | 575 | 142.2 |
| D | 12 | 17 | 243737 | 1710.07 | 590 | 575 | 142.2 |
| D | 7 | 223 | 133037 | 931.55 | 590 | 575 | 142.2 |
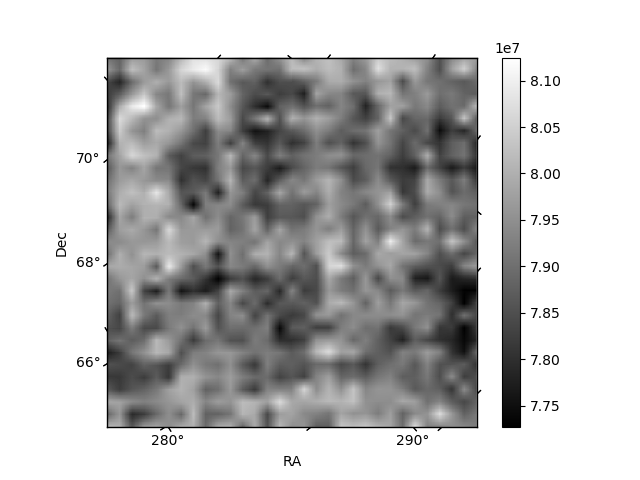
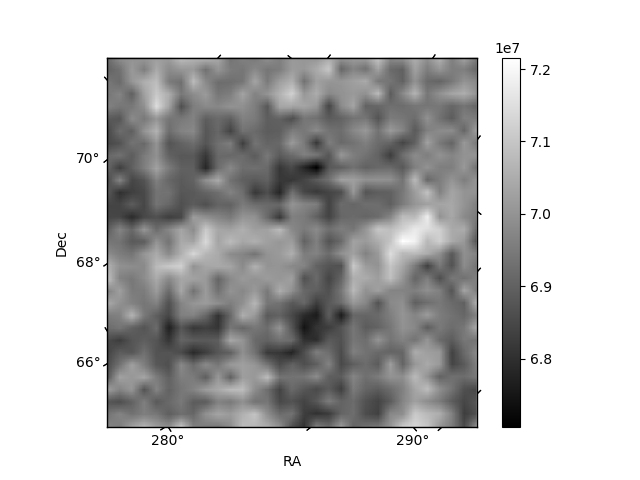
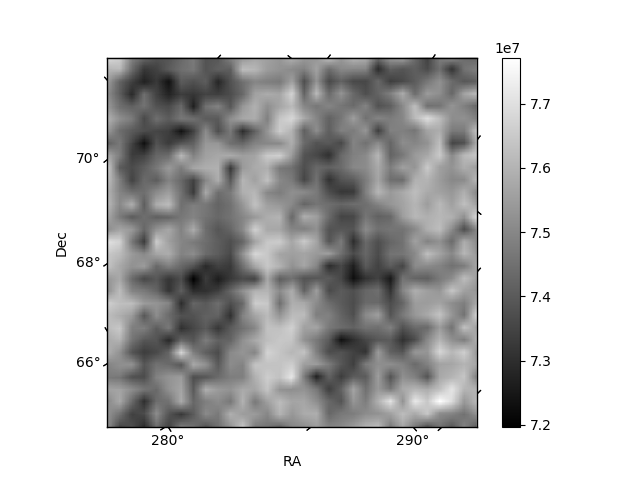
Histogram calculated using DETX and DETY for each event in the final _common_clean file
| Quadrant A | 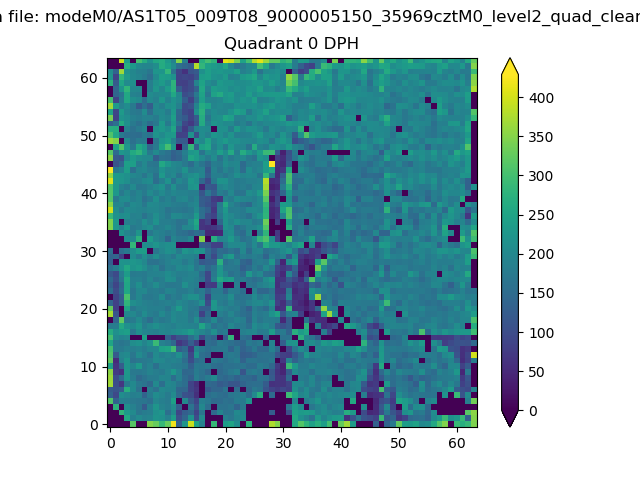 |
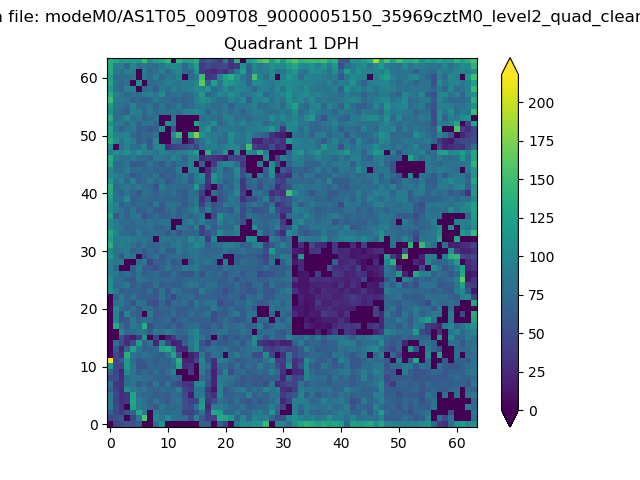 |
Quadrant B |
|---|---|---|---|
| Quadrant D | 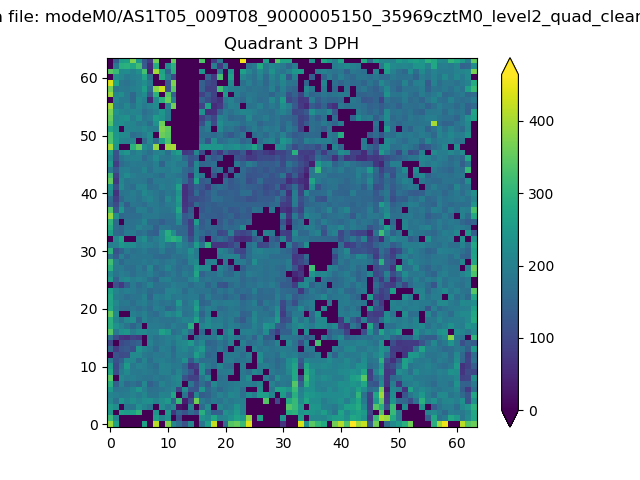 |
 |
Quadrant C |
| Plot type | Count rate plots | Images |
|---|---|---|
| Comparison with Poisson distribution Blue bars denote a histogram of data divided into 1 sec bins. Red curve is a Poisson curve with rate = median count rate of data. |
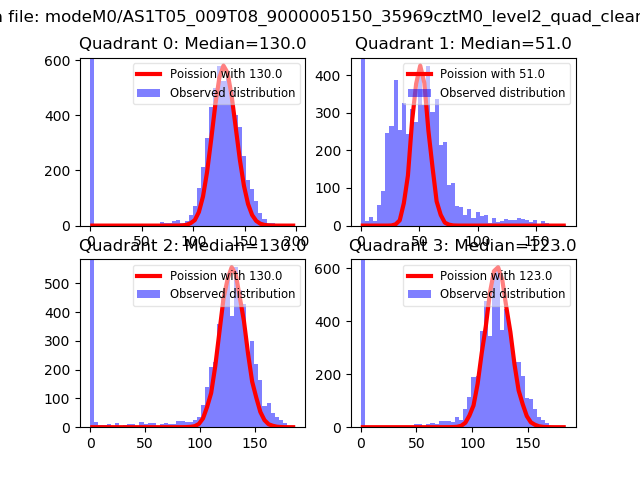 |
 |
| Quadrant-wise count rates Data is divided into 100 sec bins |
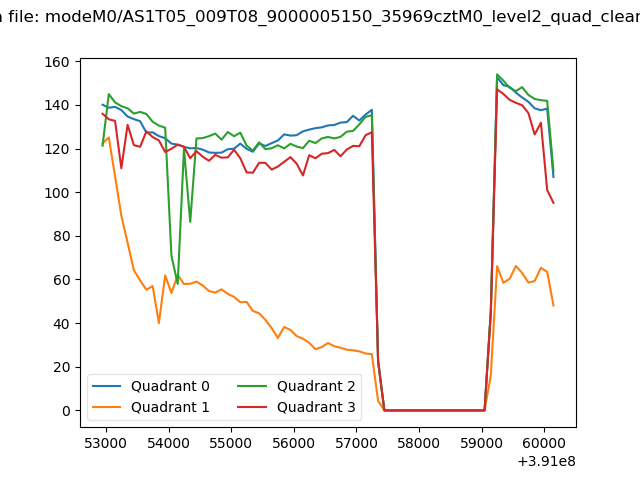 |
|
| Module-wise count rates for Quadrant A Data is divided into 100 sec bins |
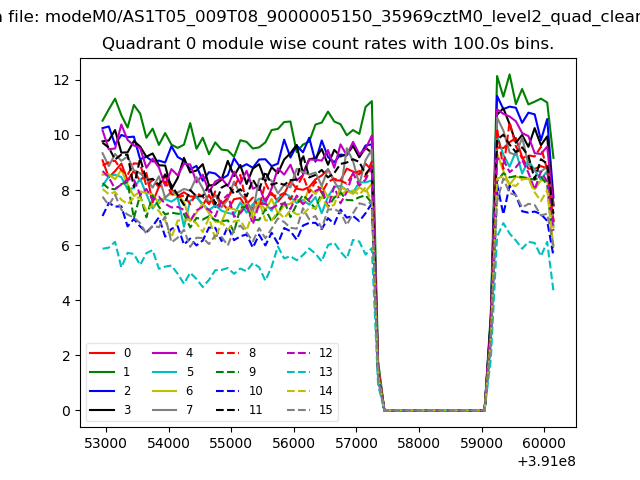 |
 |
| Module-wise count rates for Quadrant B Data is divided into 100 sec bins |
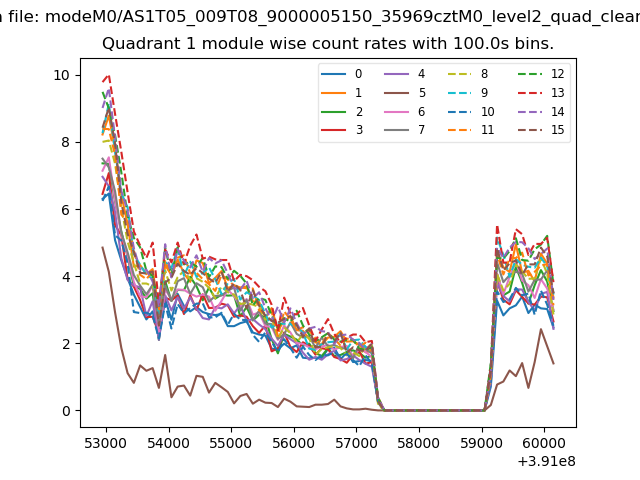 |
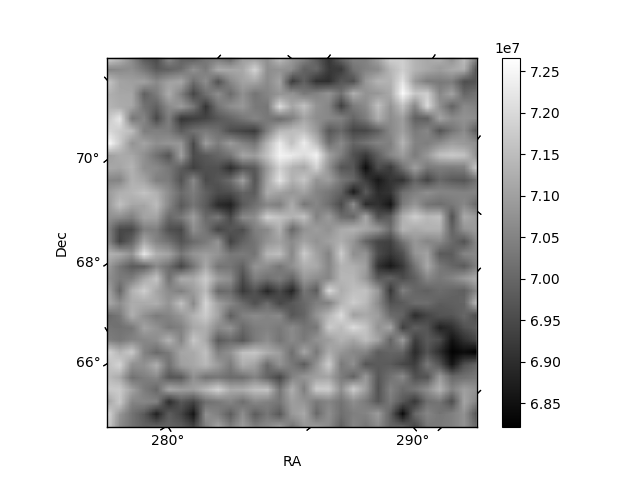 |
| Module-wise count rates for Quadrant C Data is divided into 100 sec bins |
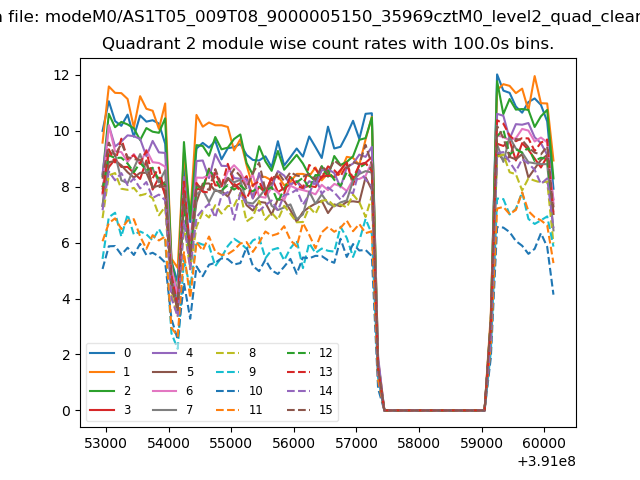 |
 |
| Module-wise count rates for Quadrant D Data is divided into 100 sec bins |
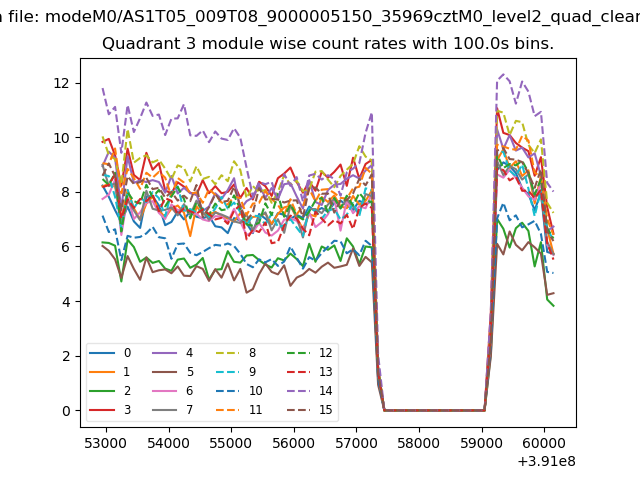 |
 |
| Parameter | Plot |
|---|---|
| CZT HV Monitor | 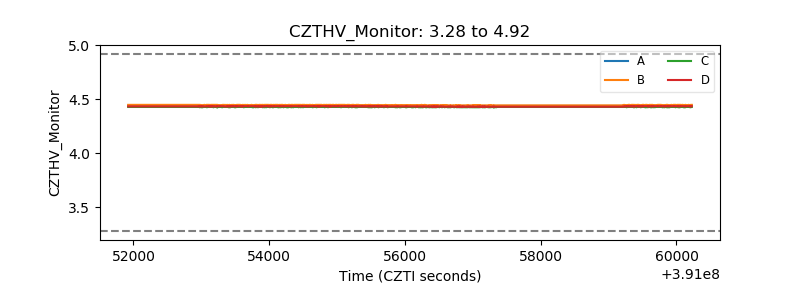 |
| D_VDD | 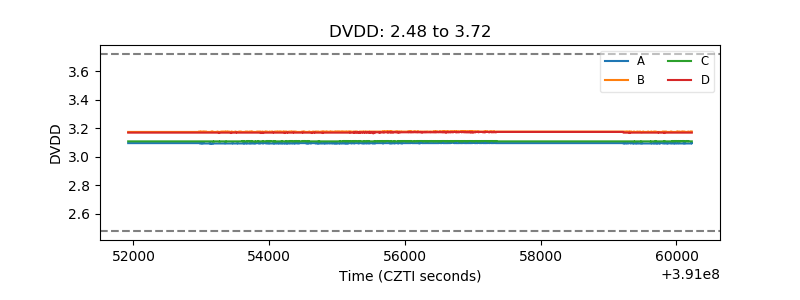 |
| Temperature 1 | 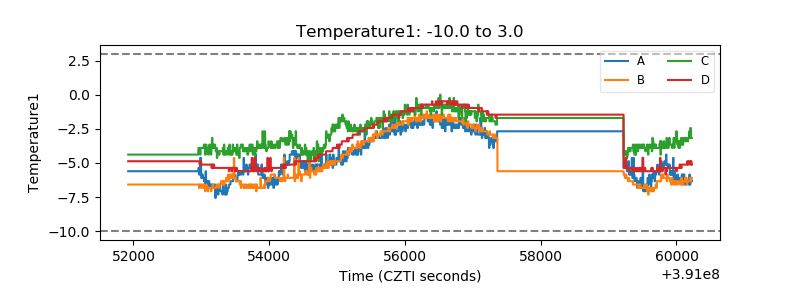 |
| Veto HV Monitor |  |
| Veto LLD | 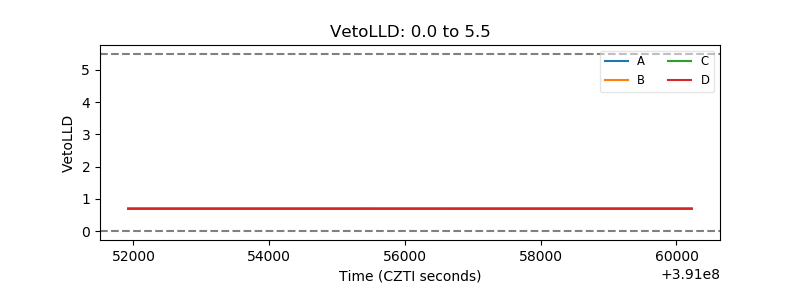 |
| Alpha Counter | 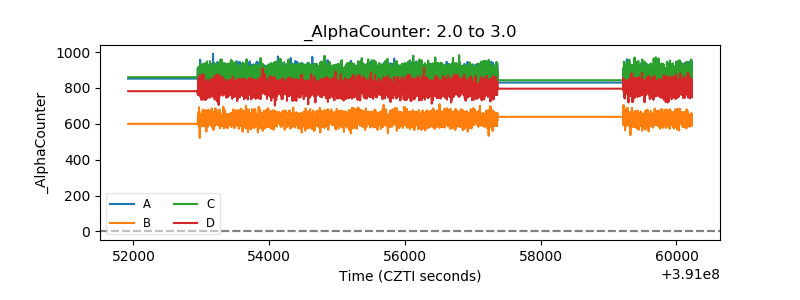 |
| _CPM_Rate | 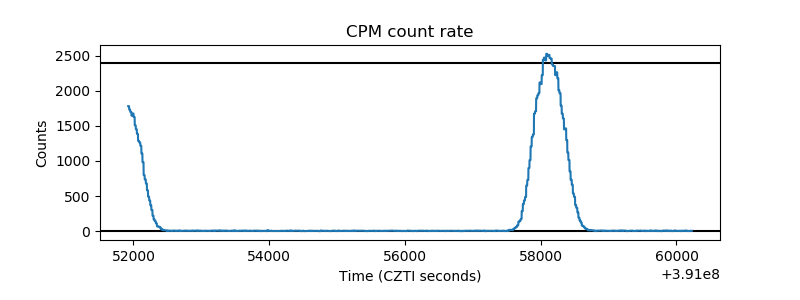 |
| CZT Counter |  |
| +2.5 Volts monitor |  |
| +5 Volts monitor |  |
| _ROLL_ROT | 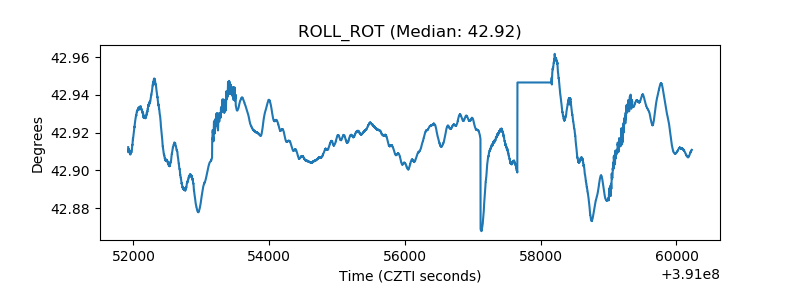 |
| _Roll_DEC | 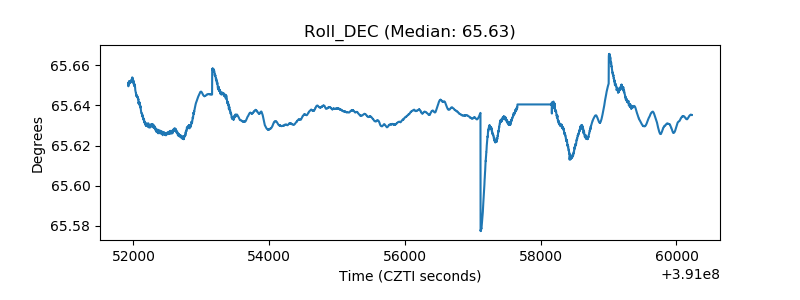 |
| _Roll_RA | 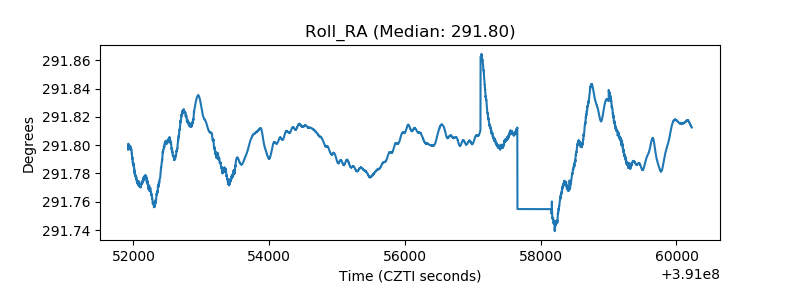 |
| Veto Counter | 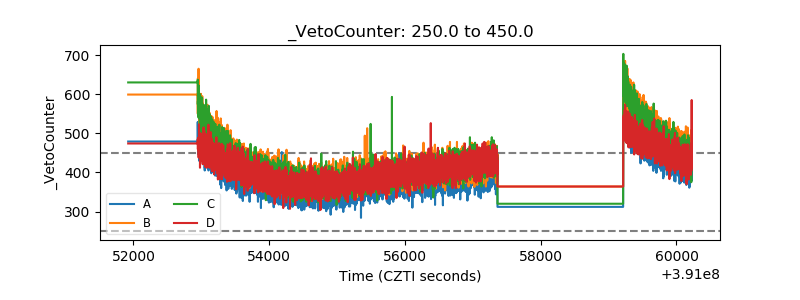 |