| Param | Original file | Final file |
|---|---|---|
| Filename | modeM0/AS1T04_069T01_9000005158_36017cztM0_level2.evt | modeM0/AS1T04_069T01_9000005158_36017cztM0_level2_quad_clean.evt |
| Size (bytes) | 449,280,000 | 67,855,680 |
| Size | 428.5 MB | 64.7 MB |
| Events in quadrant A | 2,644,079 | 433,106 |
| Events in quadrant B | 3,755,140 | 432,062 |
| Events in quadrant C | 2,966,937 | 427,947 |
| Events in quadrant D | 3,889,300 | 398,874 |
Noise dominated data is calculated using 1-second bins in cleaned event files. If a bin has >2000 counts, and if more than 50% of those come from <1% of pixels, then it is considered to be noise-dominated and hence unusable.
| Quadrant | # 1 sec bins | Bins with >0 counts | Bins with >2000 counts | High rate bins dominated by noise | Noise dominated (total time) | Noise dominated (detector-on time) | Marked lightcurve |
|---|---|---|---|---|---|---|---|
| A | 9335 | 5182 | 7 | 7 | 0.07% | 0.14% | 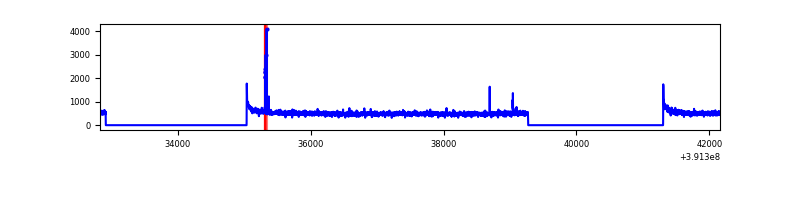 |
| B | 9335 | 5182 | 69 | 69 | 0.74% | 1.33% | 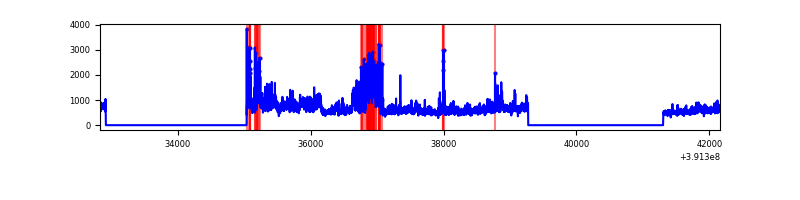 |
| C | 9335 | 5182 | 66 | 66 | 0.71% | 1.27% | 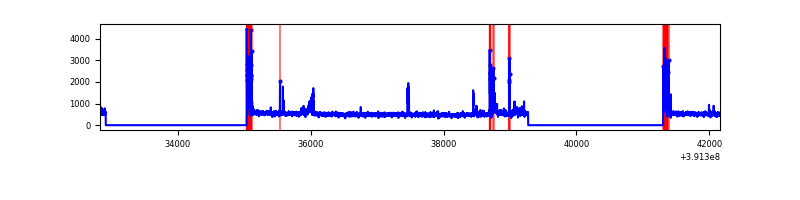 |
| D | 9335 | 5181 | 222 | 222 | 2.38% | 4.28% | 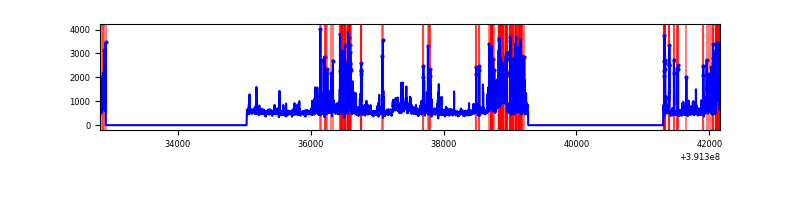 |
Top three noisy pixels from each quadrant. If the there are fewer than three noisy pixels in the level2.evt file, extra rows are filled as -1
| Pixel properties | Quadrant properties | ||||||
|---|---|---|---|---|---|---|---|
| Quadrant | DetID | PixID | Counts | Sigma | Mean | Median | Sigma |
| A | 10 | 83 | 166969 | 1295.22 | 632 | 620 | 128.4 |
| A | 10 | 248 | 23615 | 179.04 | 632 | 620 | 128.4 |
| A | 13 | 254 | 8441 | 60.9 | 632 | 620 | 128.4 |
| B | 0 | 213 | 833991 | 7015.33 | 620 | 604 | 118.8 |
| B | 0 | 190 | 255662 | 2147.04 | 620 | 604 | 118.8 |
| B | 0 | 245 | 93928 | 785.59 | 620 | 604 | 118.8 |
| C | 15 | 214 | 217951 | 1541.31 | 607 | 611 | 141.0 |
| C | 0 | 10 | 191115 | 1350.99 | 607 | 611 | 141.0 |
| C | 9 | 187 | 187869 | 1327.97 | 607 | 611 | 141.0 |
| D | 12 | 235 | 570515 | 3904.39 | 603 | 587 | 146.0 |
| D | 12 | 6 | 566334 | 3875.75 | 603 | 587 | 146.0 |
| D | 13 | 249 | 116265 | 792.47 | 603 | 587 | 146.0 |
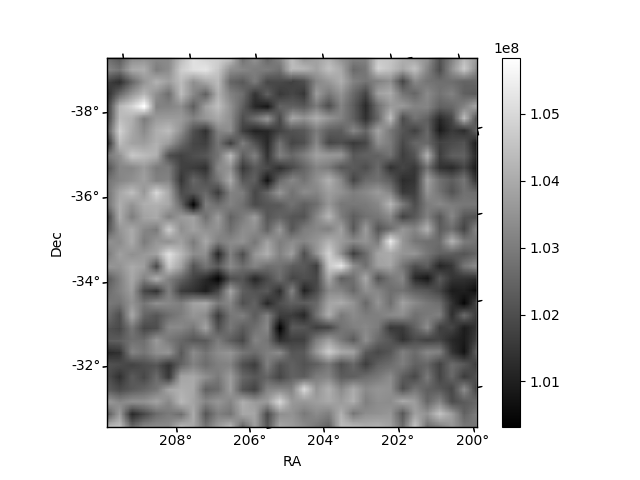
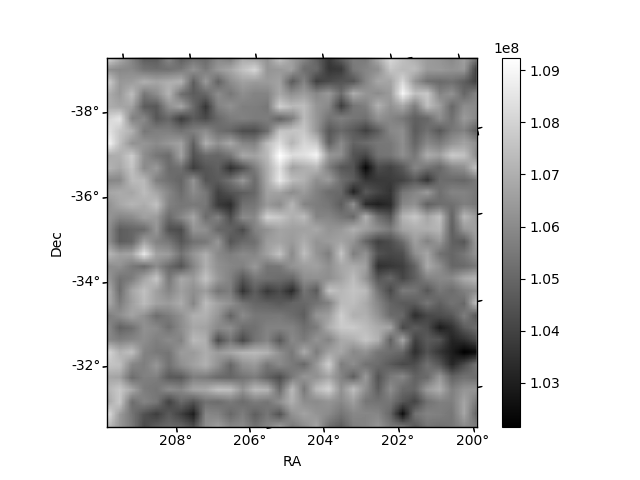
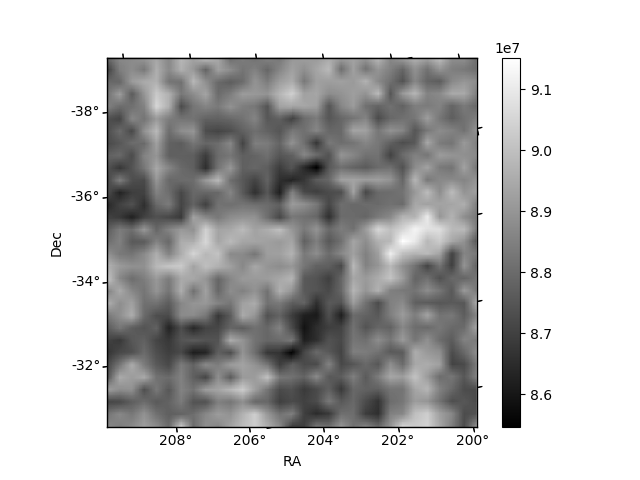
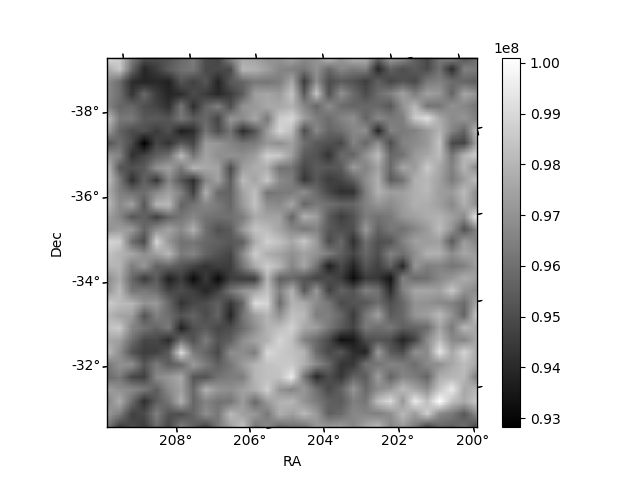
Histogram calculated using DETX and DETY for each event in the final _common_clean file
| Quadrant A | 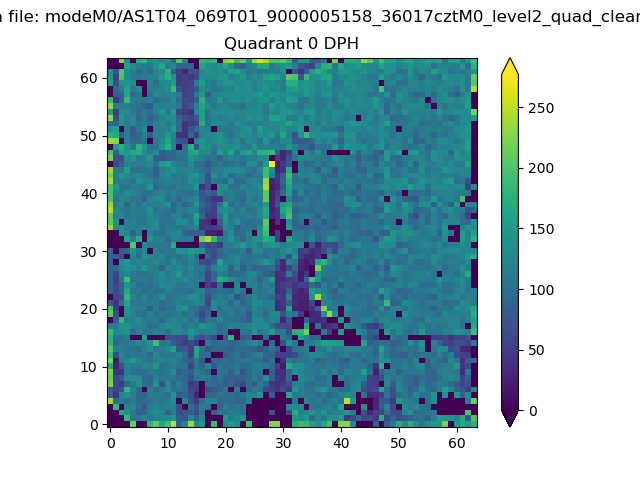 |
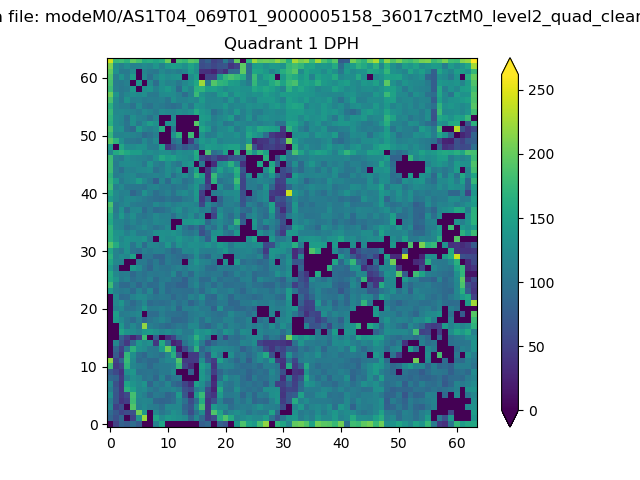 |
Quadrant B |
|---|---|---|---|
| Quadrant D | 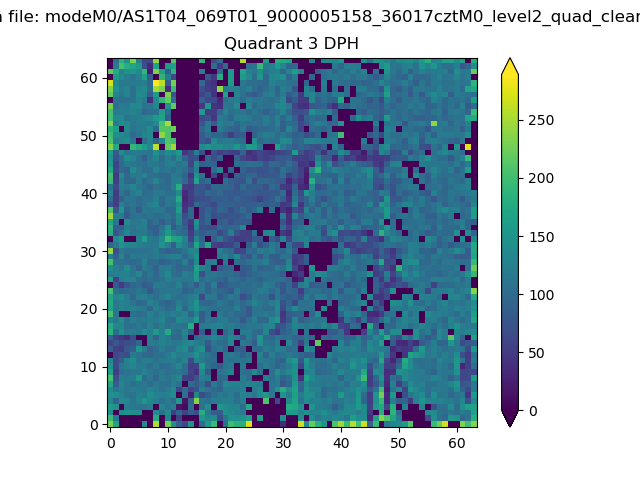 |
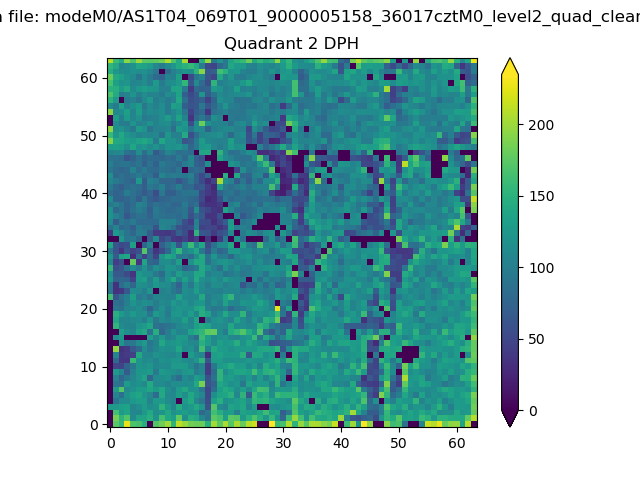 |
Quadrant C |
| Plot type | Count rate plots | Images |
|---|---|---|
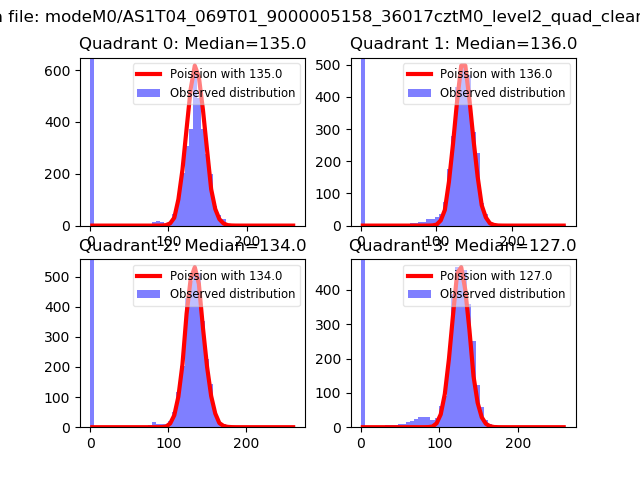
| Comparison with Poisson distribution Blue bars denote a histogram of data divided into 1 sec bins. Red curve is a Poisson curve with rate = median count rate of data. |
 |
 |
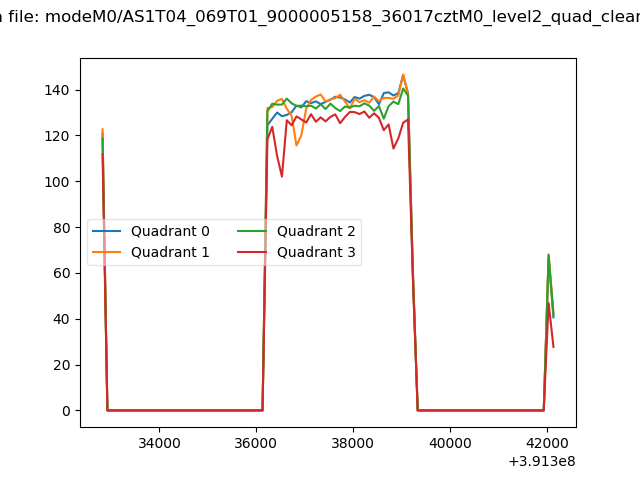
| Quadrant-wise count rates Data is divided into 100 sec bins |
 |
|
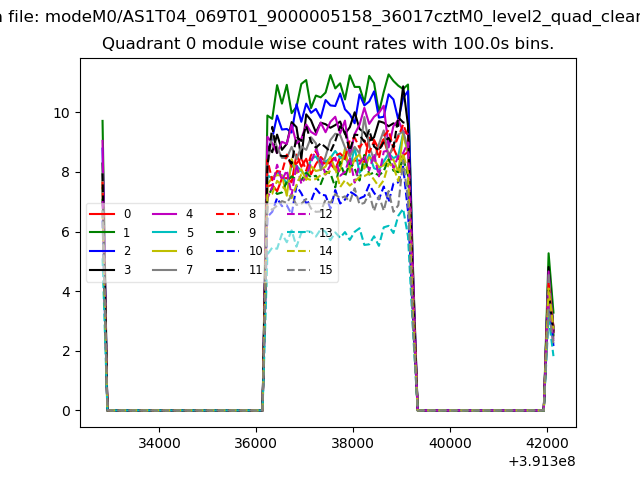
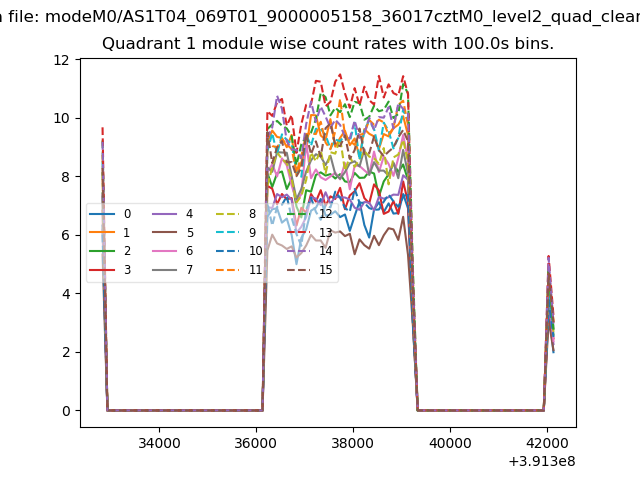
| Module-wise count rates for Quadrant A Data is divided into 100 sec bins |
 |
 |
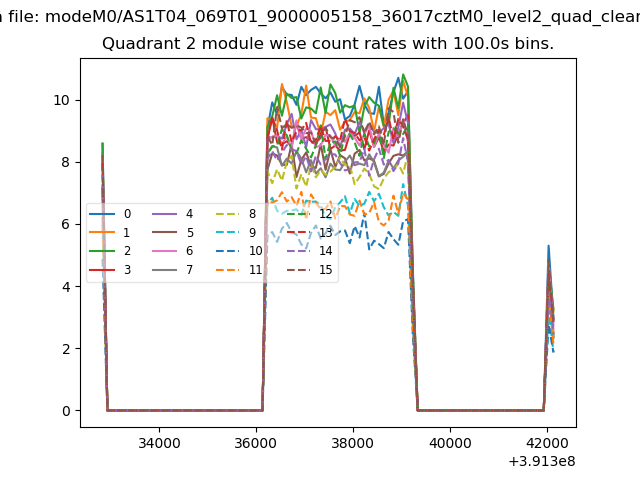
| Module-wise count rates for Quadrant B Data is divided into 100 sec bins |
 |
 |
| Module-wise count rates for Quadrant C Data is divided into 100 sec bins |
 |
 |
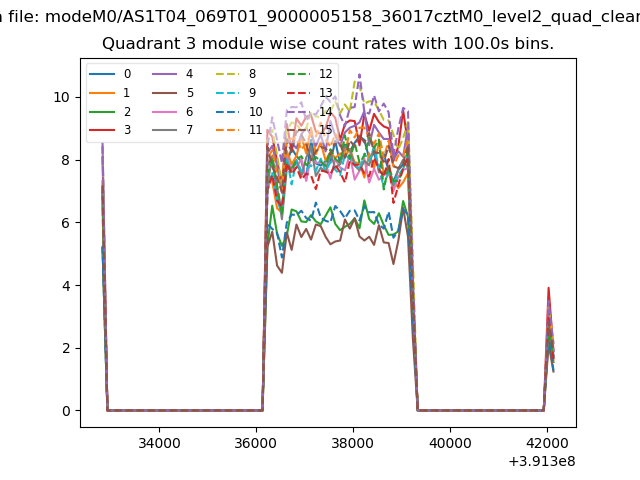
| Module-wise count rates for Quadrant D Data is divided into 100 sec bins |
 |
 |
| Parameter | Plot |
|---|---|
| CZT HV Monitor | 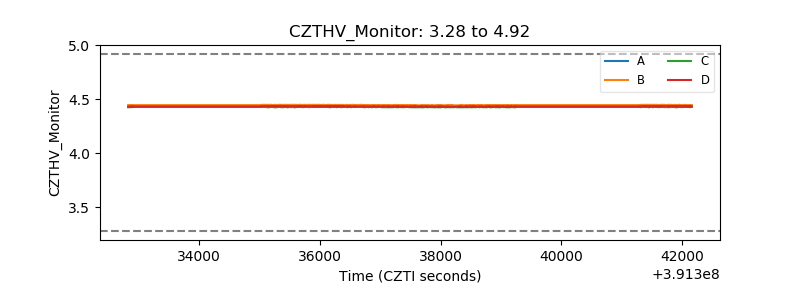 |
| D_VDD | 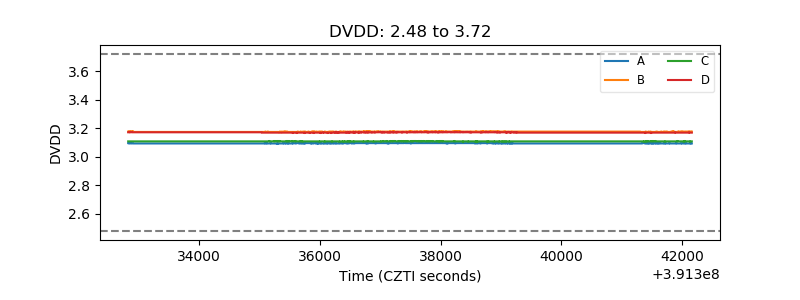 |
| Temperature 1 | 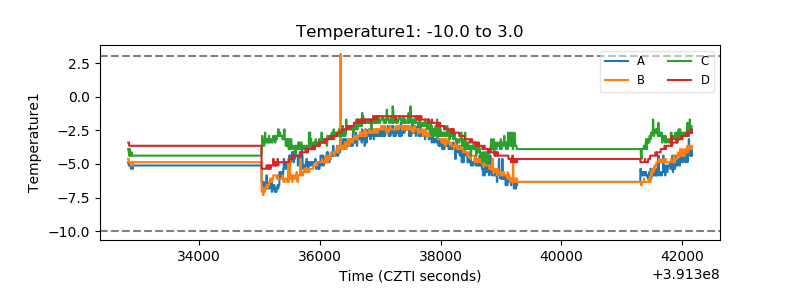 |
| Veto HV Monitor | 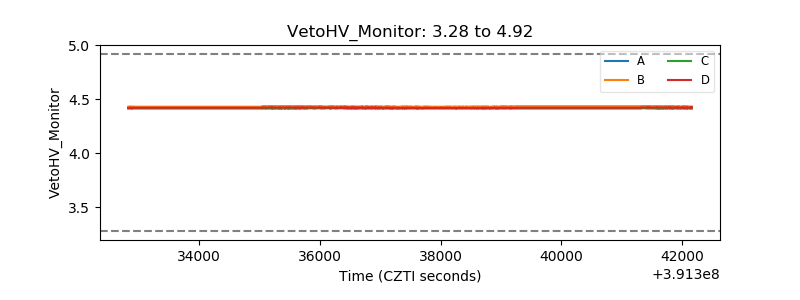 |
| Veto LLD | 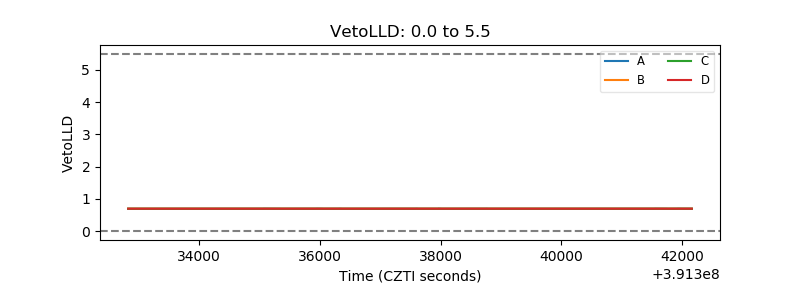 |
| Alpha Counter | 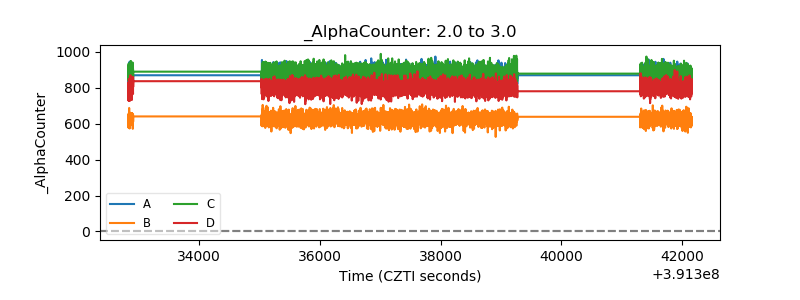 |
| _CPM_Rate | 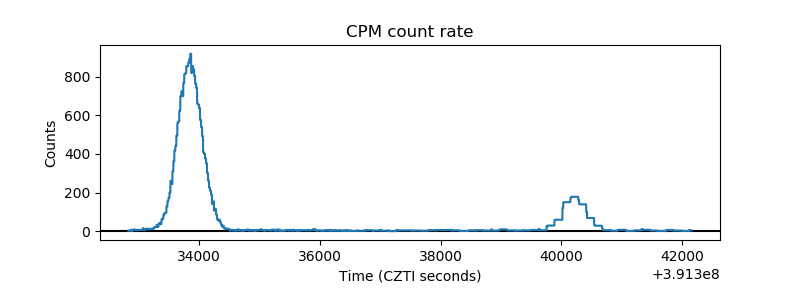 |
| CZT Counter | 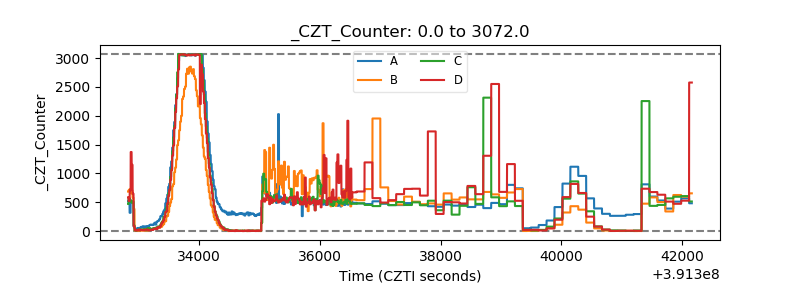 |
| +2.5 Volts monitor |  |
| +5 Volts monitor | 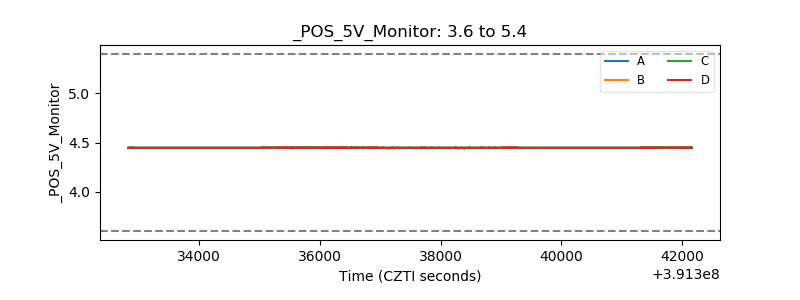 |
| _ROLL_ROT | 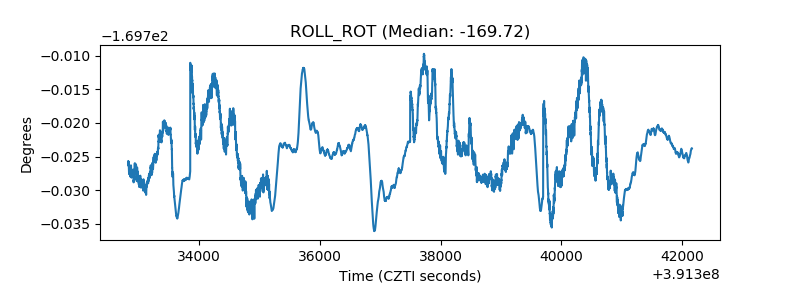 |
| _Roll_DEC | 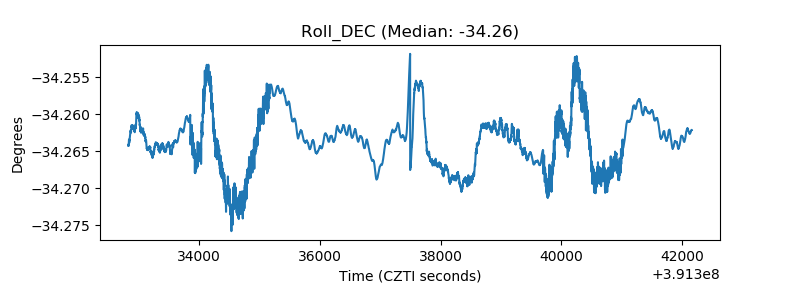 |
| _Roll_RA | 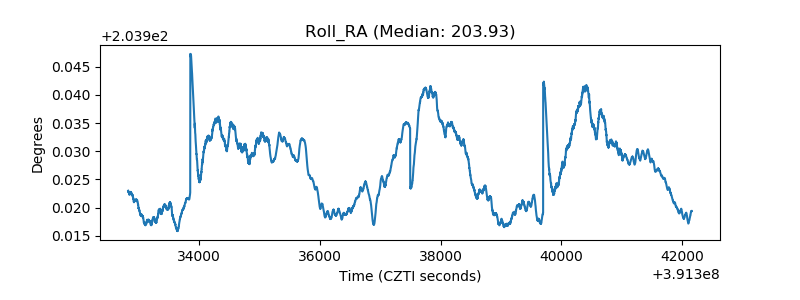 |
| Veto Counter | 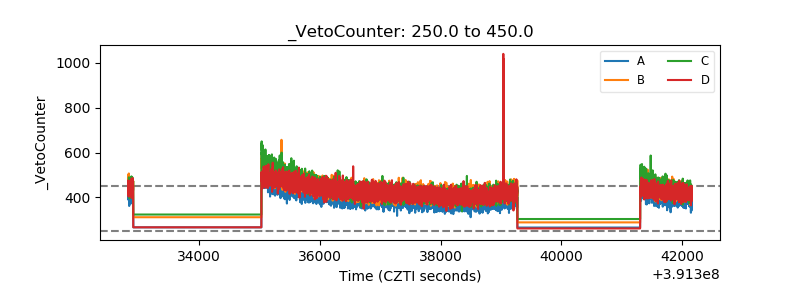 |