| Param | Original file | Final file |
|---|---|---|
| Filename | modeM0/AS1T04_069T01_9000005158_36027cztM0_level2.evt | modeM0/AS1T04_069T01_9000005158_36027cztM0_level2_quad_clean.evt |
| Size (bytes) | 450,604,800 | 60,238,080 |
| Size | 429.7 MB | 57.4 MB |
| Events in quadrant A | 2,541,817 | 381,019 |
| Events in quadrant B | 3,282,716 | 378,357 |
| Events in quadrant C | 3,153,173 | 367,117 |
| Events in quadrant D | 4,317,216 | 334,124 |
Noise dominated data is calculated using 1-second bins in cleaned event files. If a bin has >2000 counts, and if more than 50% of those come from <1% of pixels, then it is considered to be noise-dominated and hence unusable.
| Quadrant | # 1 sec bins | Bins with >0 counts | Bins with >2000 counts | High rate bins dominated by noise | Noise dominated (total time) | Noise dominated (detector-on time) | Marked lightcurve |
|---|---|---|---|---|---|---|---|
| A | 7062 | 5180 | 1 | 1 | 0.01% | 0.02% | 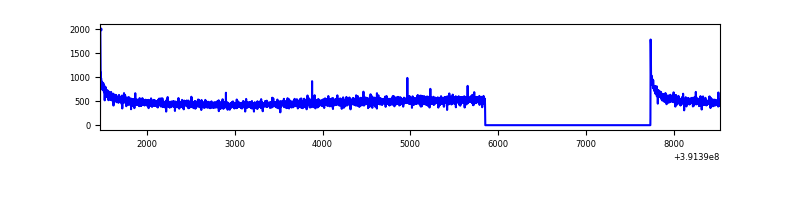 |
| B | 7062 | 5180 | 104 | 104 | 1.47% | 2.01% | 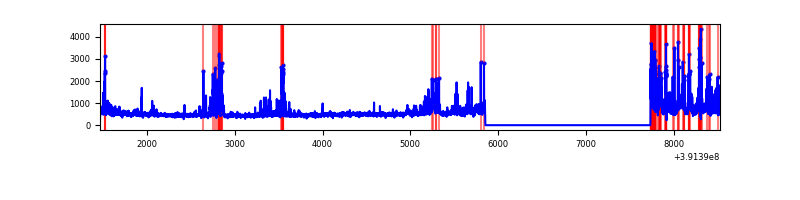 |
| C | 7062 | 5180 | 72 | 72 | 1.02% | 1.39% | 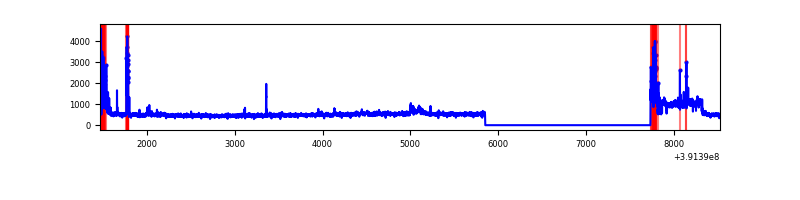 |
| D | 7062 | 5180 | 337 | 337 | 4.77% | 6.51% | 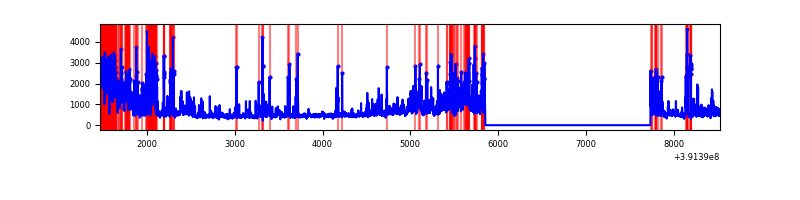 |
Top three noisy pixels from each quadrant. If the there are fewer than three noisy pixels in the level2.evt file, extra rows are filled as -1
| Pixel properties | Quadrant properties | ||||||
|---|---|---|---|---|---|---|---|
| Quadrant | DetID | PixID | Counts | Sigma | Mean | Median | Sigma |
| A | 10 | 83 | 160444 | 1280.31 | 614 | 604 | 124.8 |
| A | 13 | 254 | 7648 | 56.42 | 614 | 604 | 124.8 |
| A | 3 | 137 | 6453 | 46.85 | 614 | 604 | 124.8 |
| B | 5 | 236 | 365646 | 3137.87 | 608 | 592 | 116.3 |
| B | 5 | 172 | 241098 | 2067.3 | 608 | 592 | 116.3 |
| B | 4 | 171 | 101565 | 867.93 | 608 | 592 | 116.3 |
| C | 10 | 49 | 273180 | 1967.62 | 593 | 597 | 138.5 |
| C | 0 | 10 | 234273 | 1686.78 | 593 | 597 | 138.5 |
| C | 15 | 214 | 214228 | 1542.08 | 593 | 597 | 138.5 |
| D | 12 | 235 | 1000413 | 7080.81 | 579 | 563 | 141.2 |
| D | 12 | 227 | 516839 | 3656.2 | 579 | 563 | 141.2 |
| D | 10 | 118 | 260894 | 1843.63 | 579 | 563 | 141.2 |
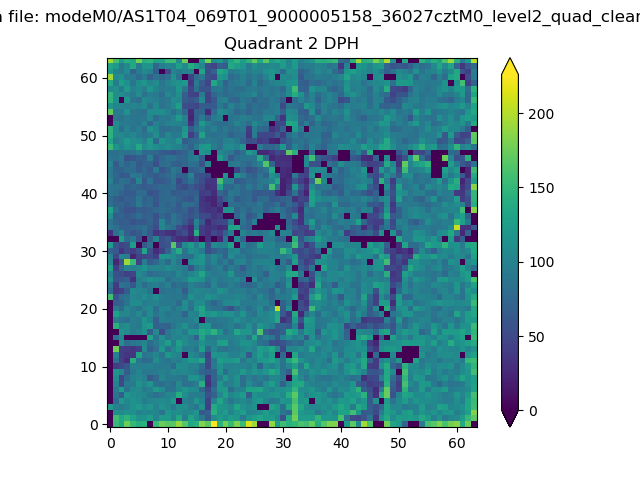
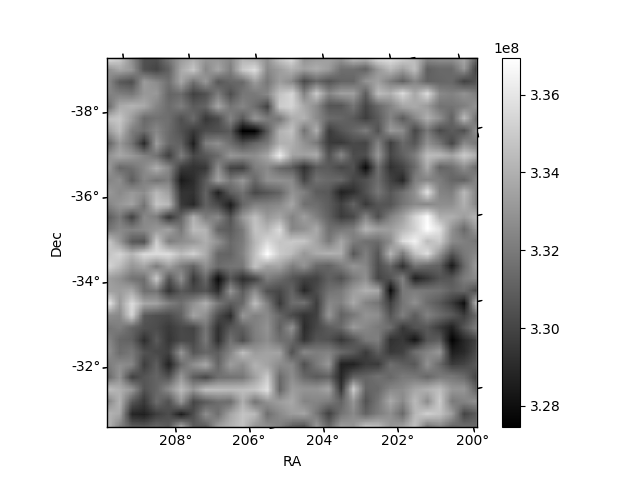
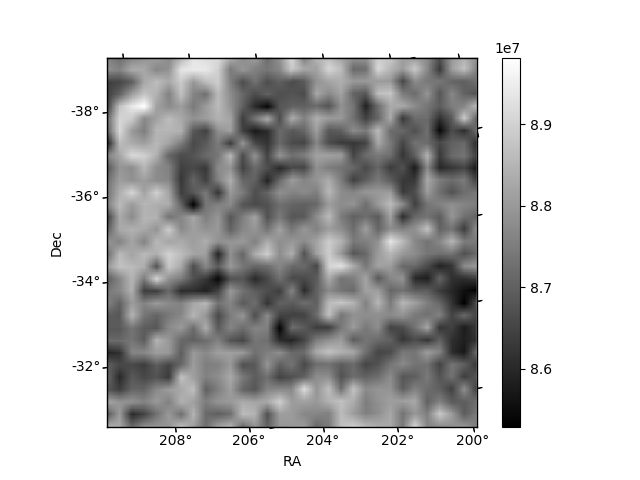
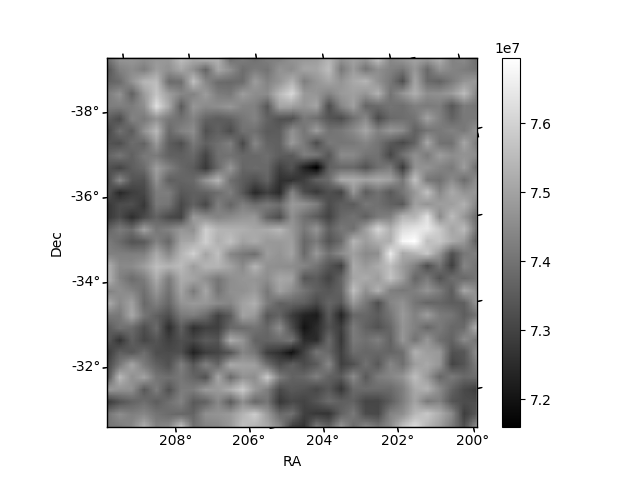
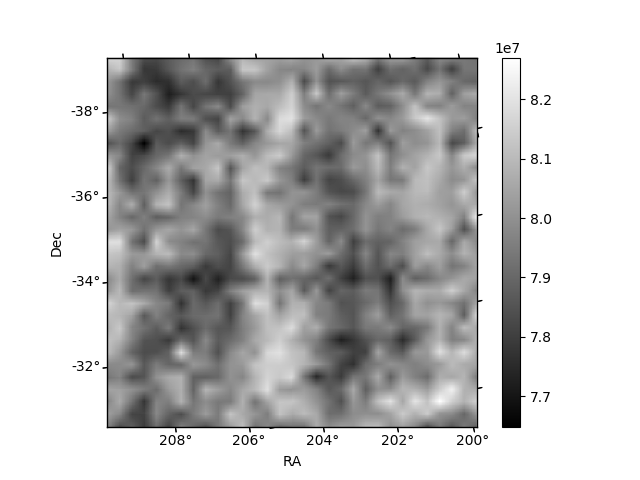
Histogram calculated using DETX and DETY for each event in the final _common_clean file
| Quadrant A | 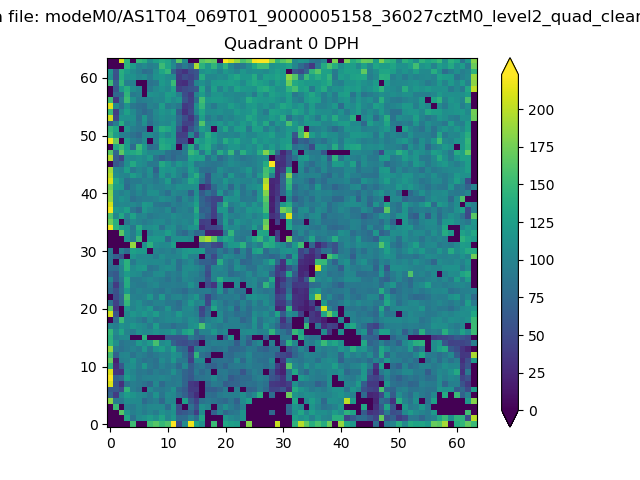 |
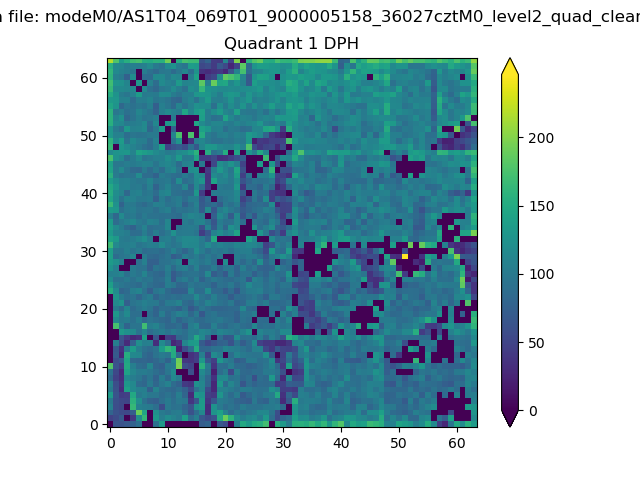 |
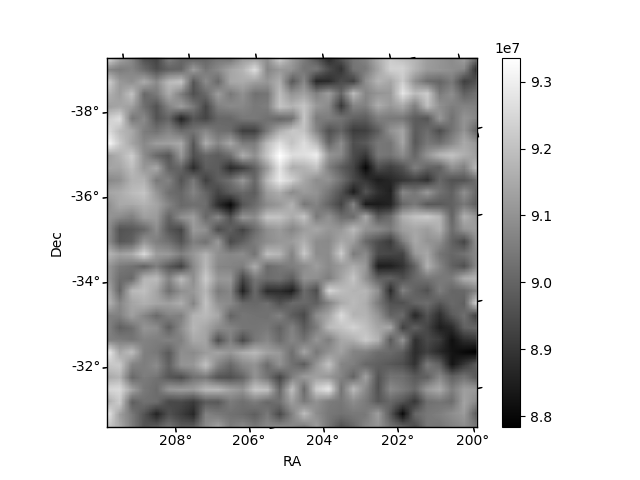
Quadrant B |
|---|---|---|---|
| Quadrant D | 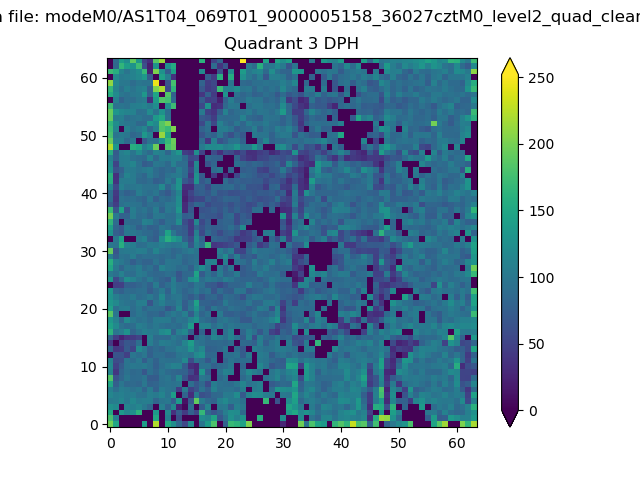 |
 |
Quadrant C |
| Plot type | Count rate plots | Images |
|---|---|---|
| Comparison with Poisson distribution Blue bars denote a histogram of data divided into 1 sec bins. Red curve is a Poisson curve with rate = median count rate of data. |
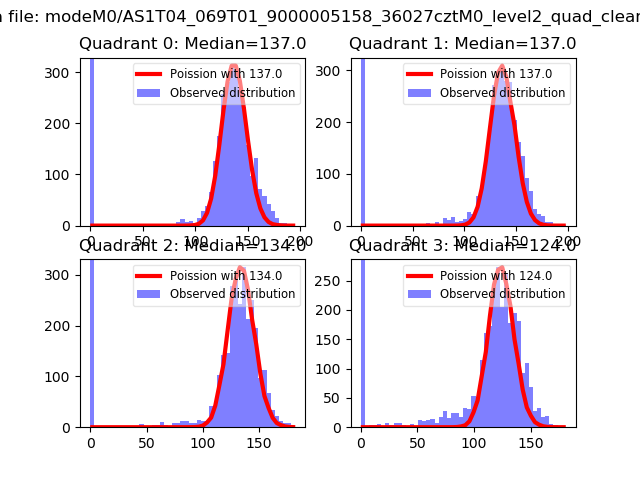 |
 |
| Quadrant-wise count rates Data is divided into 100 sec bins |
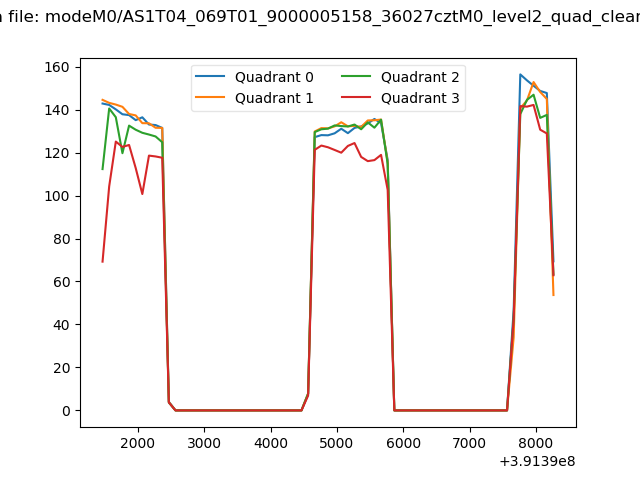 |
|
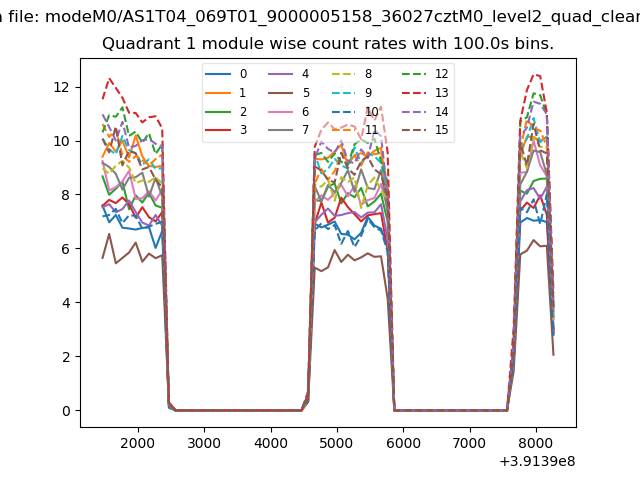
| Module-wise count rates for Quadrant A Data is divided into 100 sec bins |
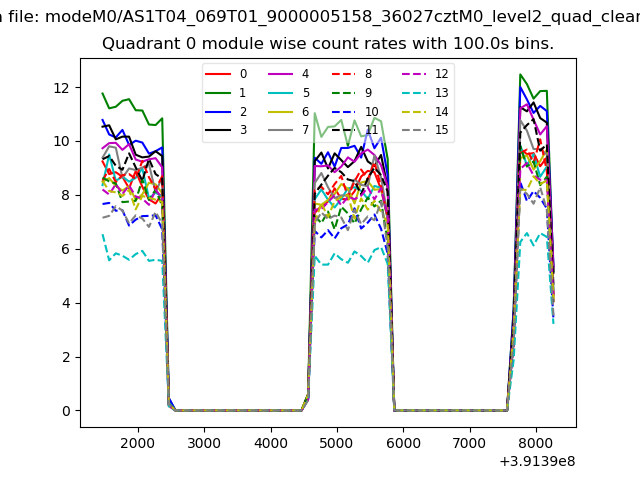 |
 |
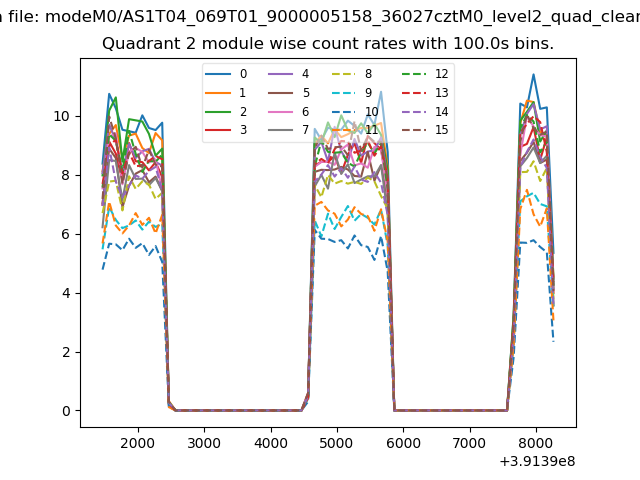
| Module-wise count rates for Quadrant B Data is divided into 100 sec bins |
 |
 |
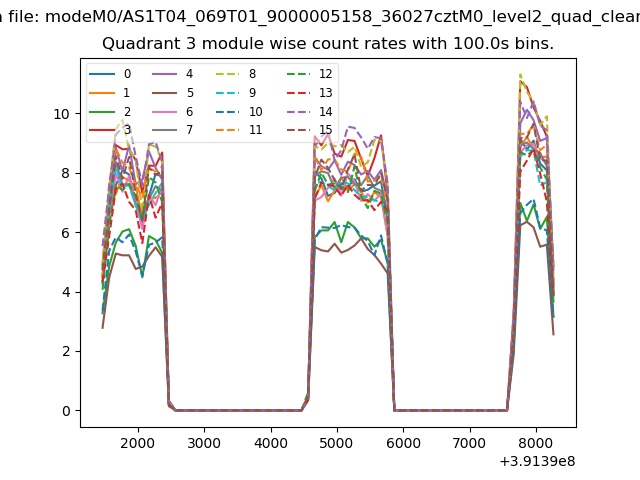
| Module-wise count rates for Quadrant C Data is divided into 100 sec bins |
 |
 |
| Module-wise count rates for Quadrant D Data is divided into 100 sec bins |
 |
 |
| Parameter | Plot |
|---|---|
| CZT HV Monitor |  |
| D_VDD | 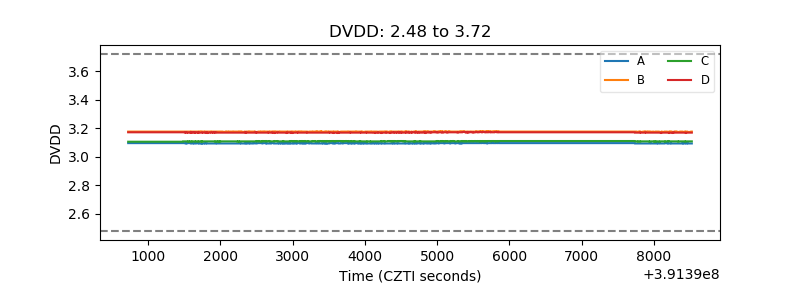 |
| Temperature 1 | 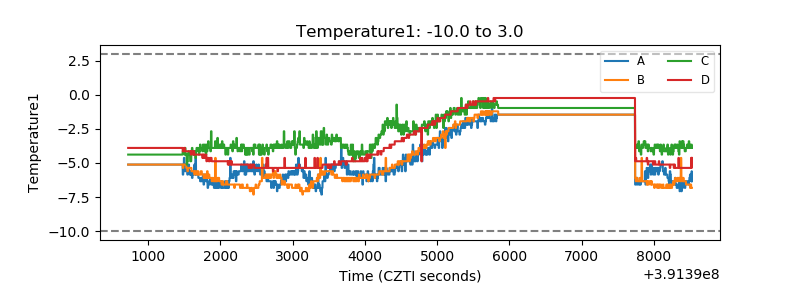 |
| Veto HV Monitor | 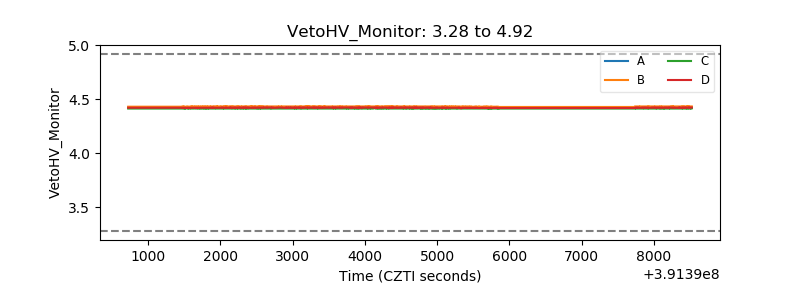 |
| Veto LLD | 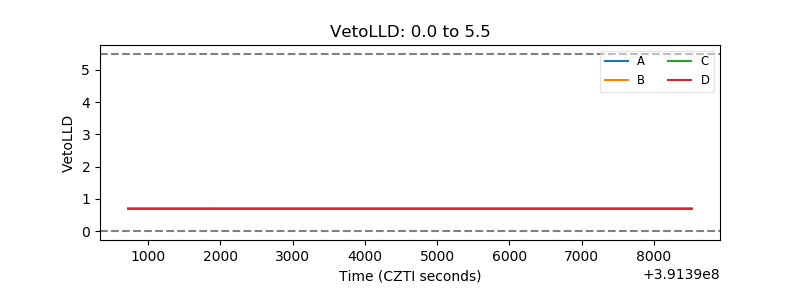 |
| Alpha Counter | 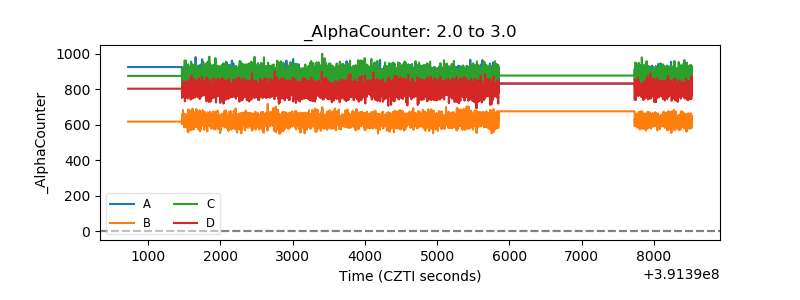 |
| _CPM_Rate | 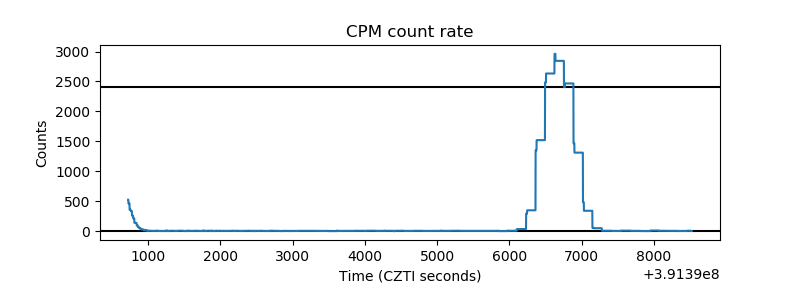 |
| CZT Counter | 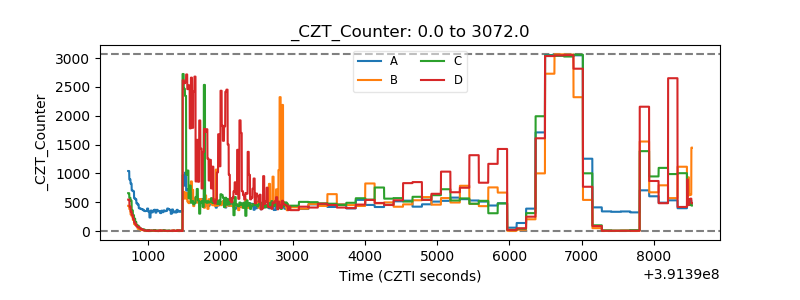 |
| +2.5 Volts monitor |  |
| +5 Volts monitor |  |
| _ROLL_ROT | 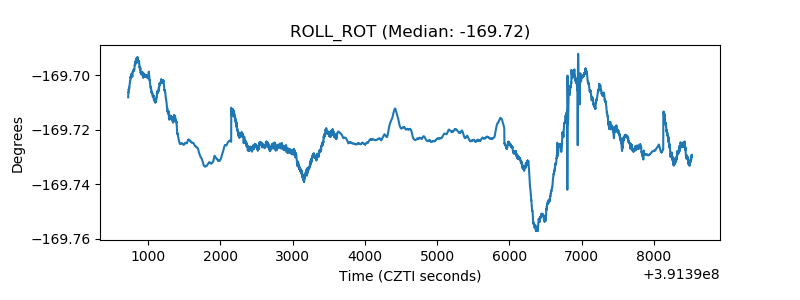 |
| _Roll_DEC | 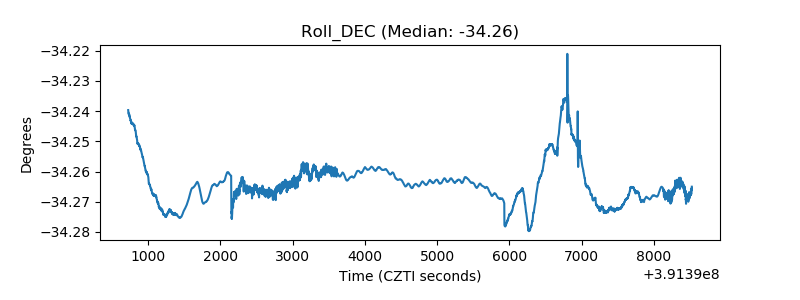 |
| _Roll_RA | 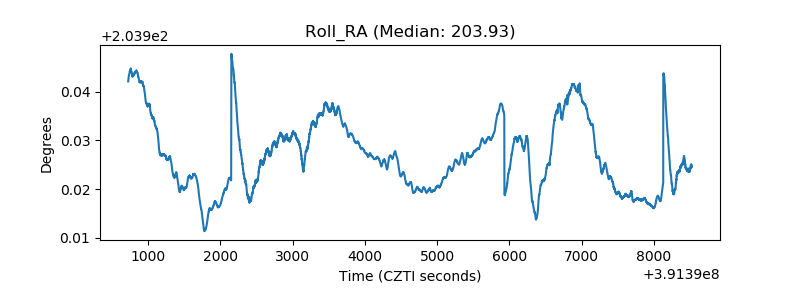 |
| Veto Counter | 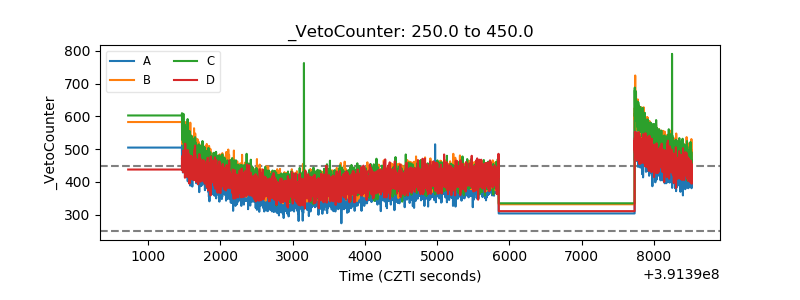 |