| Param | Original file | Final file |
|---|---|---|
| Filename | modeM0/AS1T04_069T01_9000005158_36028cztM0_level2.evt | modeM0/AS1T04_069T01_9000005158_36028cztM0_level2_quad_clean.evt |
| Size (bytes) | 446,927,040 | 53,605,440 |
| Size | 426.2 MB | 51.1 MB |
| Events in quadrant A | 2,681,521 | 323,152 |
| Events in quadrant B | 3,823,631 | 314,559 |
| Events in quadrant C | 3,423,204 | 314,658 |
| Events in quadrant D | 3,247,807 | 299,869 |
Noise dominated data is calculated using 1-second bins in cleaned event files. If a bin has >2000 counts, and if more than 50% of those come from <1% of pixels, then it is considered to be noise-dominated and hence unusable.
| Quadrant | # 1 sec bins | Bins with >0 counts | Bins with >2000 counts | High rate bins dominated by noise | Noise dominated (total time) | Noise dominated (detector-on time) | Marked lightcurve |
|---|---|---|---|---|---|---|---|
| A | 9176 | 5292 | 1 | 1 | 0.01% | 0.02% | 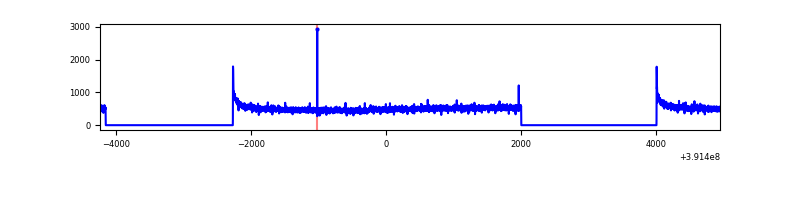 |
| B | 9176 | 5291 | 189 | 189 | 2.06% | 3.57% | 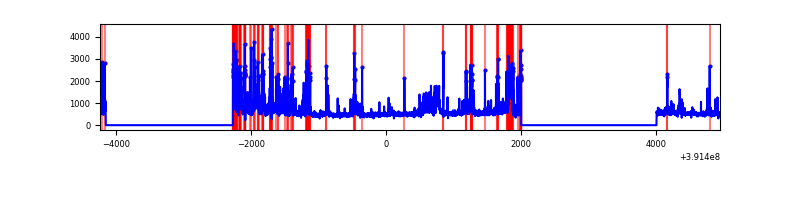 |
| C | 9176 | 5292 | 83 | 83 | 0.90% | 1.57% | 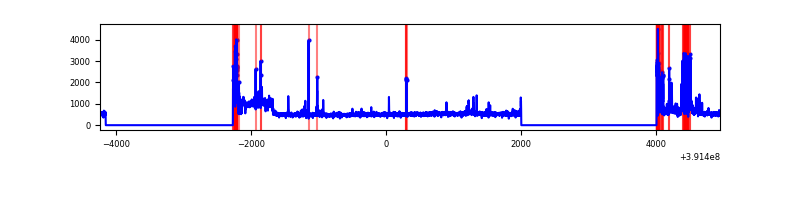 |
| D | 9176 | 5292 | 107 | 107 | 1.17% | 2.02% | 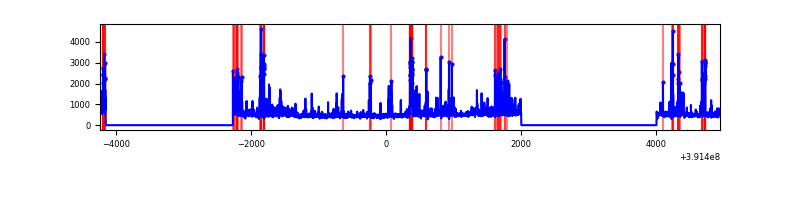 |
Top three noisy pixels from each quadrant. If the there are fewer than three noisy pixels in the level2.evt file, extra rows are filled as -1
| Pixel properties | Quadrant properties | ||||||
|---|---|---|---|---|---|---|---|
| Quadrant | DetID | PixID | Counts | Sigma | Mean | Median | Sigma |
| A | 10 | 83 | 165975 | 1261.25 | 648 | 637 | 131.1 |
| A | 13 | 254 | 8205 | 57.73 | 648 | 637 | 131.1 |
| A | 3 | 137 | 6546 | 45.08 | 648 | 637 | 131.1 |
| B | 5 | 236 | 583811 | 4818.33 | 637 | 620 | 121.0 |
| B | 5 | 172 | 251313 | 2071.23 | 637 | 620 | 121.0 |
| B | 5 | 255 | 244272 | 2013.06 | 637 | 620 | 121.0 |
| C | 10 | 49 | 271242 | 1872.81 | 627 | 631 | 144.5 |
| C | 9 | 187 | 233265 | 1609.99 | 627 | 631 | 144.5 |
| C | 15 | 214 | 219361 | 1513.76 | 627 | 631 | 144.5 |
| D | 12 | 17 | 219748 | 1444.97 | 624 | 608 | 151.7 |
| D | 12 | 235 | 152701 | 1002.87 | 624 | 608 | 151.7 |
| D | 10 | 118 | 128751 | 844.95 | 624 | 608 | 151.7 |
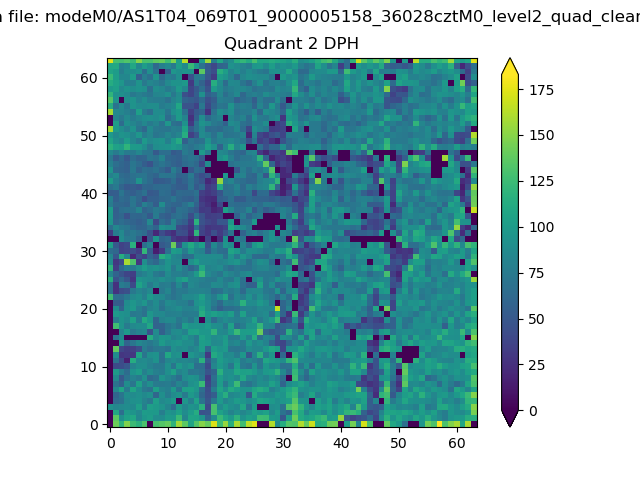
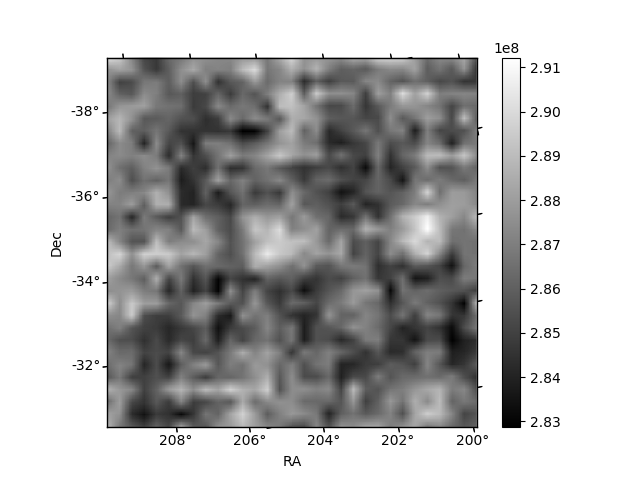
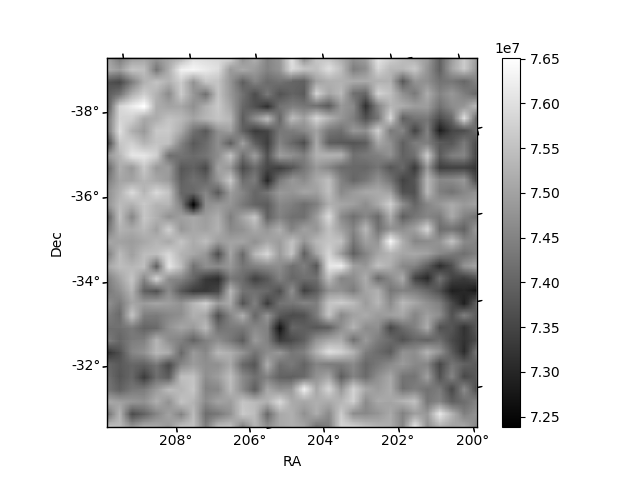
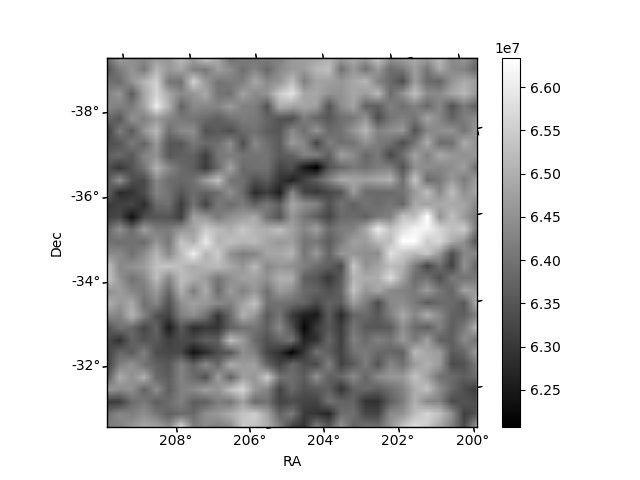
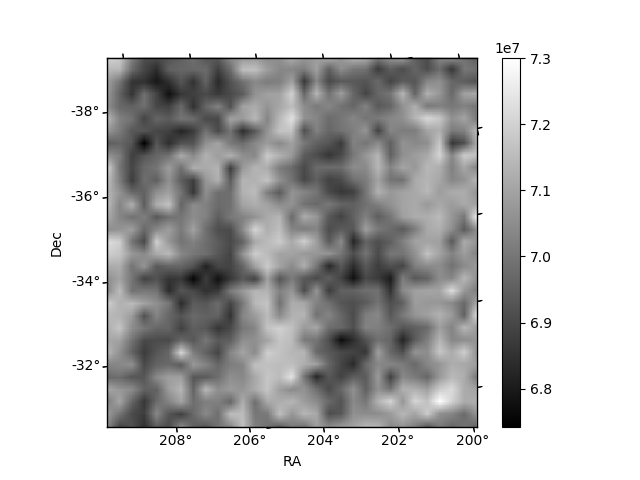
Histogram calculated using DETX and DETY for each event in the final _common_clean file
| Quadrant A | 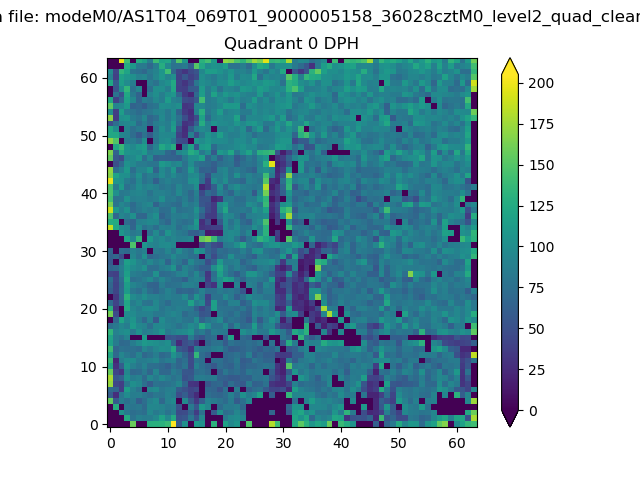 |
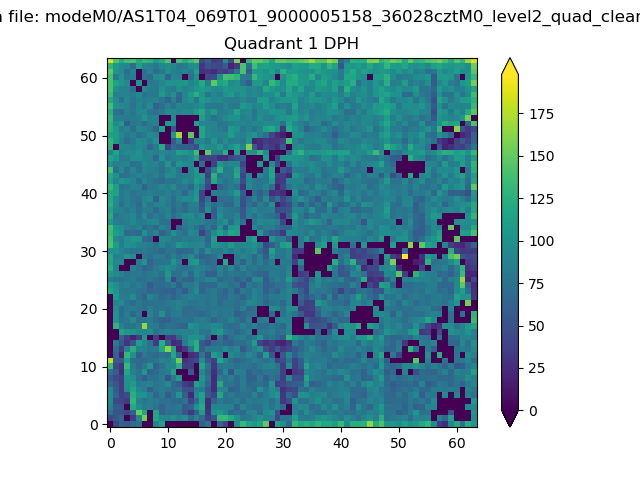 |
Quadrant B |
|---|---|---|---|
| Quadrant D | 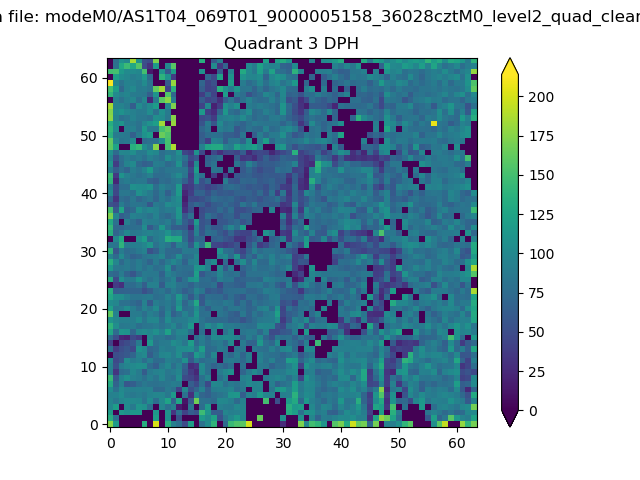 |
 |
Quadrant C |
| Plot type | Count rate plots | Images |
|---|---|---|
| Comparison with Poisson distribution Blue bars denote a histogram of data divided into 1 sec bins. Red curve is a Poisson curve with rate = median count rate of data. |
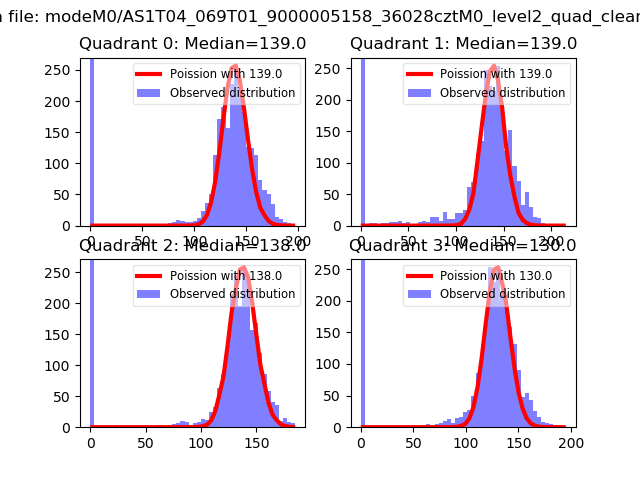 |
 |
| Quadrant-wise count rates Data is divided into 100 sec bins |
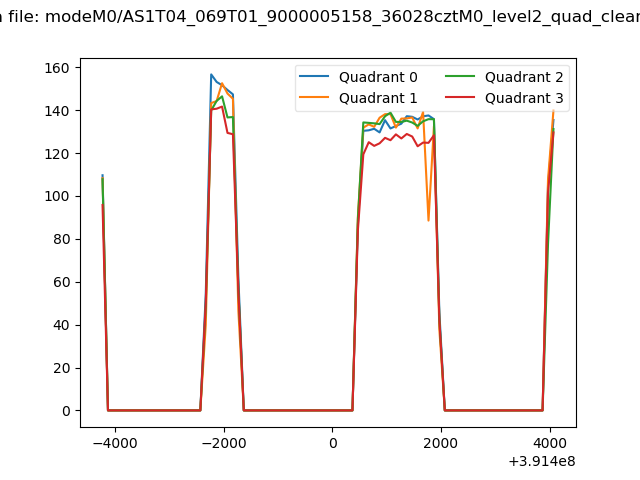 |
|
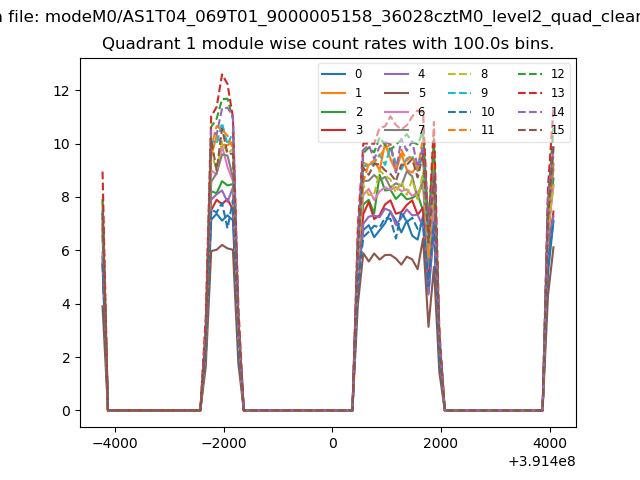
| Module-wise count rates for Quadrant A Data is divided into 100 sec bins |
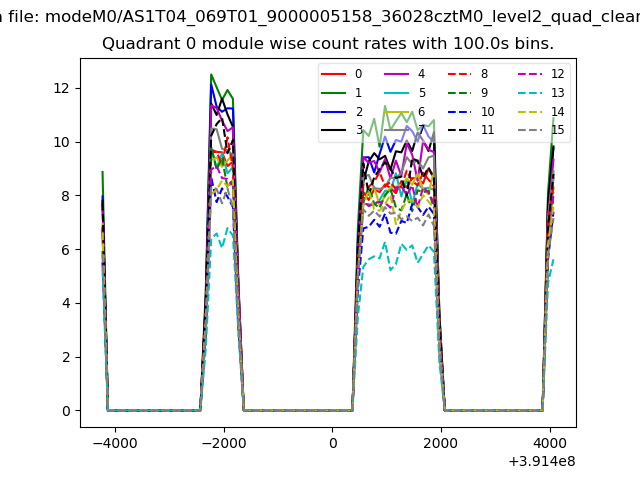 |
 |
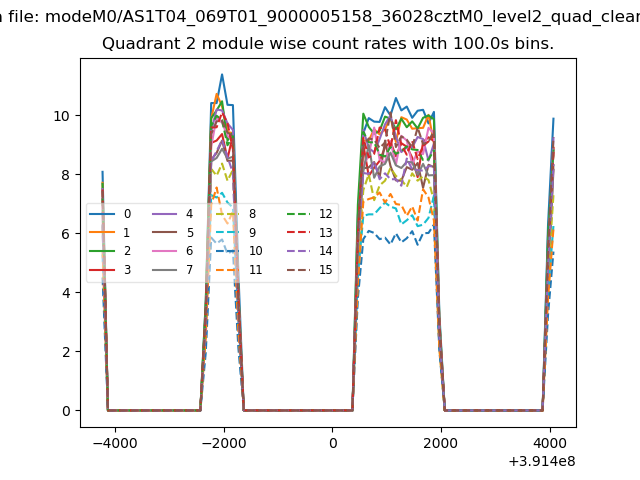
| Module-wise count rates for Quadrant B Data is divided into 100 sec bins |
 |
 |
| Module-wise count rates for Quadrant C Data is divided into 100 sec bins |
 |
 |
| Module-wise count rates for Quadrant D Data is divided into 100 sec bins |
 |
 |
| Parameter | Plot |
|---|---|
| CZT HV Monitor |  |
| D_VDD | 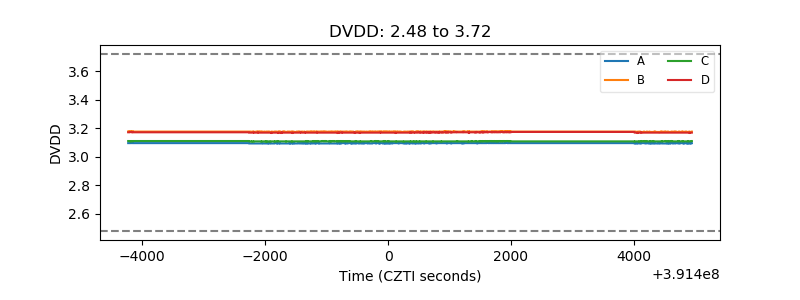 |
| Temperature 1 |  |
| Veto HV Monitor | 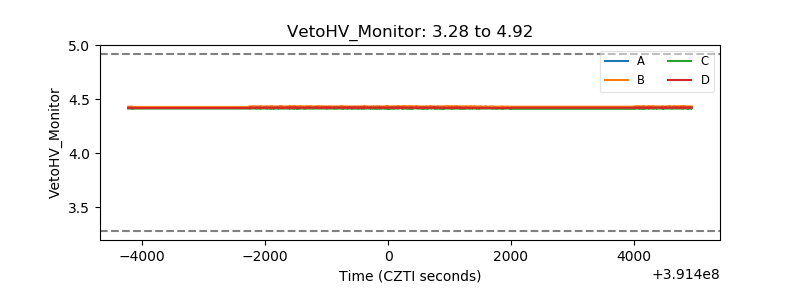 |
| Veto LLD | 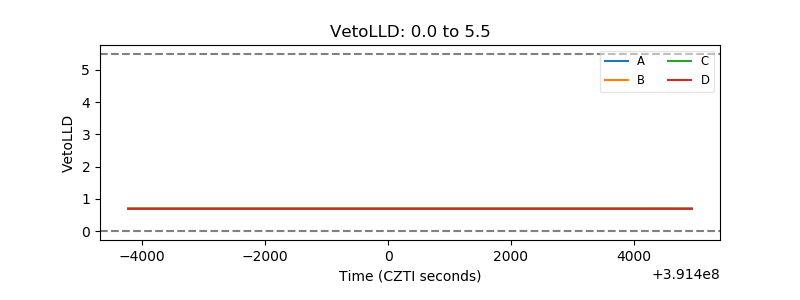 |
| Alpha Counter | 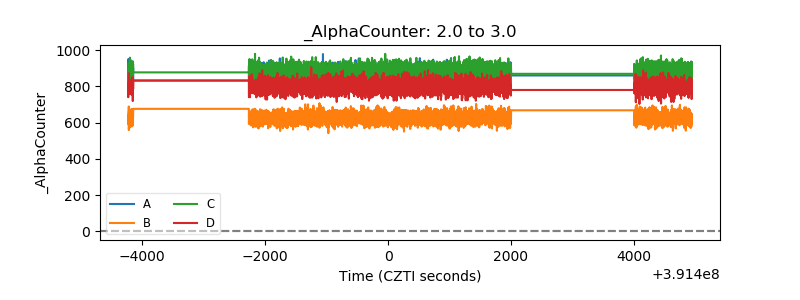 |
| _CPM_Rate | 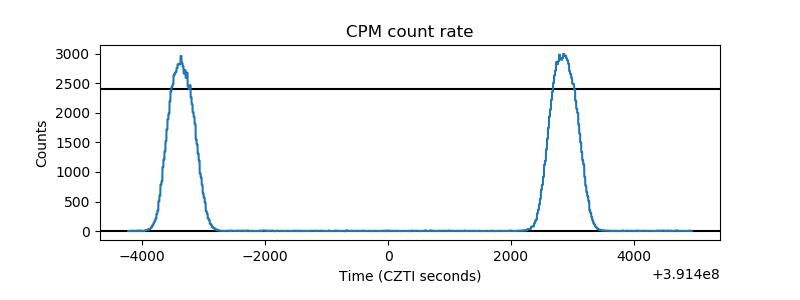 |
| CZT Counter | 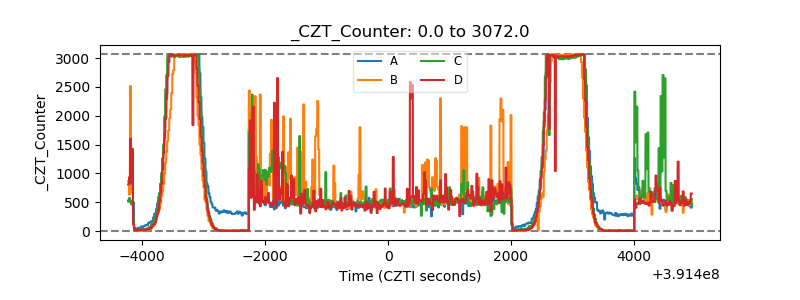 |
| +2.5 Volts monitor |  |
| +5 Volts monitor |  |
| _ROLL_ROT | 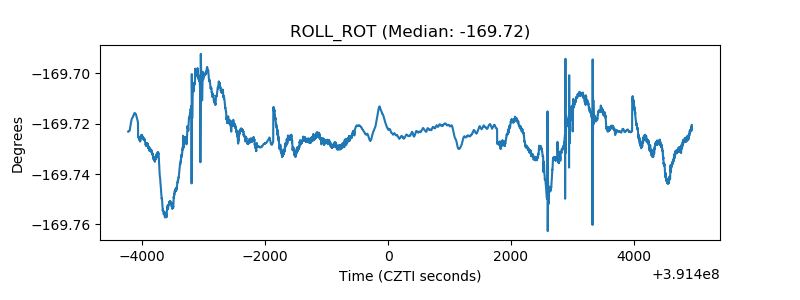 |
| _Roll_DEC | 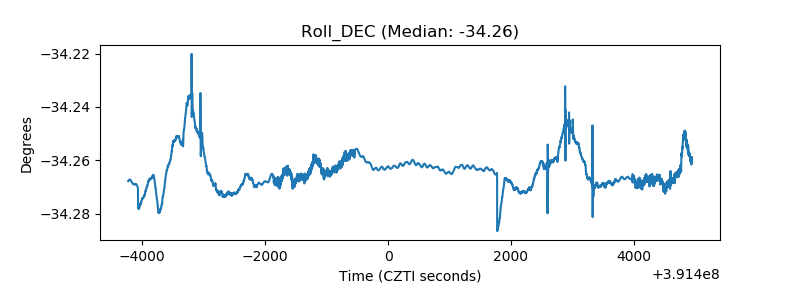 |
| _Roll_RA | 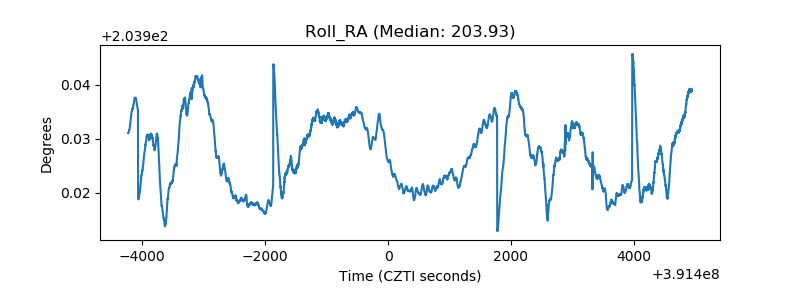 |
| Veto Counter |  |