| Param | Original file | Final file |
|---|---|---|
| Filename | modeM0/AS1T04_069T01_9000005158_36029cztM0_level2.evt | modeM0/AS1T04_069T01_9000005158_36029cztM0_level2_quad_clean.evt |
| Size (bytes) | 436,654,080 | 47,511,360 |
| Size | 416.4 MB | 45.3 MB |
| Events in quadrant A | 2,640,158 | 276,692 |
| Events in quadrant B | 3,047,023 | 274,059 |
| Events in quadrant C | 3,350,025 | 273,200 |
| Events in quadrant D | 3,842,034 | 258,075 |
Noise dominated data is calculated using 1-second bins in cleaned event files. If a bin has >2000 counts, and if more than 50% of those come from <1% of pixels, then it is considered to be noise-dominated and hence unusable.
| Quadrant | # 1 sec bins | Bins with >0 counts | Bins with >2000 counts | High rate bins dominated by noise | Noise dominated (total time) | Noise dominated (detector-on time) | Marked lightcurve |
|---|---|---|---|---|---|---|---|
| A | 7169 | 5078 | 0 | 0 | 0.00% | 0.00% | 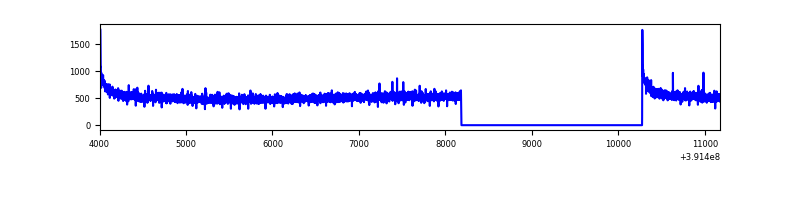 |
| B | 7169 | 5078 | 92 | 92 | 1.28% | 1.81% | 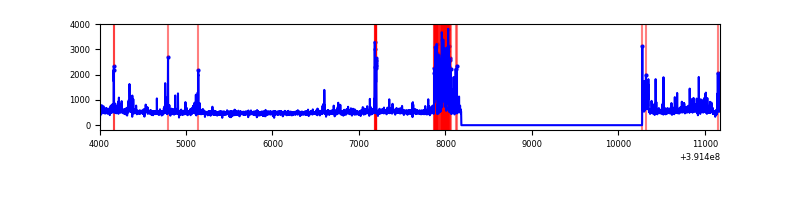 |
| C | 7169 | 5078 | 135 | 135 | 1.88% | 2.66% |  |
| D | 7169 | 5078 | 229 | 229 | 3.19% | 4.51% | 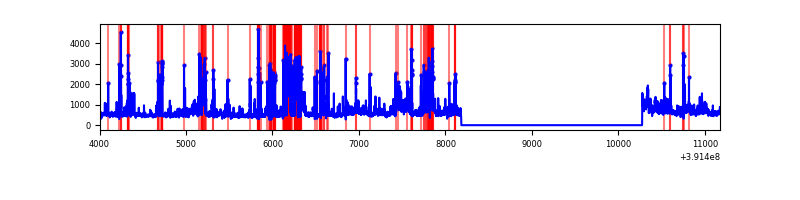 |
Top three noisy pixels from each quadrant. If the there are fewer than three noisy pixels in the level2.evt file, extra rows are filled as -1
| Pixel properties | Quadrant properties | ||||||
|---|---|---|---|---|---|---|---|
| Quadrant | DetID | PixID | Counts | Sigma | Mean | Median | Sigma |
| A | 10 | 83 | 163567 | 1280.54 | 636 | 624 | 127.2 |
| A | 13 | 254 | 7805 | 56.43 | 636 | 624 | 127.2 |
| A | 8 | 144 | 7454 | 53.68 | 636 | 624 | 127.2 |
| B | 5 | 236 | 212536 | 1792.67 | 629 | 614 | 118.2 |
| B | 5 | 255 | 112969 | 950.42 | 629 | 614 | 118.2 |
| B | 5 | 172 | 91420 | 768.14 | 629 | 614 | 118.2 |
| C | 9 | 187 | 524960 | 3706.28 | 615 | 620 | 141.5 |
| C | 0 | 10 | 211128 | 1487.97 | 615 | 620 | 141.5 |
| C | 15 | 214 | 210131 | 1480.92 | 615 | 620 | 141.5 |
| D | 13 | 249 | 653832 | 4458.14 | 606 | 591 | 146.5 |
| D | 12 | 227 | 461647 | 3146.54 | 606 | 591 | 146.5 |
| D | 12 | 233 | 88256 | 598.28 | 606 | 591 | 146.5 |
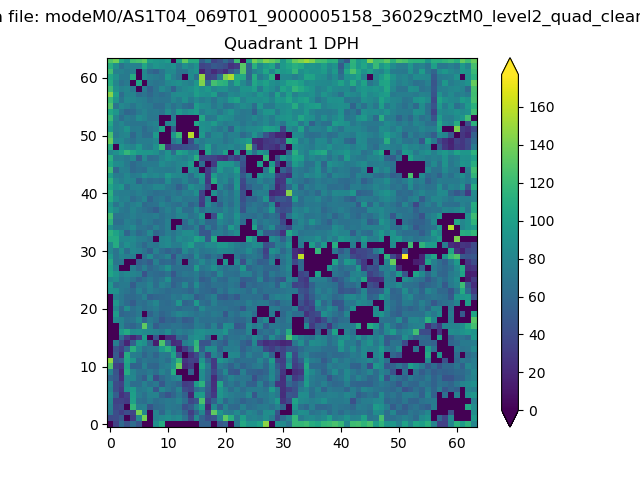
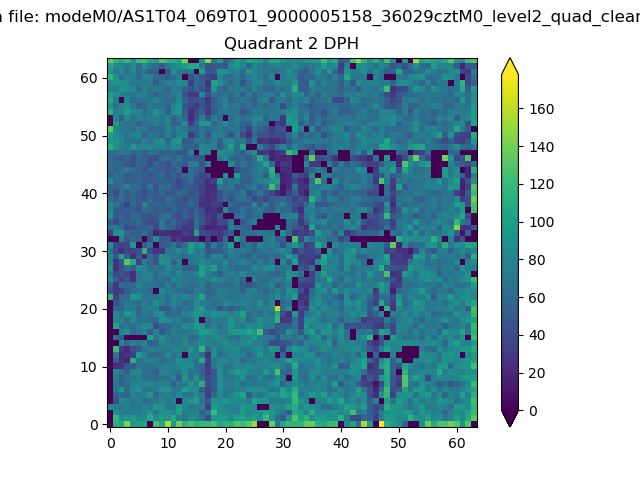
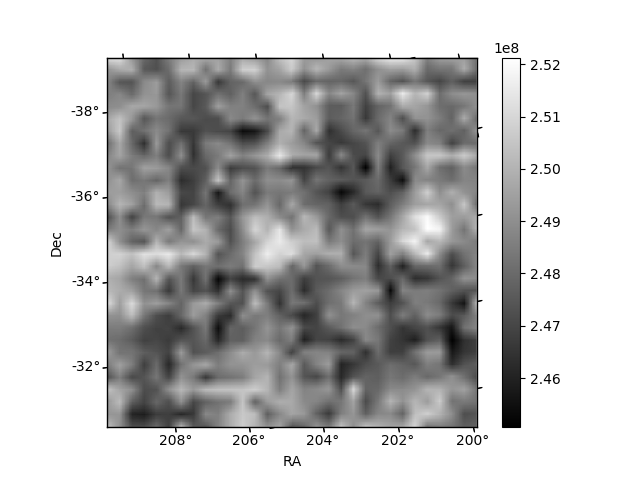
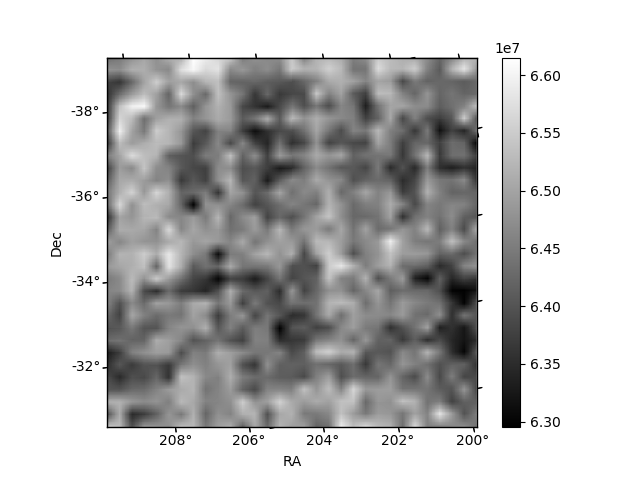
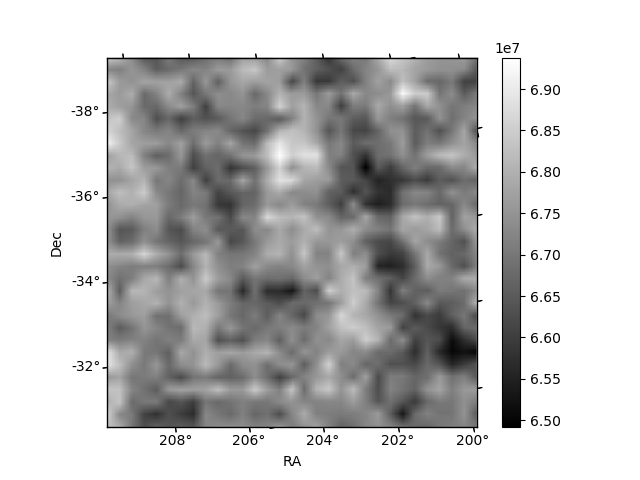
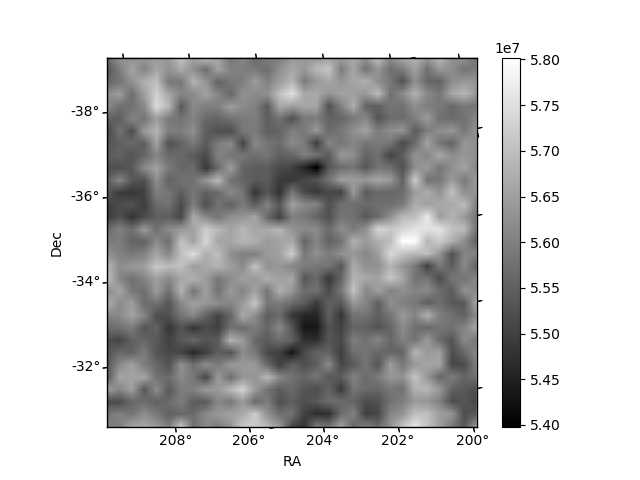
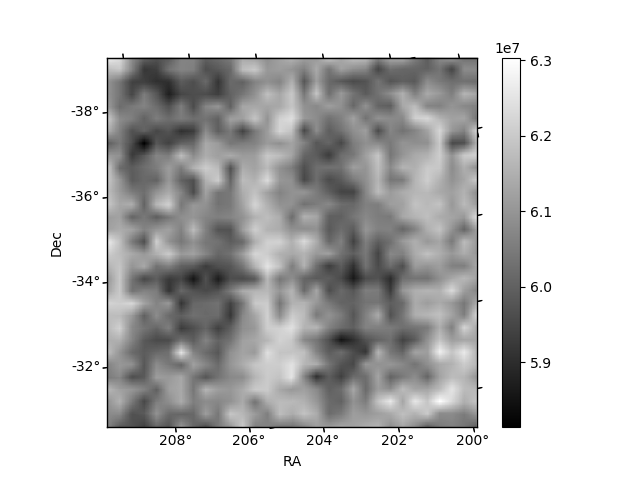
Histogram calculated using DETX and DETY for each event in the final _common_clean file
| Quadrant A | 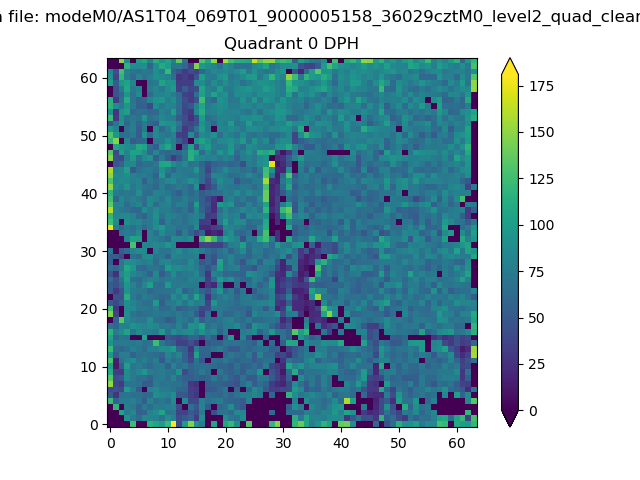 |
 |
Quadrant B |
|---|---|---|---|
| Quadrant D | 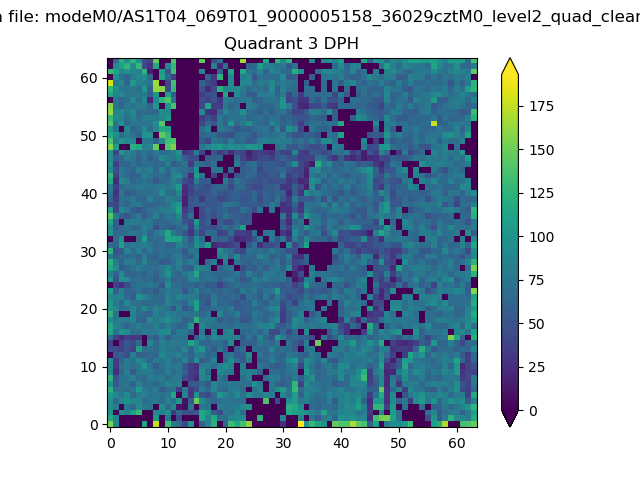 |
 |
Quadrant C |
| Plot type | Count rate plots | Images |
|---|---|---|
| Comparison with Poisson distribution Blue bars denote a histogram of data divided into 1 sec bins. Red curve is a Poisson curve with rate = median count rate of data. |
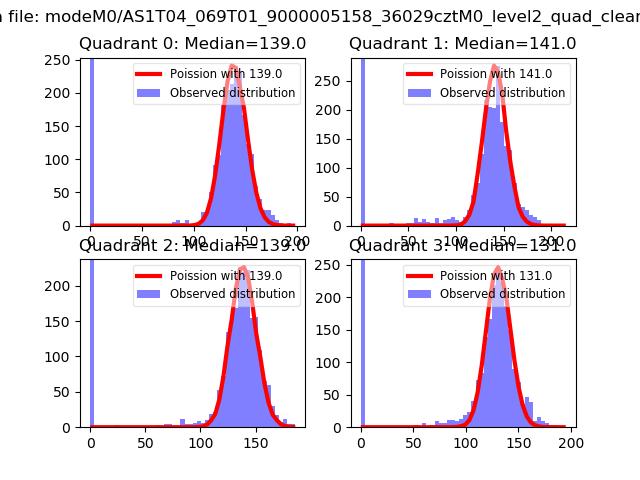 |
 |
| Quadrant-wise count rates Data is divided into 100 sec bins |
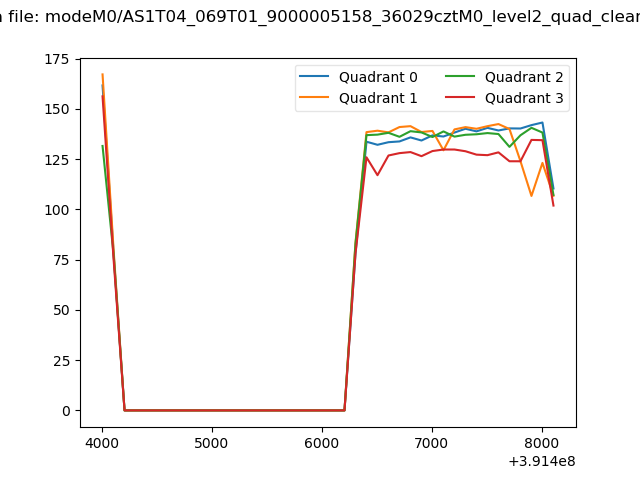 |
|
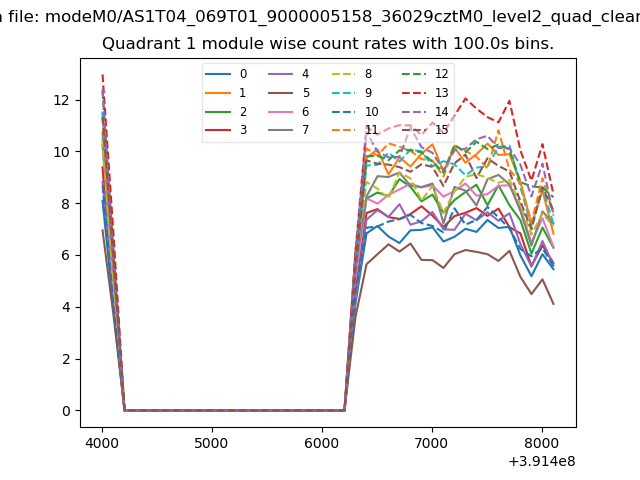
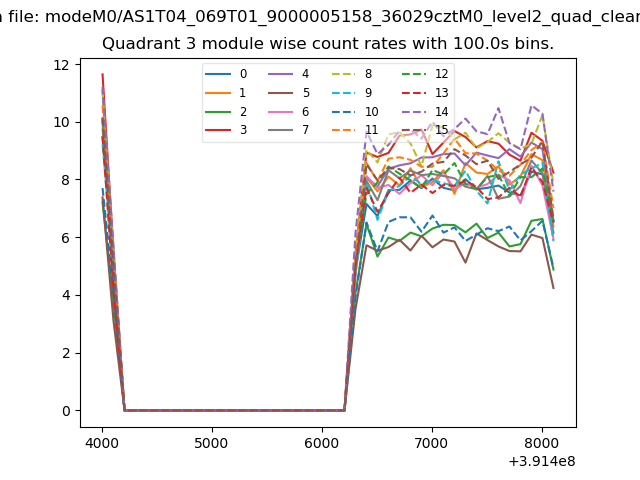
| Module-wise count rates for Quadrant A Data is divided into 100 sec bins |
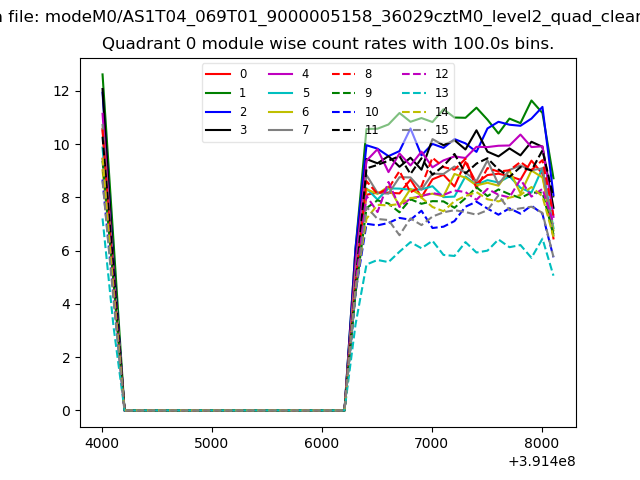 |
 |
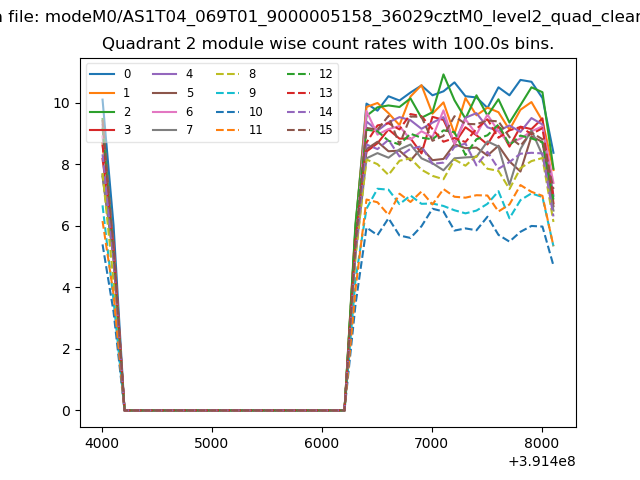
| Module-wise count rates for Quadrant B Data is divided into 100 sec bins |
 |
 |
| Module-wise count rates for Quadrant C Data is divided into 100 sec bins |
 |
 |
| Module-wise count rates for Quadrant D Data is divided into 100 sec bins |
 |
 |
| Parameter | Plot |
|---|---|
| CZT HV Monitor | 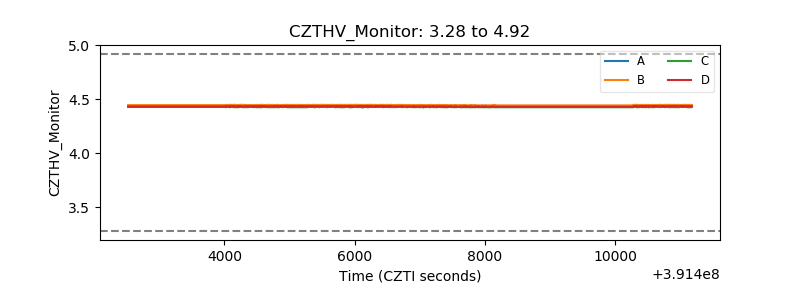 |
| D_VDD | 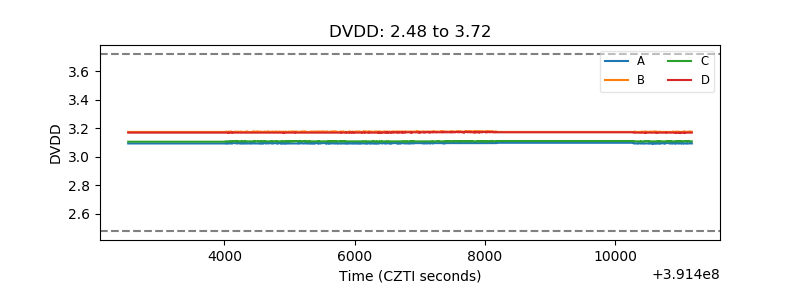 |
| Temperature 1 |  |
| Veto HV Monitor | 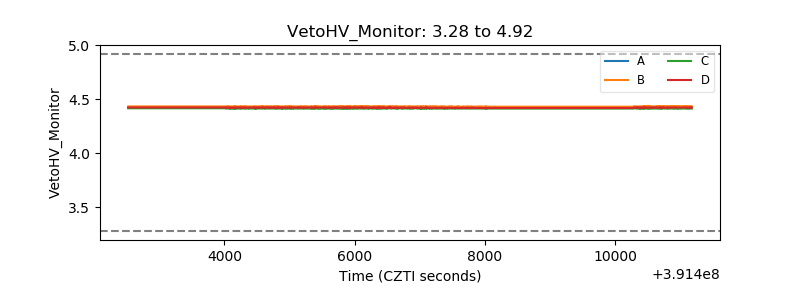 |
| Veto LLD | 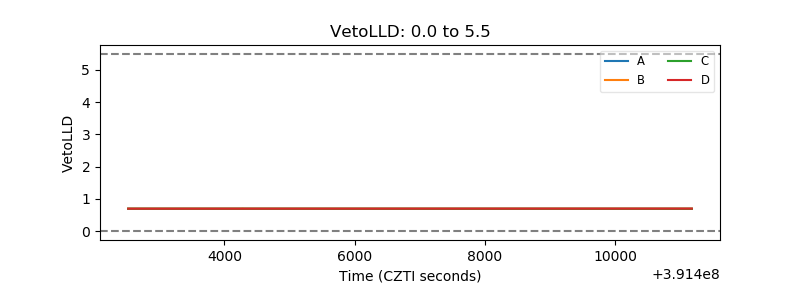 |
| Alpha Counter | 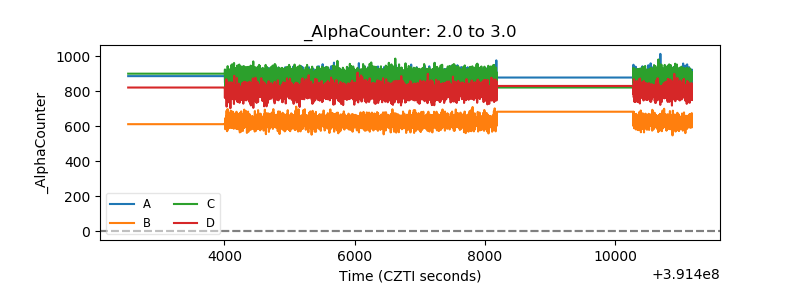 |
| _CPM_Rate | 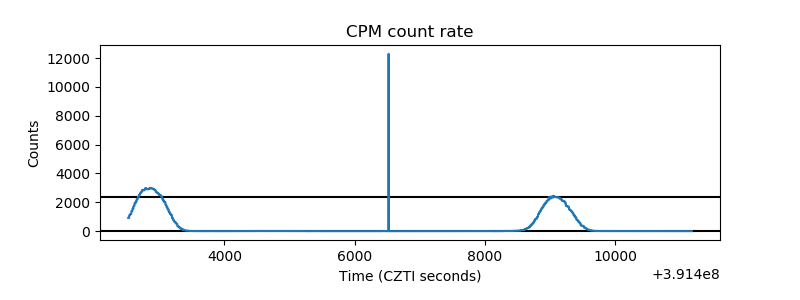 |
| CZT Counter | 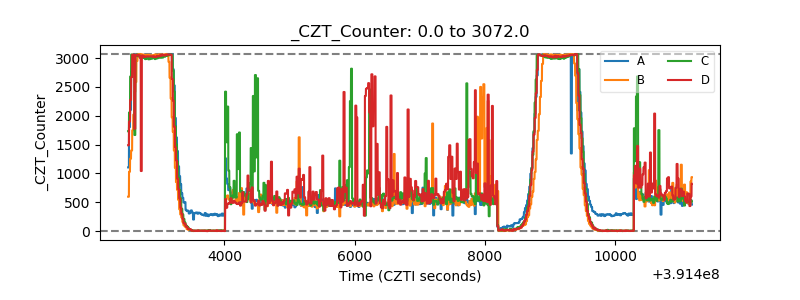 |
| +2.5 Volts monitor |  |
| +5 Volts monitor |  |
| _ROLL_ROT |  |
| _Roll_DEC |  |
| _Roll_RA | 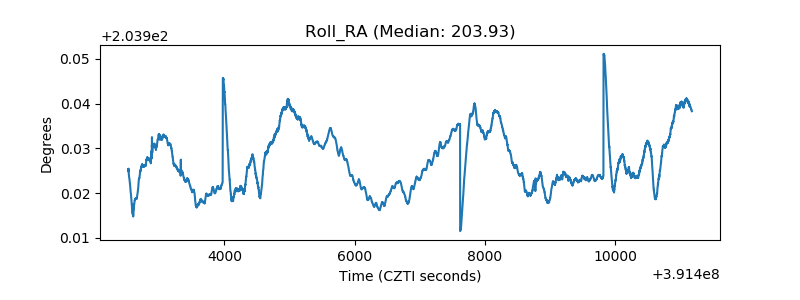 |
| Veto Counter | 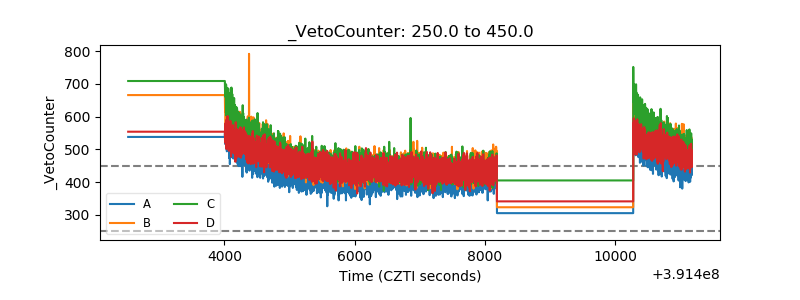 |