| Param | Original file | Final file |
|---|---|---|
| Filename | modeM0/AS1T04_069T01_9000005158_36033cztM0_level2.evt | modeM0/AS1T04_069T01_9000005158_36033cztM0_level2_quad_clean.evt |
| Size (bytes) | 463,435,200 | 83,715,840 |
| Size | 442.0 MB | 79.8 MB |
| Events in quadrant A | 2,713,937 | 552,300 |
| Events in quadrant B | 3,555,147 | 542,023 |
| Events in quadrant C | 3,963,615 | 533,546 |
| Events in quadrant D | 3,420,006 | 513,316 |
| Mode M0 | |||
|---|---|---|---|
| Quadrant | BADHDUFLAG | Total packets | Discarded packets |
| A | 0 | 11585 | 3 |
| B | 0 | 14106 | 2 |
| C | 0 | 15284 | 2 |
| D | 0 | 13738 | 2 |
| Mode M9 | |||
|---|---|---|---|
| Quadrant | BADHDUFLAG | Total packets | Discarded packets |
| A | 0 | 35 | 0 |
| B | 0 | 35 | 0 |
| C | 0 | 35 | 0 |
| D | 0 | 35 | 0 |
| Mode SS | |||
|---|---|---|---|
| Quadrant | BADHDUFLAG | Total packets | Discarded packets |
| A | 0 | 116 | 0 |
| B | 0 | 116 | 0 |
| C | 0 | 116 | 0 |
| D | 0 | 116 | 0 |
| Quadrant | Total seconds | Saturated seconds | Saturation percentage |
|---|---|---|---|
| A | 5634 | 5 | 0.088747% |
| B | 5634 | 242 | 4.295350% |
| C | 5634 | 277 | 4.916578% |
| D | 5634 | 136 | 2.413916% |
Noise dominated data is calculated using 1-second bins in cleaned event files. If a bin has >2000 counts, and if more than 50% of those come from <1% of pixels, then it is considered to be noise-dominated and hence unusable.
| Quadrant | # 1 sec bins | Bins with >0 counts | Bins with >2000 counts | High rate bins dominated by noise | Noise dominated (total time) | Noise dominated (detector-on time) | Marked lightcurve |
|---|---|---|---|---|---|---|---|
| A | 9130 | 5636 | 0 | 0 | 0.00% | 0.00% | 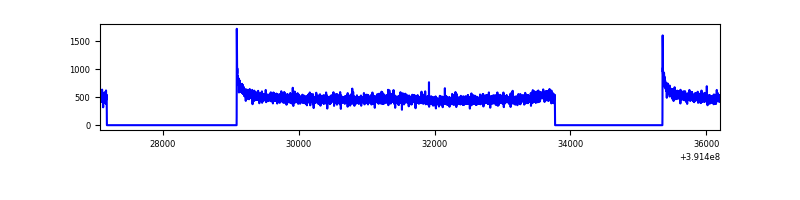 |
| B | 9130 | 5636 | 181 | 181 | 1.98% | 3.21% | 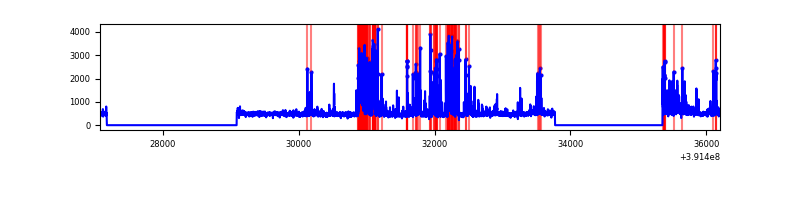 |
| C | 9130 | 5636 | 227 | 227 | 2.49% | 4.03% | 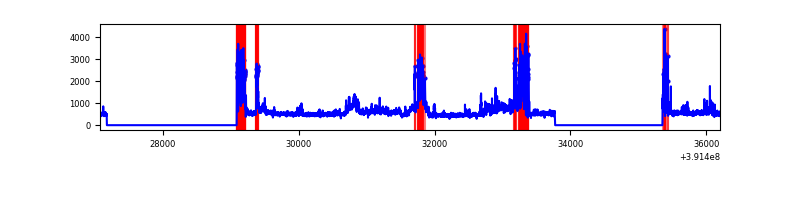 |
| D | 9130 | 5636 | 108 | 108 | 1.18% | 1.92% | 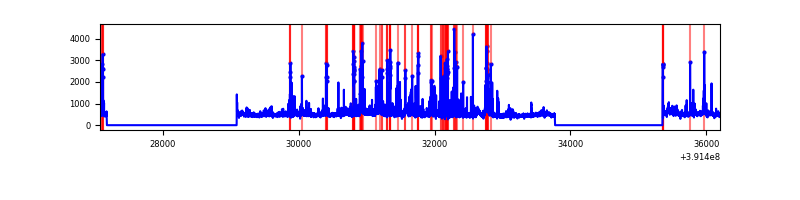 |
Top three noisy pixels from each quadrant. If the there are fewer than three noisy pixels in the level2.evt file, extra rows are filled as -1
| Pixel properties | Quadrant properties | ||||||
|---|---|---|---|---|---|---|---|
| Quadrant | DetID | PixID | Counts | Sigma | Mean | Median | Sigma |
| A | 10 | 83 | 175574 | 1311.5 | 654 | 641 | 133.4 |
| A | 13 | 254 | 9878 | 69.25 | 654 | 641 | 133.4 |
| A | 3 | 137 | 6880 | 46.77 | 654 | 641 | 133.4 |
| B | 5 | 236 | 710579 | 5700.8 | 638 | 621 | 124.5 |
| B | 5 | 172 | 125005 | 998.78 | 638 | 621 | 124.5 |
| B | 5 | 255 | 114290 | 912.74 | 638 | 621 | 124.5 |
| C | 9 | 187 | 1027238 | 7145.93 | 615 | 619 | 143.7 |
| C | 15 | 214 | 234740 | 1629.63 | 615 | 619 | 143.7 |
| C | 0 | 10 | 183398 | 1272.26 | 615 | 619 | 143.7 |
| D | 10 | 118 | 276936 | 1810.07 | 628 | 612 | 152.7 |
| D | 12 | 235 | 189187 | 1235.26 | 628 | 612 | 152.7 |
| D | 1 | 52 | 135190 | 881.56 | 628 | 612 | 152.7 |
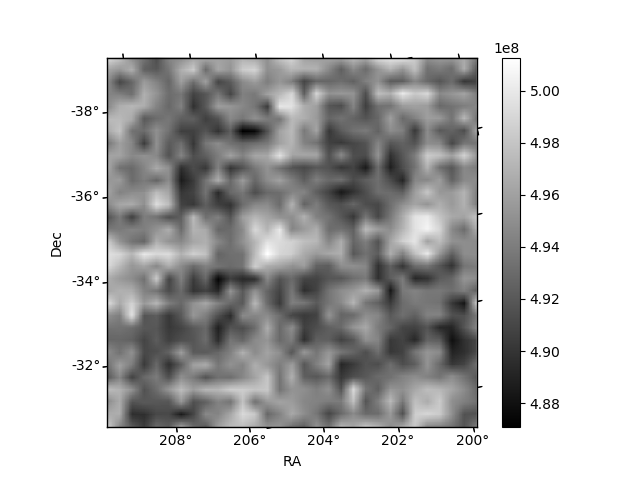
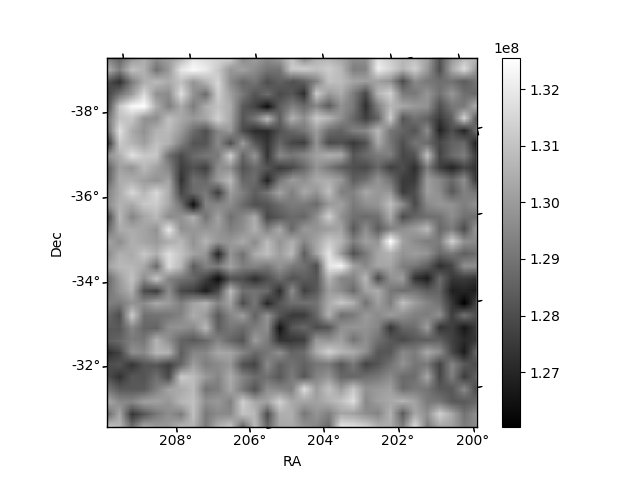
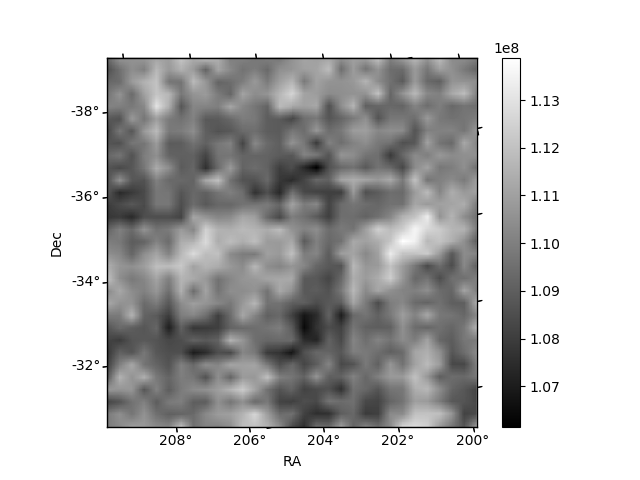
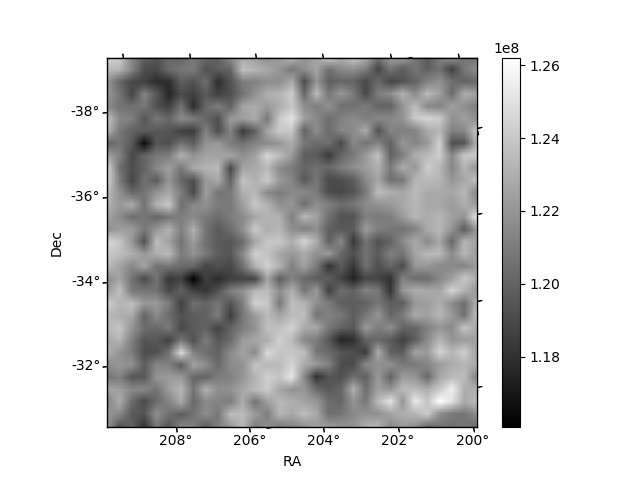
Histogram calculated using DETX and DETY for each event in the final _common_clean file
| Quadrant A | 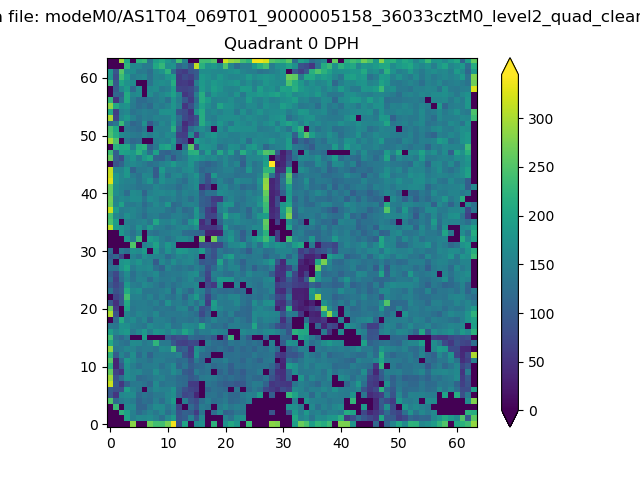 |
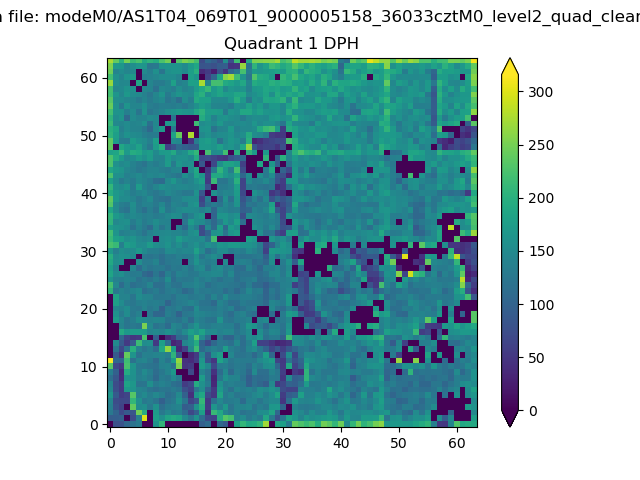 |
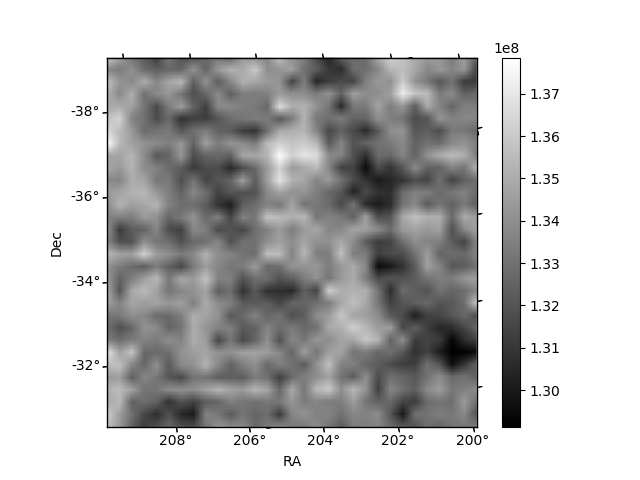
Quadrant B |
|---|---|---|---|
| Quadrant D | 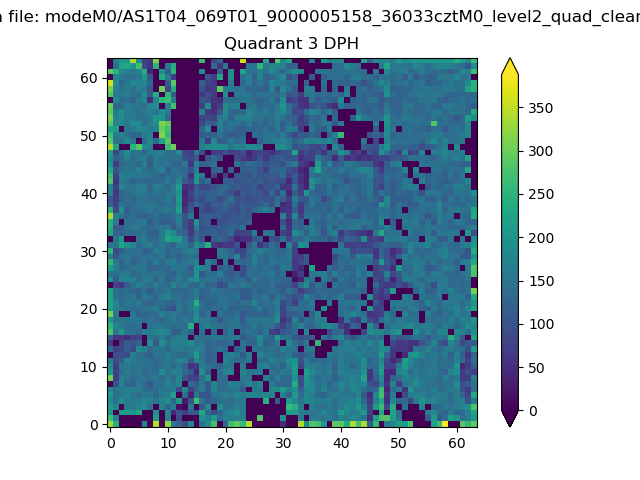 |
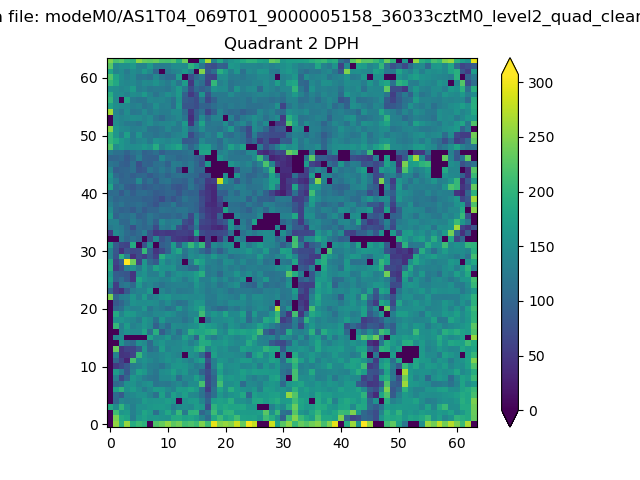 |
Quadrant C |
| Plot type | Count rate plots | Images |
|---|---|---|
| Comparison with Poisson distribution Blue bars denote a histogram of data divided into 1 sec bins. Red curve is a Poisson curve with rate = median count rate of data. |
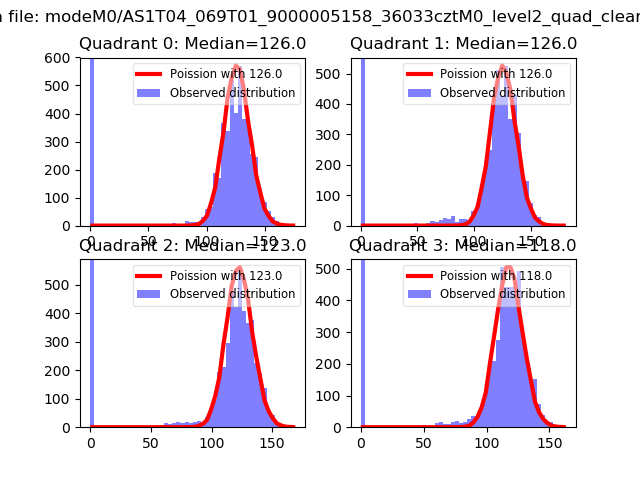 |
 |
| Quadrant-wise count rates Data is divided into 100 sec bins |
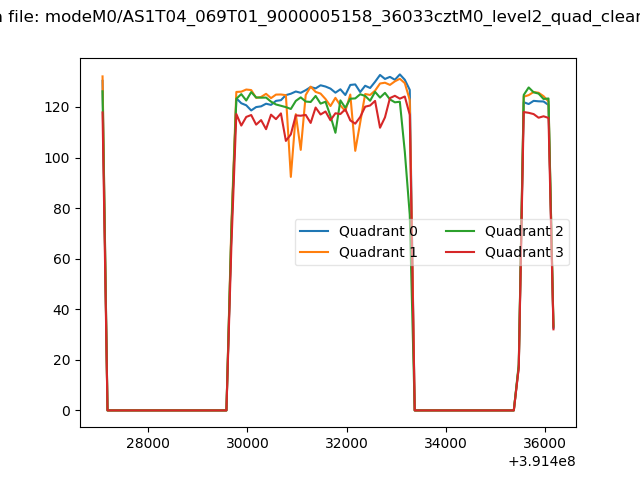 |
|
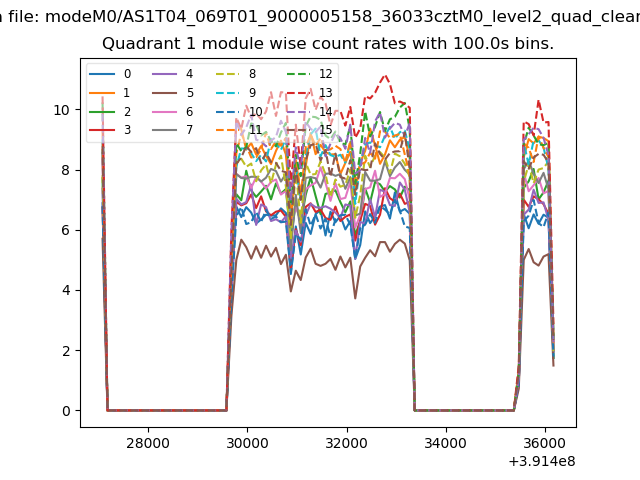
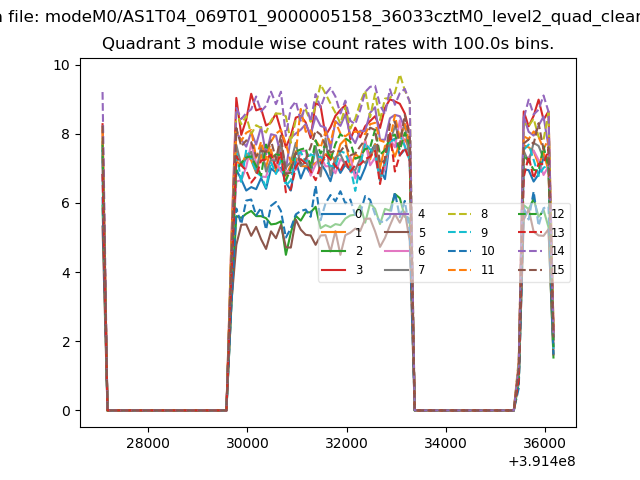
| Module-wise count rates for Quadrant A Data is divided into 100 sec bins |
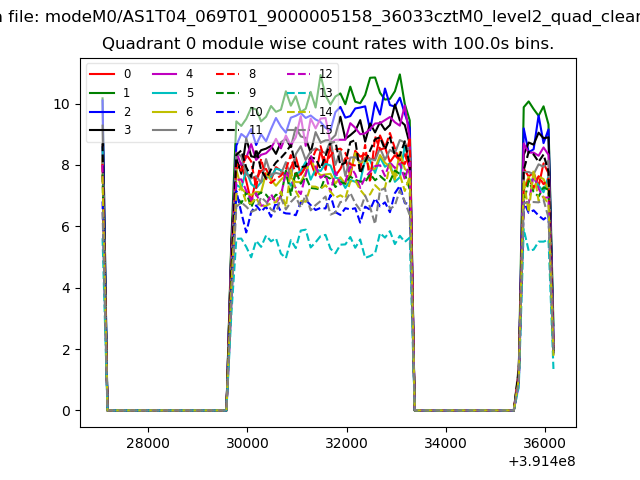 |
 |
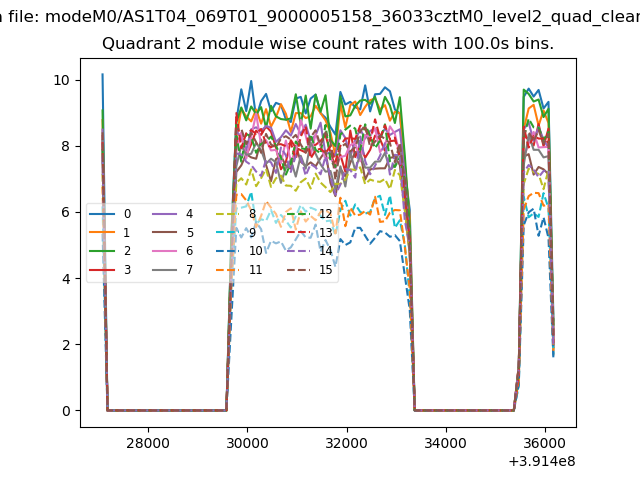
| Module-wise count rates for Quadrant B Data is divided into 100 sec bins |
 |
 |
| Module-wise count rates for Quadrant C Data is divided into 100 sec bins |
 |
 |
| Module-wise count rates for Quadrant D Data is divided into 100 sec bins |
 |
 |
| Parameter | Plot |
|---|---|
| CZT HV Monitor | 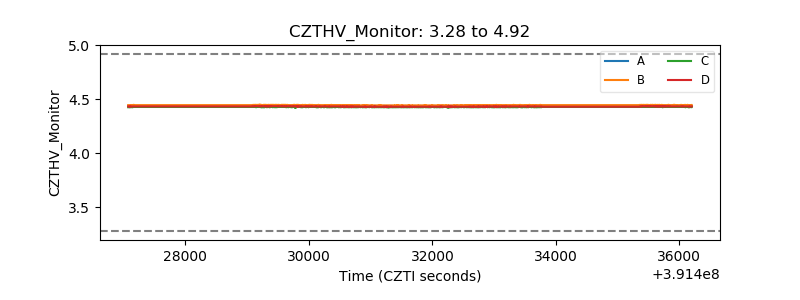 |
| D_VDD | 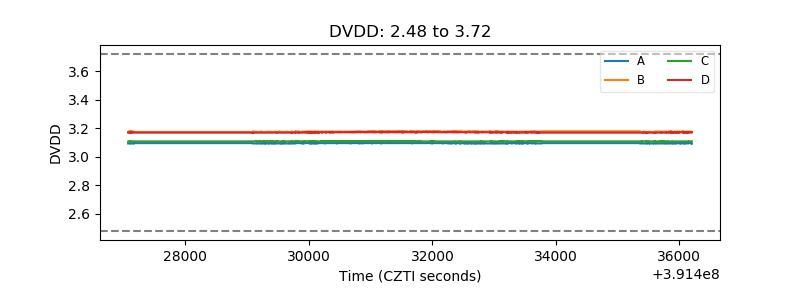 |
| Temperature 1 | 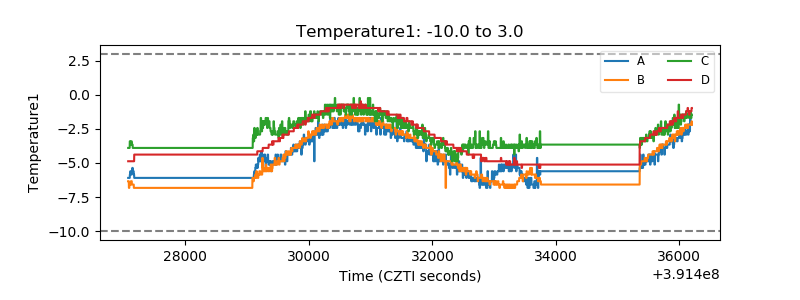 |
| Veto HV Monitor | 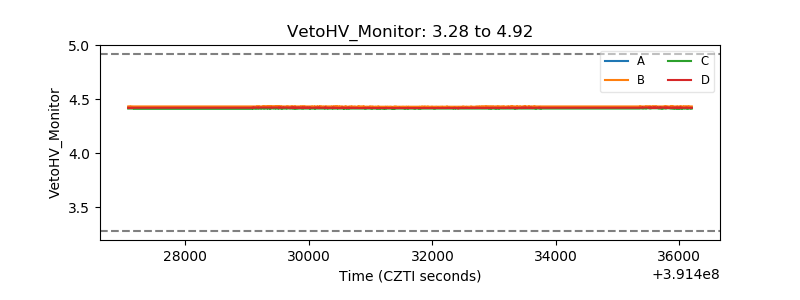 |
| Veto LLD | 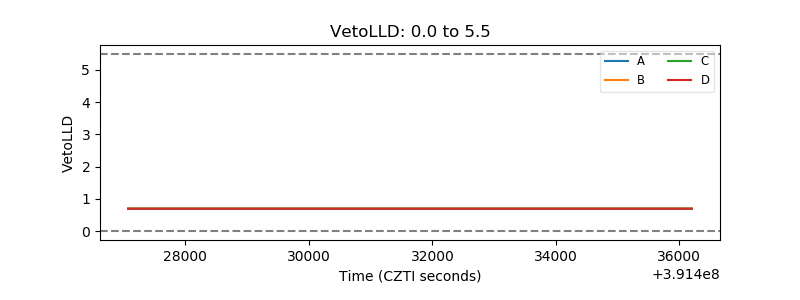 |
| Alpha Counter | 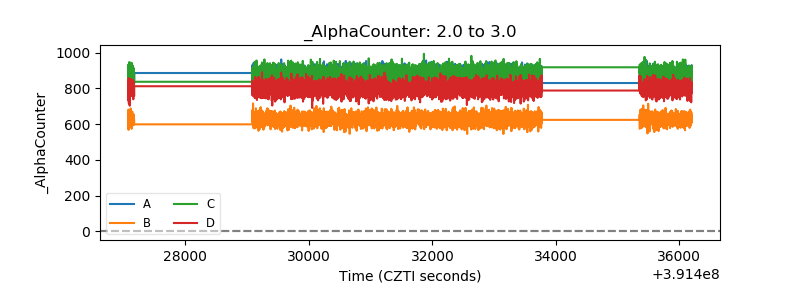 |
| _CPM_Rate | 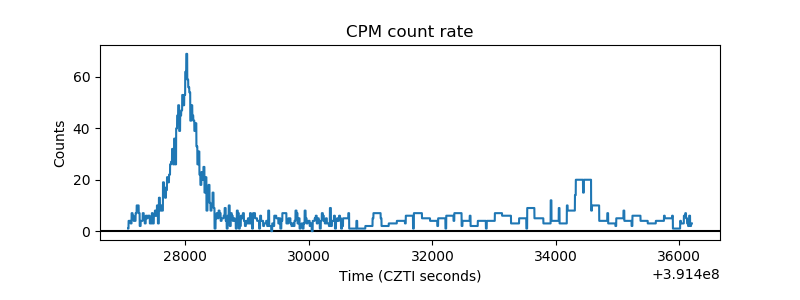 |
| CZT Counter | 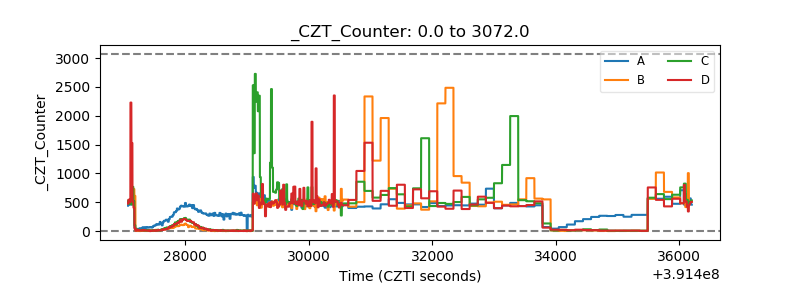 |
| +2.5 Volts monitor |  |
| +5 Volts monitor |  |
| _ROLL_ROT | 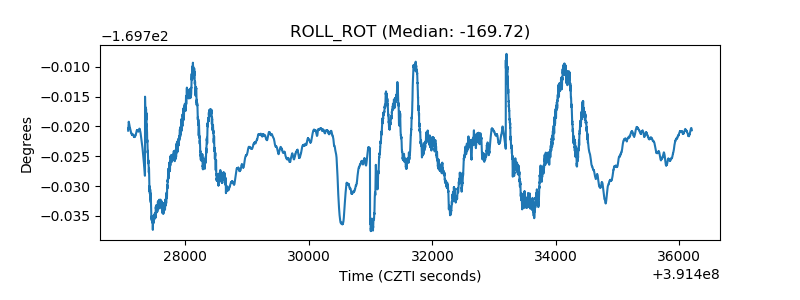 |
| _Roll_DEC | 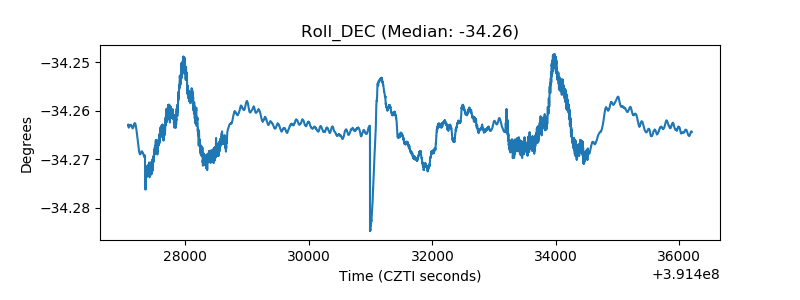 |
| _Roll_RA | 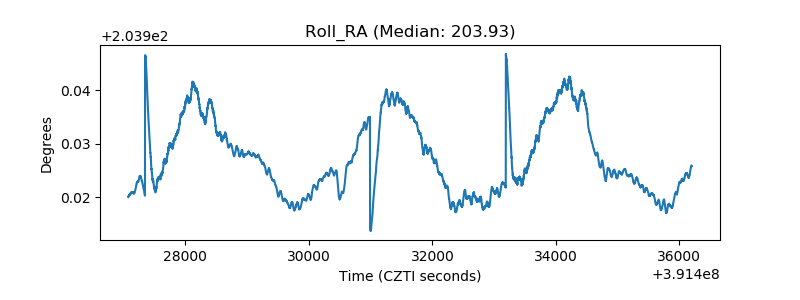 |
| Veto Counter | 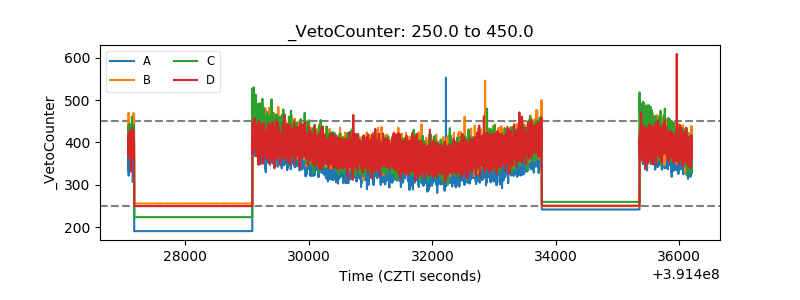 |