| Param | Original file | Final file |
|---|---|---|
| Filename | modeM0/AS1T04_069T01_9000005158_36048cztM0_level2.evt | modeM0/AS1T04_069T01_9000005158_36048cztM0_level2_quad_clean.evt |
| Size (bytes) | 501,454,080 | 88,911,360 |
| Size | 478.2 MB | 84.8 MB |
| Events in quadrant A | 2,876,059 | 586,046 |
| Events in quadrant B | 4,015,925 | 575,529 |
| Events in quadrant C | 3,566,537 | 573,934 |
| Events in quadrant D | 4,321,169 | 537,947 |
| Mode M0 | |||
|---|---|---|---|
| Quadrant | BADHDUFLAG | Total packets | Discarded packets |
| A | 0 | 12351 | 3 |
| B | 0 | 15809 | 2 |
| C | 0 | 14223 | 2 |
| D | 0 | 16920 | 2 |
| Mode M9 | |||
|---|---|---|---|
| Quadrant | BADHDUFLAG | Total packets | Discarded packets |
| A | 0 | 32 | 0 |
| B | 0 | 32 | 0 |
| C | 0 | 32 | 0 |
| D | 0 | 32 | 0 |
| Mode SS | |||
|---|---|---|---|
| Quadrant | BADHDUFLAG | Total packets | Discarded packets |
| A | 0 | 122 | 0 |
| B | 0 | 122 | 0 |
| C | 0 | 122 | 0 |
| D | 0 | 122 | 0 |
| Quadrant | Total seconds | Saturated seconds | Saturation percentage |
|---|---|---|---|
| A | 6004 | 14 | 0.233178% |
| B | 6004 | 288 | 4.796802% |
| C | 6004 | 159 | 2.648235% |
| D | 6004 | 346 | 5.762825% |
Noise dominated data is calculated using 1-second bins in cleaned event files. If a bin has >2000 counts, and if more than 50% of those come from <1% of pixels, then it is considered to be noise-dominated and hence unusable.
| Quadrant | # 1 sec bins | Bins with >0 counts | Bins with >2000 counts | High rate bins dominated by noise | Noise dominated (total time) | Noise dominated (detector-on time) | Marked lightcurve |
|---|---|---|---|---|---|---|---|
| A | 9170 | 6006 | 1 | 1 | 0.01% | 0.02% | 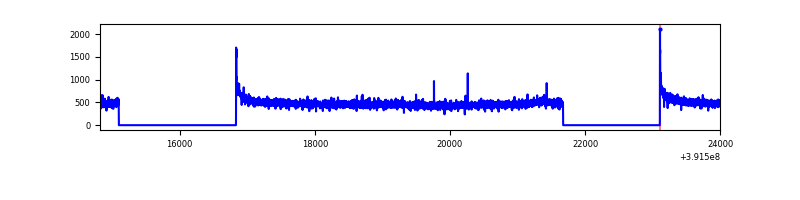 |
| B | 9170 | 6006 | 168 | 168 | 1.83% | 2.80% | 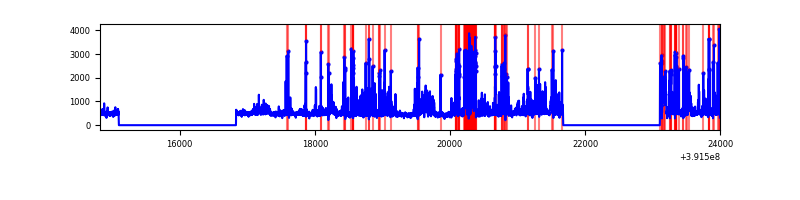 |
| C | 9170 | 6006 | 110 | 110 | 1.20% | 1.83% | 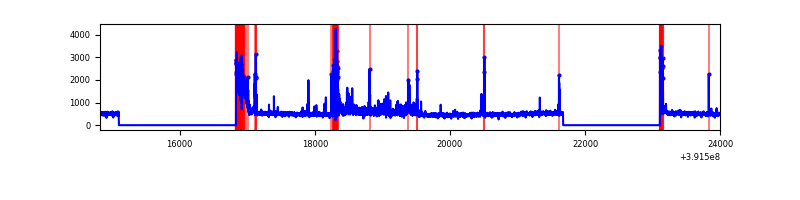 |
| D | 9170 | 6006 | 297 | 297 | 3.24% | 4.95% | 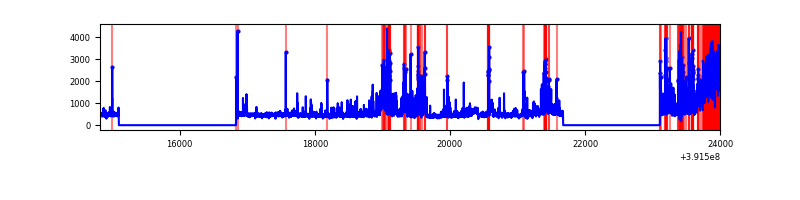 |
Top three noisy pixels from each quadrant. If the there are fewer than three noisy pixels in the level2.evt file, extra rows are filled as -1
| Pixel properties | Quadrant properties | ||||||
|---|---|---|---|---|---|---|---|
| Quadrant | DetID | PixID | Counts | Sigma | Mean | Median | Sigma |
| A | 10 | 83 | 180709 | 1272.74 | 693 | 678 | 141.5 |
| A | 13 | 6 | 8729 | 56.92 | 693 | 678 | 141.5 |
| A | 13 | 254 | 8359 | 54.3 | 693 | 678 | 141.5 |
| B | 5 | 236 | 769773 | 5849.45 | 676 | 658 | 131.5 |
| B | 0 | 190 | 370528 | 2813.02 | 676 | 658 | 131.5 |
| B | 0 | 213 | 74725 | 563.31 | 676 | 658 | 131.5 |
| C | 9 | 187 | 537272 | 3466.47 | 662 | 667 | 154.8 |
| C | 15 | 214 | 247819 | 1596.6 | 662 | 667 | 154.8 |
| C | 0 | 10 | 171616 | 1104.33 | 662 | 667 | 154.8 |
| D | 12 | 235 | 1055044 | 6484.41 | 659 | 642 | 162.6 |
| D | 12 | 6 | 190970 | 1170.49 | 659 | 642 | 162.6 |
| D | 12 | 17 | 153682 | 941.17 | 659 | 642 | 162.6 |
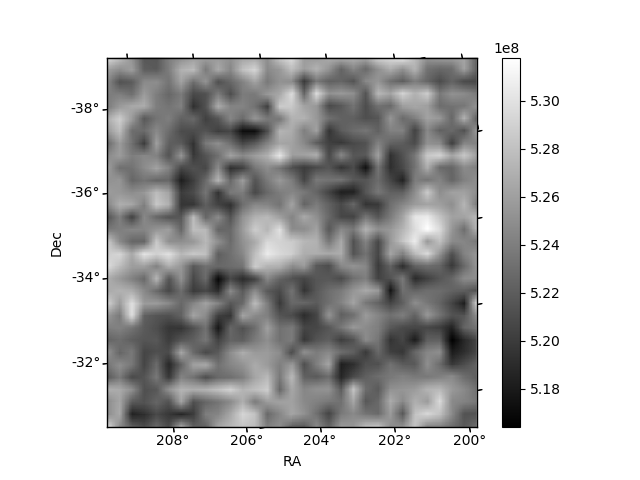
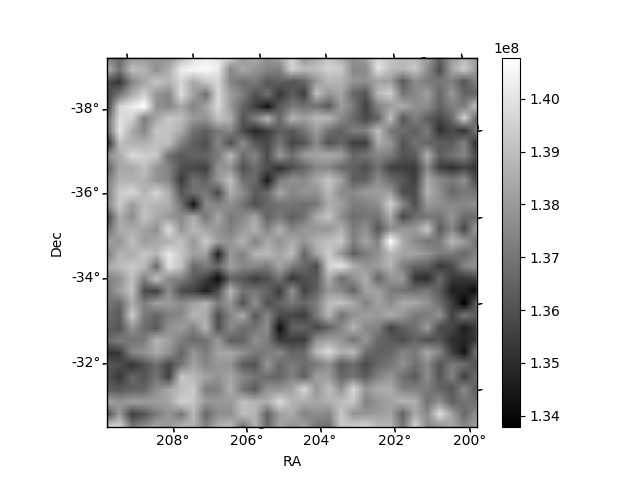
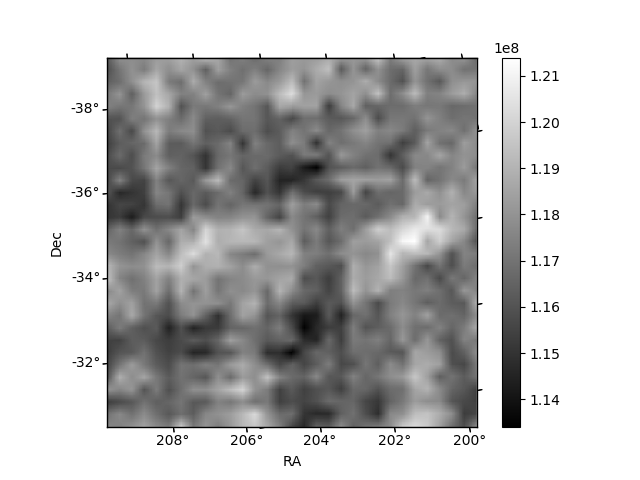
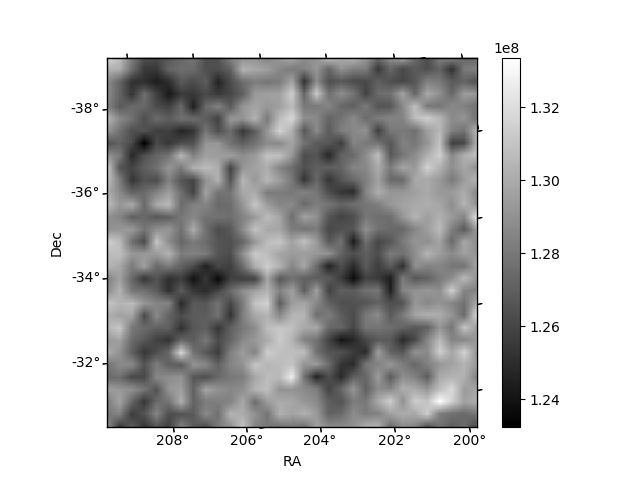
Histogram calculated using DETX and DETY for each event in the final _common_clean file
| Quadrant A | 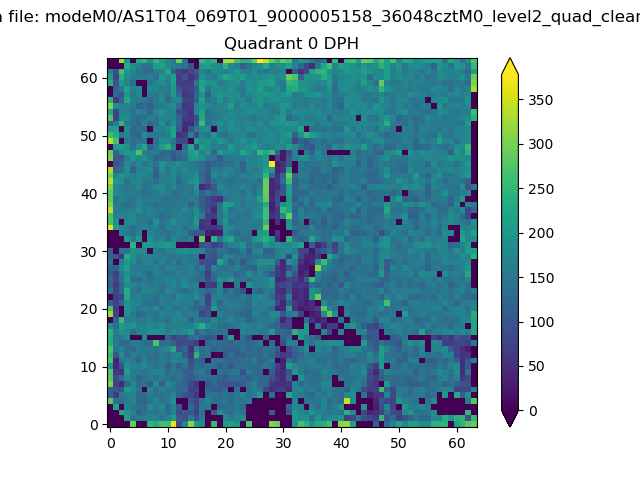 |
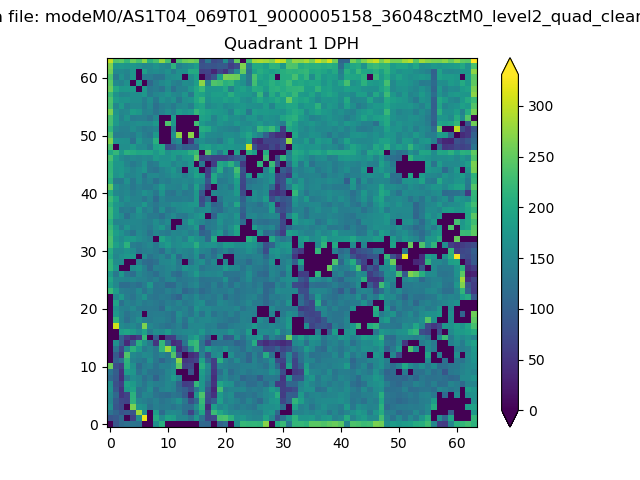 |
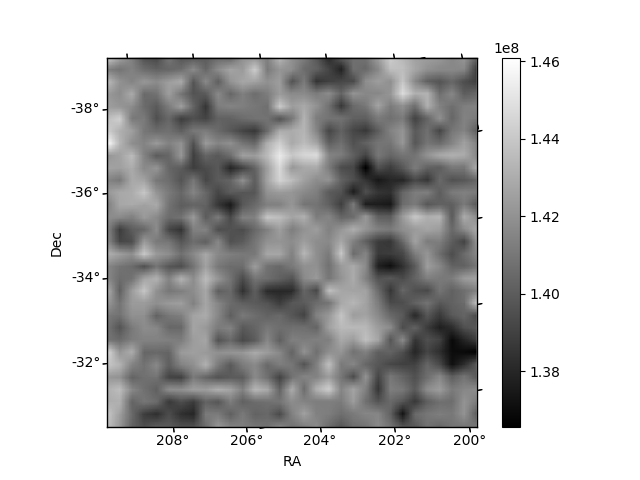
Quadrant B |
|---|---|---|---|
| Quadrant D | 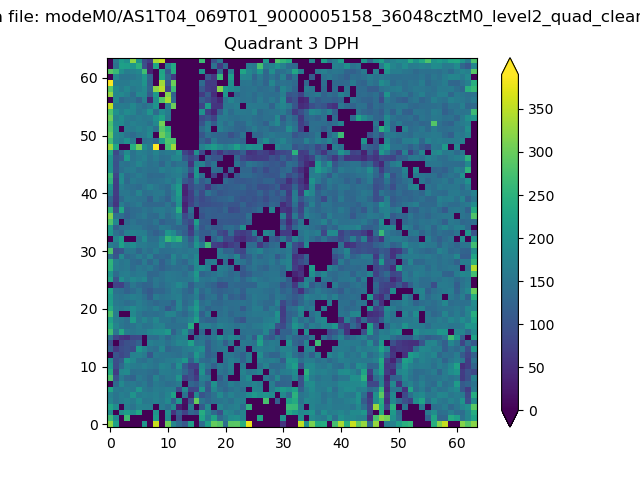 |
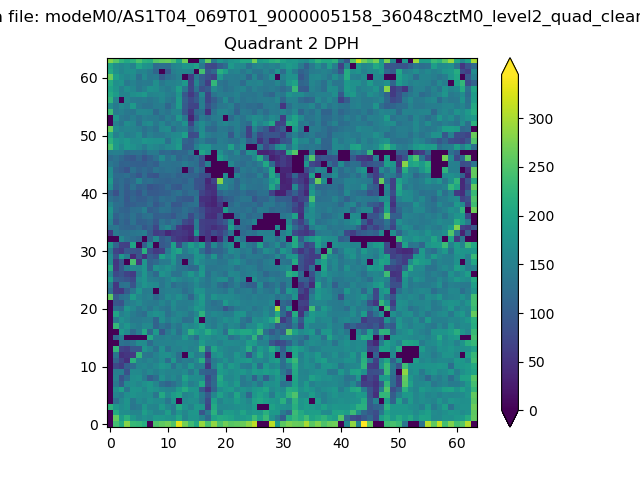 |
Quadrant C |
| Plot type | Count rate plots | Images |
|---|---|---|
| Comparison with Poisson distribution Blue bars denote a histogram of data divided into 1 sec bins. Red curve is a Poisson curve with rate = median count rate of data. |
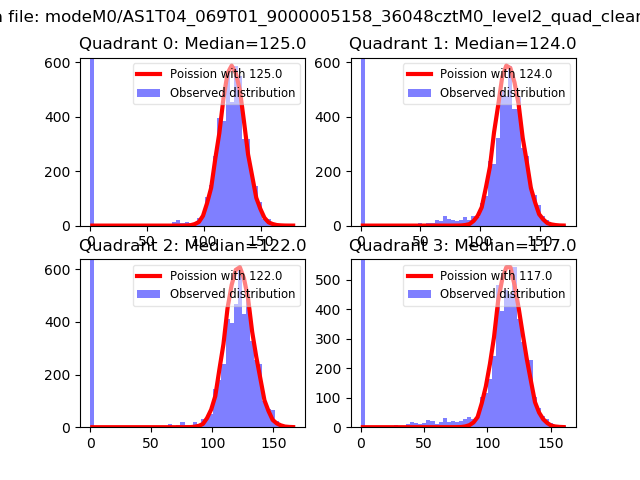 |
 |
| Quadrant-wise count rates Data is divided into 100 sec bins |
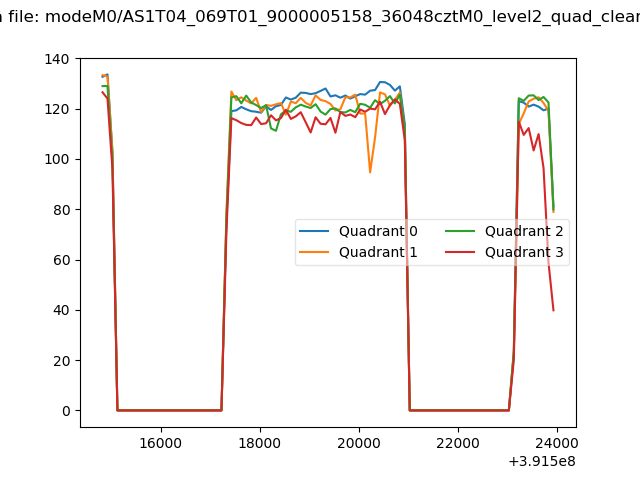 |
|
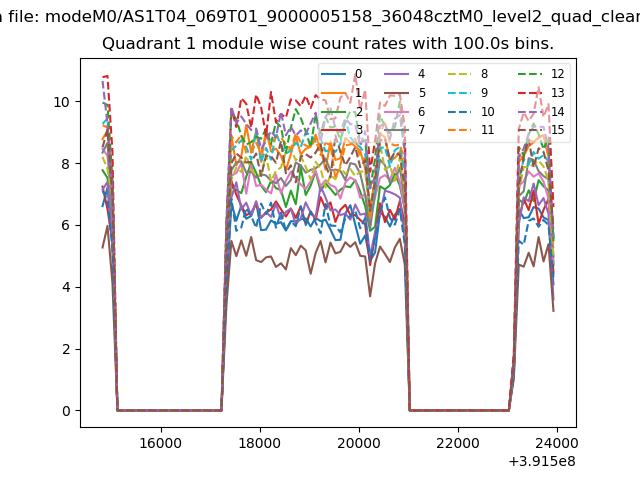
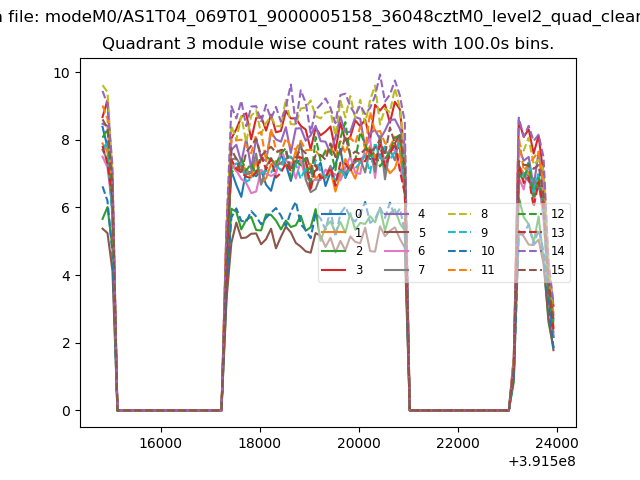
| Module-wise count rates for Quadrant A Data is divided into 100 sec bins |
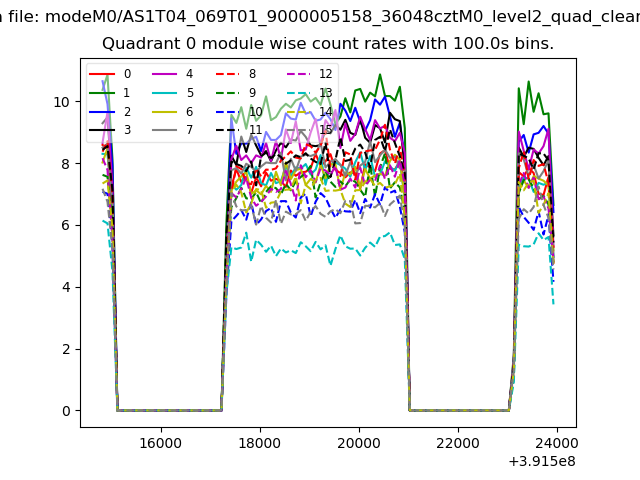 |
 |
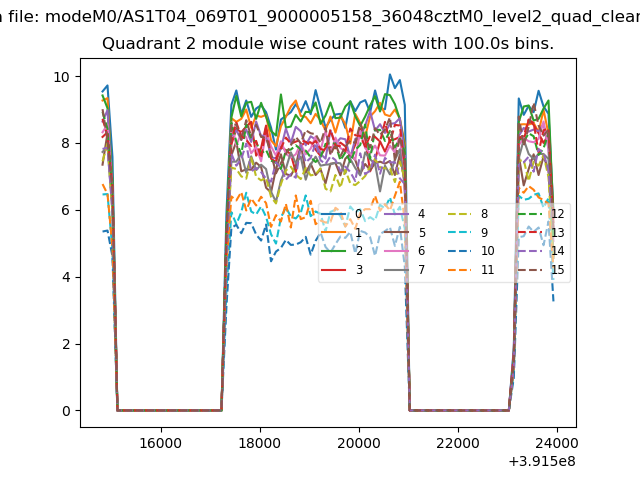
| Module-wise count rates for Quadrant B Data is divided into 100 sec bins |
 |
 |
| Module-wise count rates for Quadrant C Data is divided into 100 sec bins |
 |
 |
| Module-wise count rates for Quadrant D Data is divided into 100 sec bins |
 |
 |
| Parameter | Plot |
|---|---|
| CZT HV Monitor | 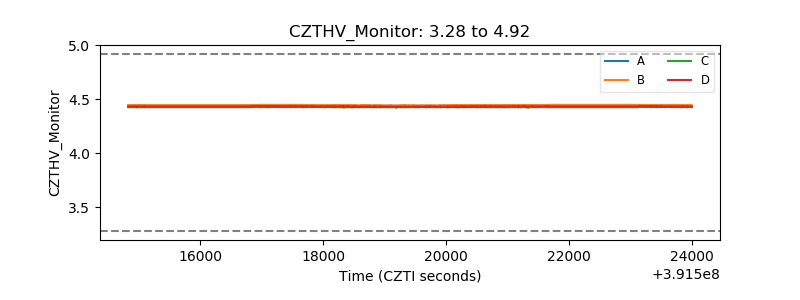 |
| D_VDD | 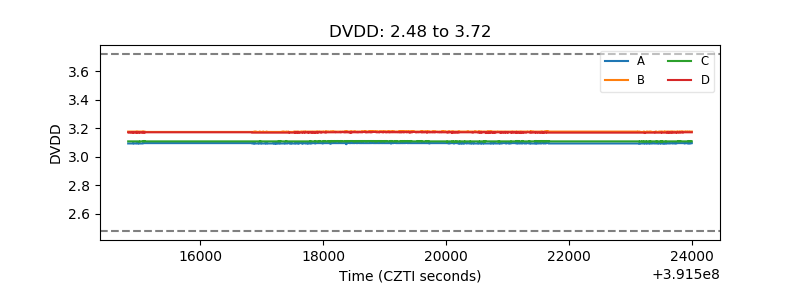 |
| Temperature 1 |  |
| Veto HV Monitor | 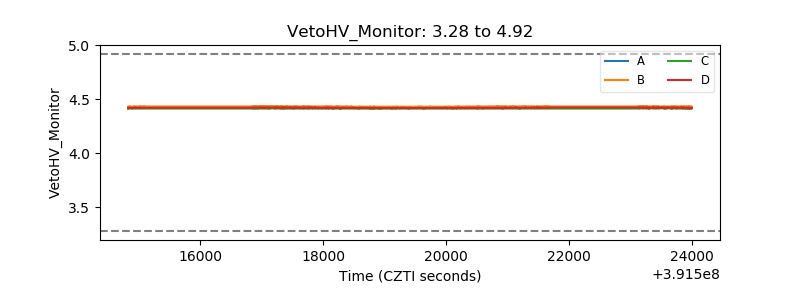 |
| Veto LLD | 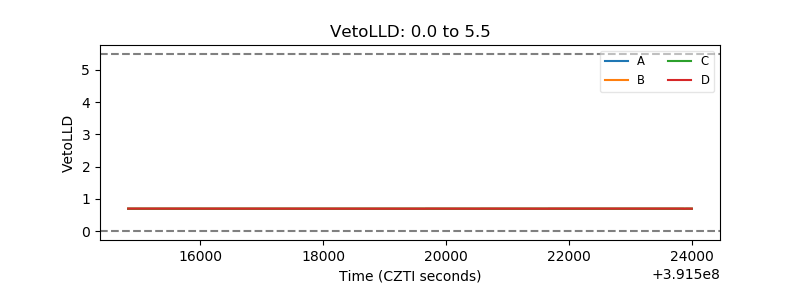 |
| Alpha Counter | 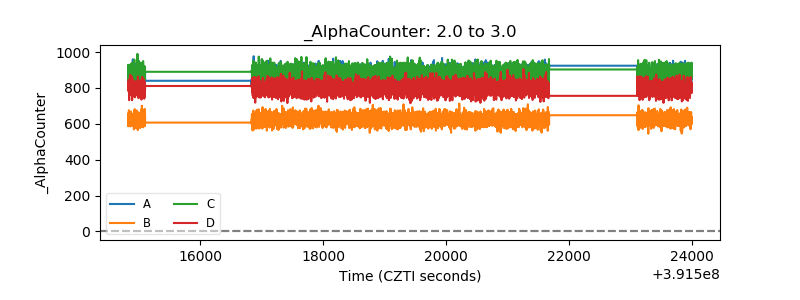 |
| _CPM_Rate | 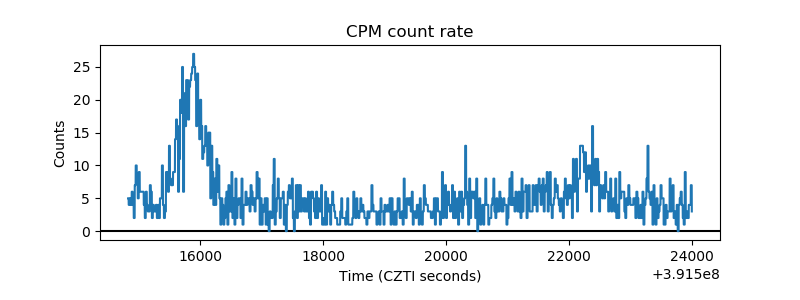 |
| CZT Counter | 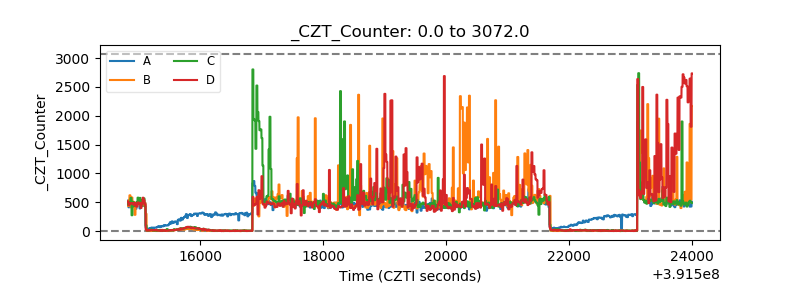 |
| +2.5 Volts monitor |  |
| +5 Volts monitor |  |
| _ROLL_ROT | 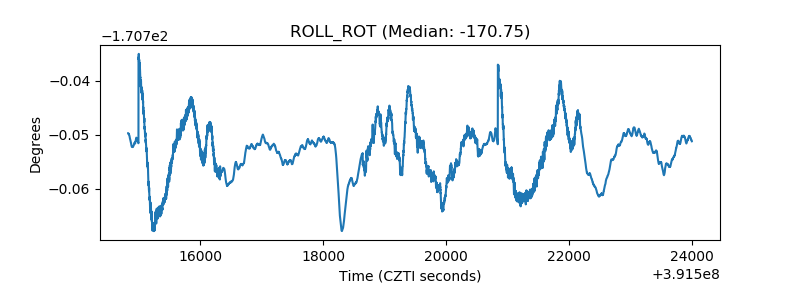 |
| _Roll_DEC |  |
| _Roll_RA | 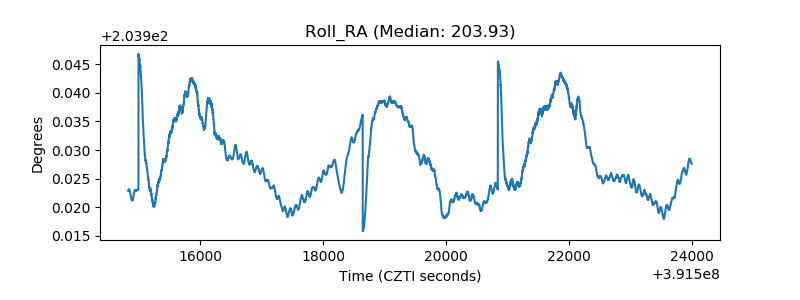 |
| Veto Counter | 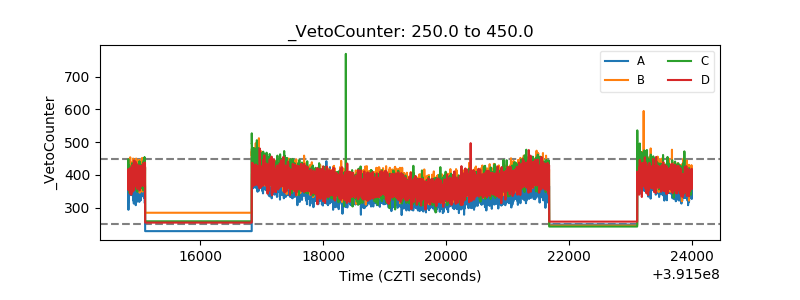 |