| Param | Original file | Final file |
|---|---|---|
| Filename | modeM0/AS1T04_069T01_9000005158_36057cztM0_level2.evt | modeM0/AS1T04_069T01_9000005158_36057cztM0_level2_quad_clean.evt |
| Size (bytes) | 573,203,520 | 55,578,240 |
| Size | 546.6 MB | 53.0 MB |
| Events in quadrant A | 2,605,692 | 355,377 |
| Events in quadrant B | 6,914,321 | 292,180 |
| Events in quadrant C | 3,867,816 | 349,391 |
| Events in quadrant D | 3,621,784 | 322,820 |
| Mode M0 | |||
|---|---|---|---|
| Quadrant | BADHDUFLAG | Total packets | Discarded packets |
| A | 0 | 10812 | 3 |
| B | 0 | 24073 | 2 |
| C | 0 | 14628 | 2 |
| D | 0 | 14222 | 2 |
| Mode M9 | |||
|---|---|---|---|
| Quadrant | BADHDUFLAG | Total packets | Discarded packets |
| A | 0 | 39 | 0 |
| B | 0 | 39 | 0 |
| C | 0 | 39 | 0 |
| D | 0 | 39 | 0 |
| Mode SS | |||
|---|---|---|---|
| Quadrant | BADHDUFLAG | Total packets | Discarded packets |
| A | 0 | 106 | 0 |
| B | 0 | 106 | 0 |
| C | 0 | 106 | 0 |
| D | 0 | 106 | 0 |
| Quadrant | Total seconds | Saturated seconds | Saturation percentage |
|---|---|---|---|
| A | 5176 | 5 | 0.096600% |
| B | 5176 | 1684 | 32.534776% |
| C | 5176 | 117 | 2.260433% |
| D | 5176 | 221 | 4.269706% |
Noise dominated data is calculated using 1-second bins in cleaned event files. If a bin has >2000 counts, and if more than 50% of those come from <1% of pixels, then it is considered to be noise-dominated and hence unusable.
| Quadrant | # 1 sec bins | Bins with >0 counts | Bins with >2000 counts | High rate bins dominated by noise | Noise dominated (total time) | Noise dominated (detector-on time) | Marked lightcurve |
|---|---|---|---|---|---|---|---|
| A | 9000 | 5178 | 0 | 0 | 0.00% | 0.00% | 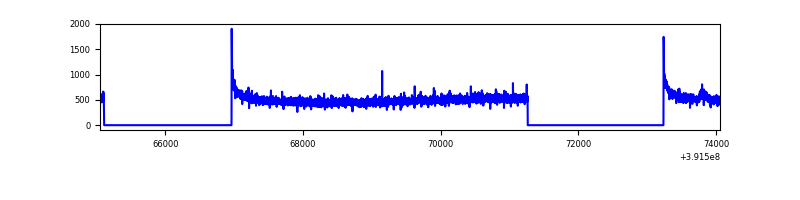 |
| B | 9000 | 5178 | 1281 | 1281 | 14.23% | 24.74% | 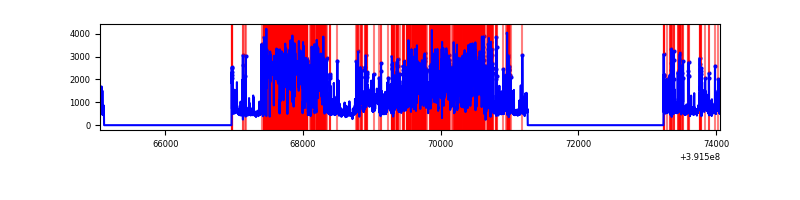 |
| C | 9000 | 5178 | 99 | 99 | 1.10% | 1.91% | 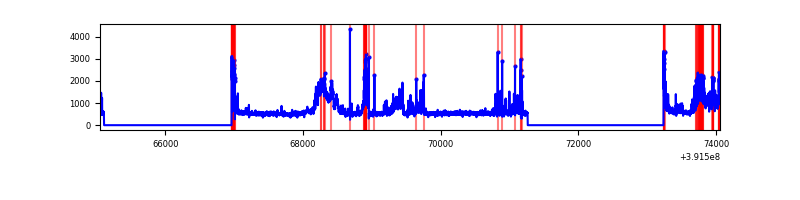 |
| D | 9000 | 5178 | 203 | 203 | 2.26% | 3.92% | 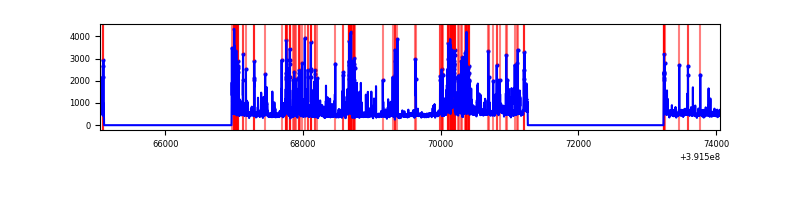 |
Top three noisy pixels from each quadrant. If the there are fewer than three noisy pixels in the level2.evt file, extra rows are filled as -1
| Pixel properties | Quadrant properties | ||||||
|---|---|---|---|---|---|---|---|
| Quadrant | DetID | PixID | Counts | Sigma | Mean | Median | Sigma |
| A | 10 | 83 | 162851 | 1277.23 | 627 | 617 | 127.0 |
| A | 13 | 6 | 20171 | 153.94 | 627 | 617 | 127.0 |
| A | 13 | 254 | 7479 | 54.02 | 627 | 617 | 127.0 |
| B | 5 | 236 | 4390228 | 42743.04 | 538 | 525 | 102.7 |
| B | 5 | 172 | 193321 | 1877.28 | 538 | 525 | 102.7 |
| B | 0 | 213 | 153885 | 1493.28 | 538 | 525 | 102.7 |
| C | 9 | 187 | 1110650 | 7850.61 | 607 | 612 | 141.4 |
| C | 15 | 214 | 215456 | 1519.46 | 607 | 612 | 141.4 |
| C | 0 | 10 | 124969 | 879.5 | 607 | 612 | 141.4 |
| D | 12 | 6 | 288087 | 1967.43 | 596 | 579 | 146.1 |
| D | 7 | 223 | 273191 | 1865.5 | 596 | 579 | 146.1 |
| D | 12 | 233 | 172353 | 1175.46 | 596 | 579 | 146.1 |
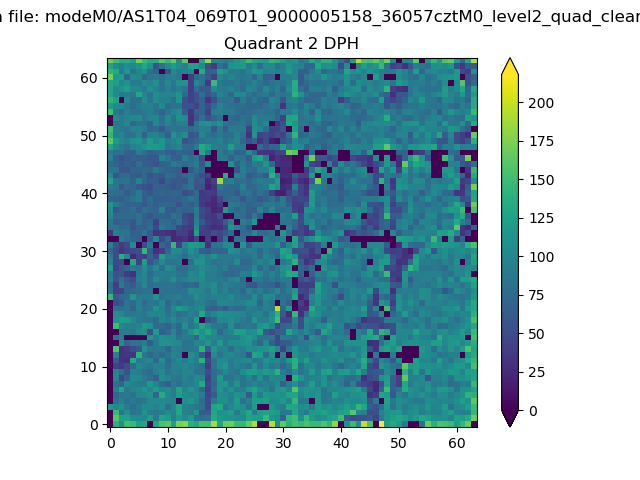
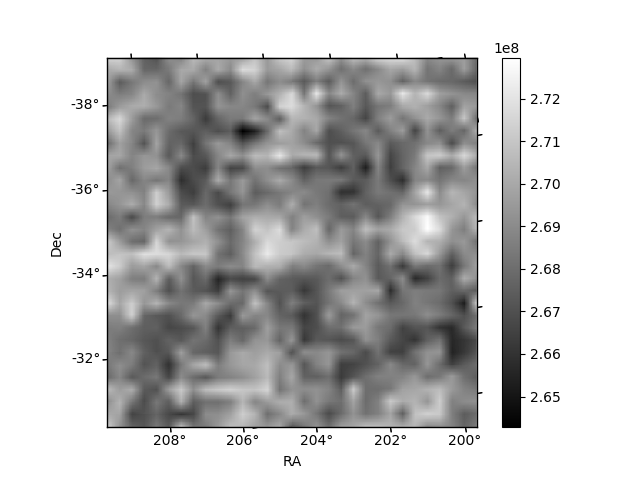
Histogram calculated using DETX and DETY for each event in the final _common_clean file
| Quadrant A | 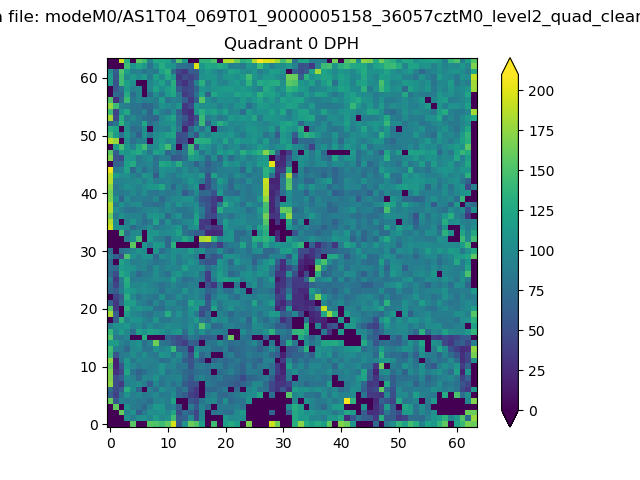 |
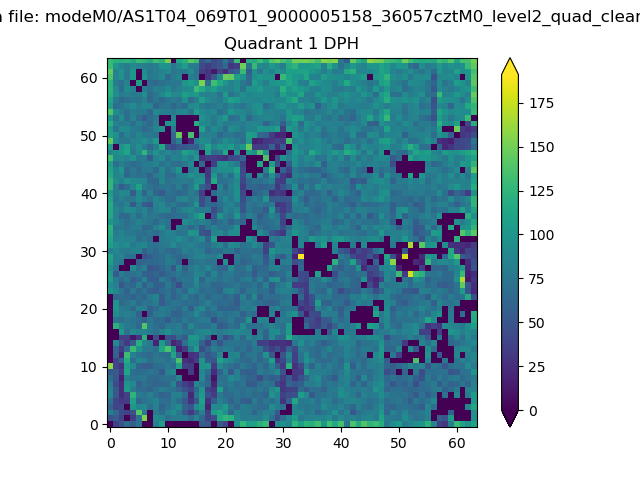 |
Quadrant B |
|---|---|---|---|
| Quadrant D | 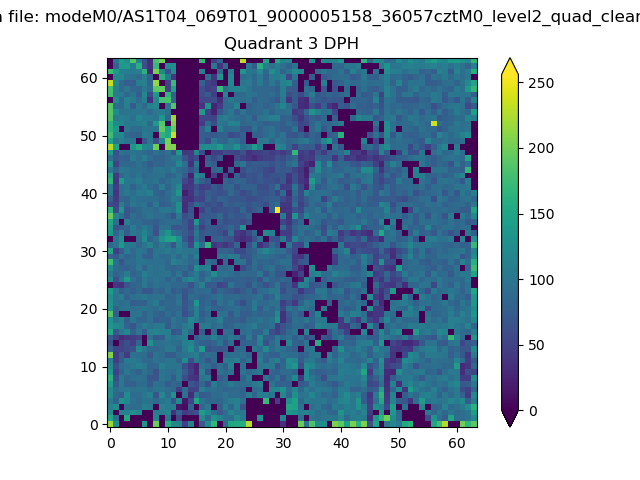 |
 |
Quadrant C |
| Plot type | Count rate plots | Images |
|---|---|---|
| Comparison with Poisson distribution Blue bars denote a histogram of data divided into 1 sec bins. Red curve is a Poisson curve with rate = median count rate of data. |
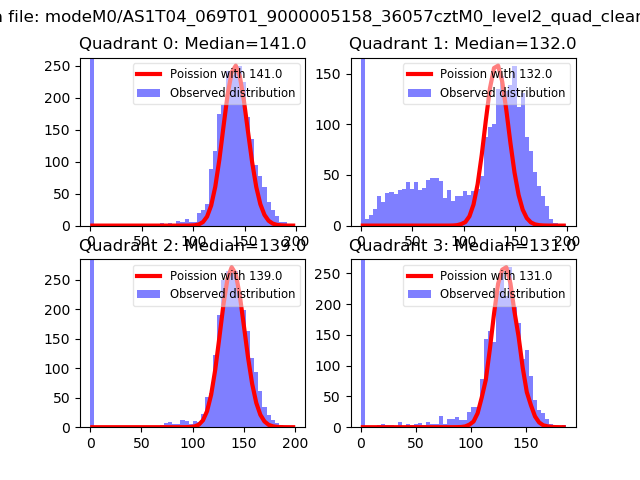 |
 |
| Quadrant-wise count rates Data is divided into 100 sec bins |
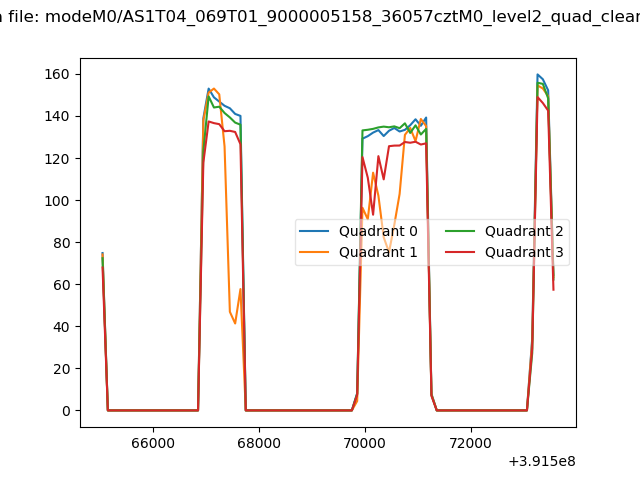 |
|
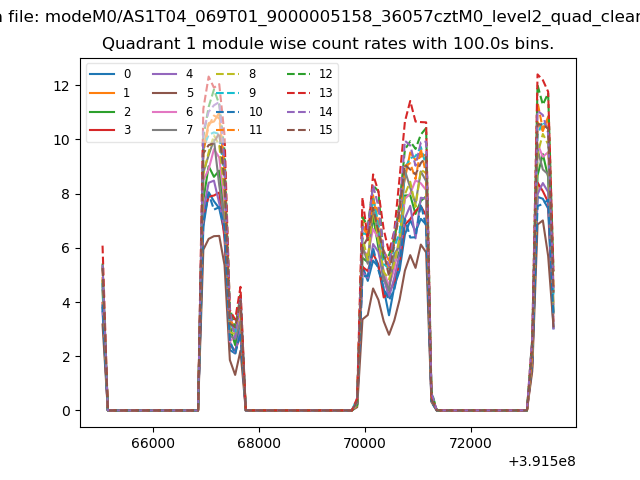
| Module-wise count rates for Quadrant A Data is divided into 100 sec bins |
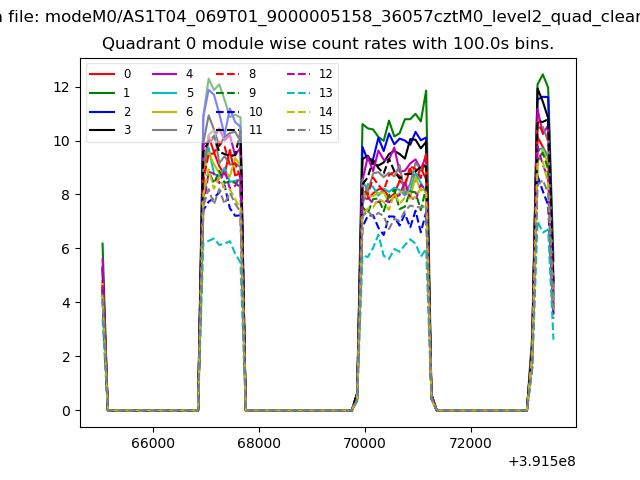 |
 |
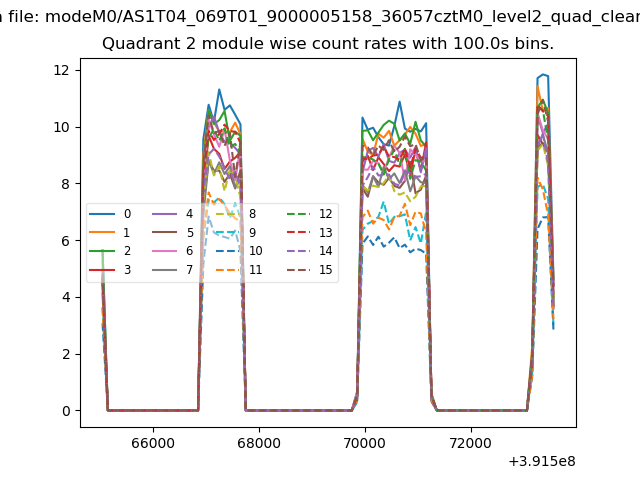
| Module-wise count rates for Quadrant B Data is divided into 100 sec bins |
 |
 |
| Module-wise count rates for Quadrant C Data is divided into 100 sec bins |
 |
 |
| Module-wise count rates for Quadrant D Data is divided into 100 sec bins |
 |
 |
| Parameter | Plot |
|---|---|
| CZT HV Monitor | 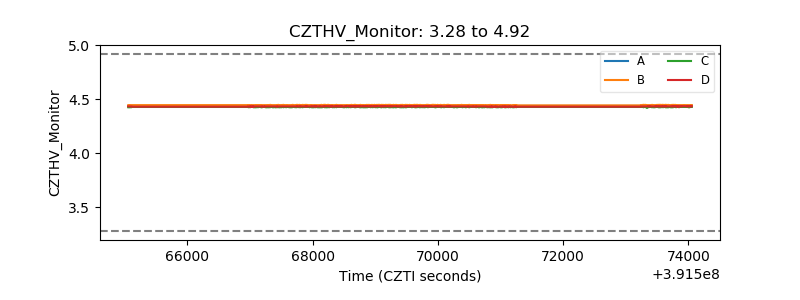 |
| D_VDD | 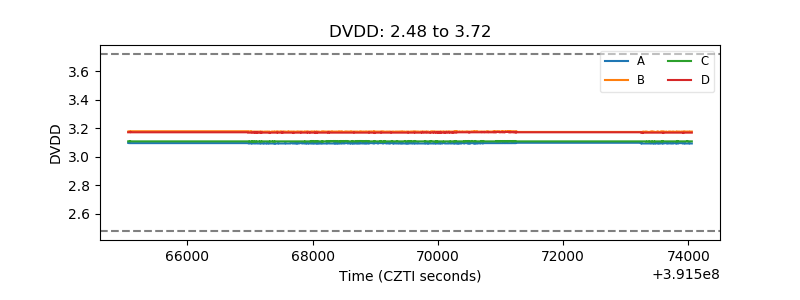 |
| Temperature 1 |  |
| Veto HV Monitor | 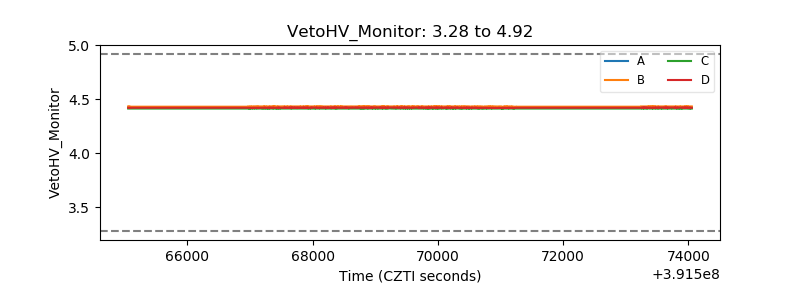 |
| Veto LLD | 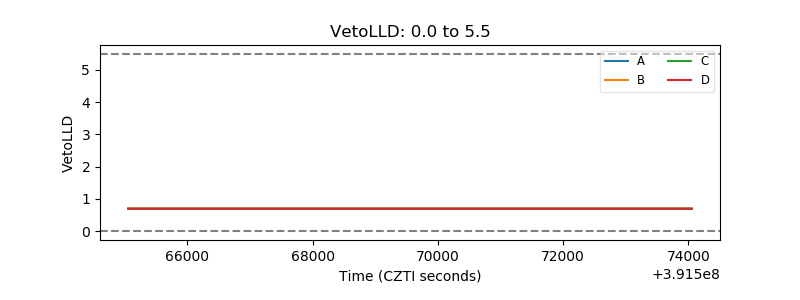 |
| Alpha Counter | 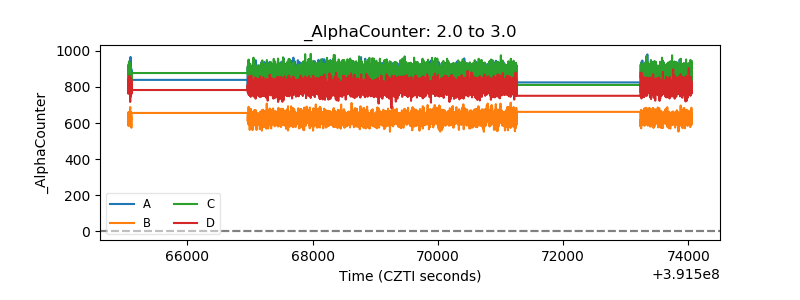 |
| _CPM_Rate | 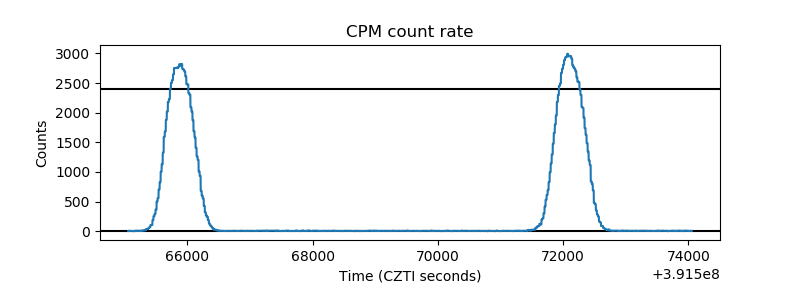 |
| CZT Counter | 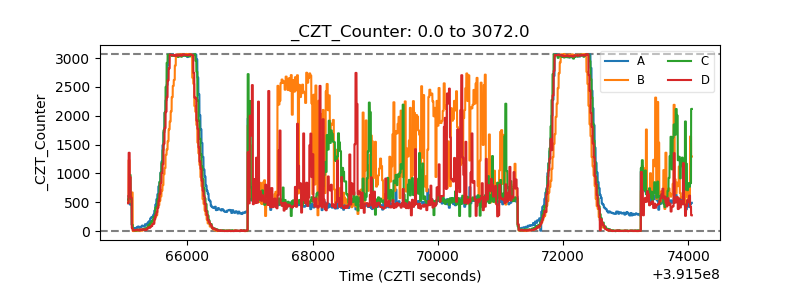 |
| +2.5 Volts monitor |  |
| +5 Volts monitor |  |
| _ROLL_ROT | 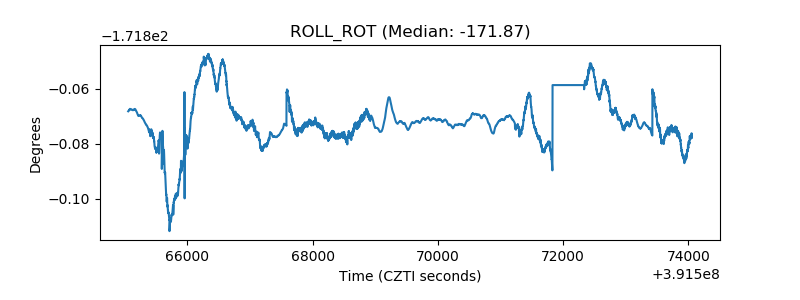 |
| _Roll_DEC | 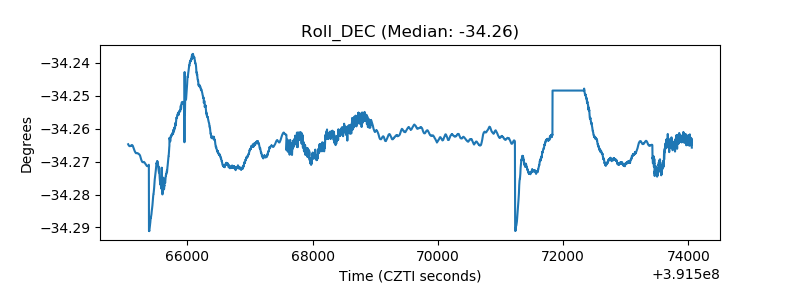 |
| _Roll_RA | 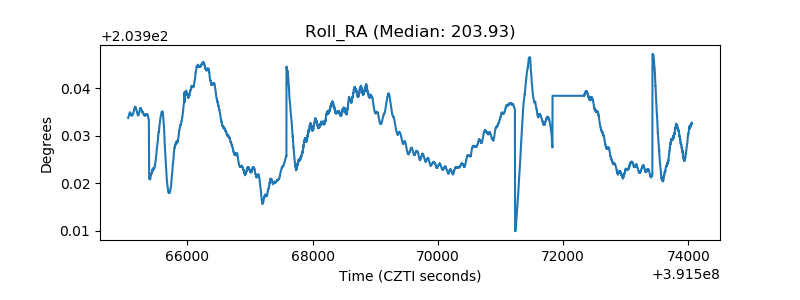 |
| Veto Counter | 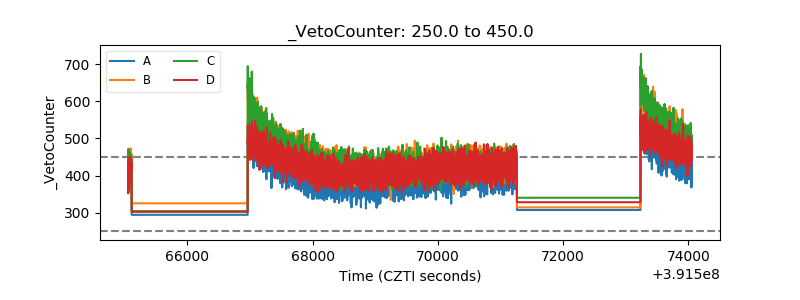 |