| Param | Original file | Final file |
|---|---|---|
| Filename | modeM0/AS1T04_069T01_9000005158_36063cztM0_level2.evt | modeM0/AS1T04_069T01_9000005158_36063cztM0_level2_quad_clean.evt |
| Size (bytes) | 1,911,303,360 | 205,352,640 |
| Size | 1.8 GB | 195.8 MB |
| Events in quadrant A | 6,956,375 | 1,435,011 |
| Events in quadrant B | 10,365,208 | 1,400,165 |
| Events in quadrant C | 28,284,502 | 1,057,951 |
| Events in quadrant D | 11,300,030 | 1,317,578 |
| Mode M0 | |||
|---|---|---|---|
| Quadrant | BADHDUFLAG | Total packets | Discarded packets |
| A | 0 | 29770 | 4 |
| B | 0 | 40123 | 3 |
| C | 0 | 94165 | 3 |
| D | 0 | 43416 | 3 |
| Mode M9 | |||
|---|---|---|---|
| Quadrant | BADHDUFLAG | Total packets | Discarded packets |
| A | 0 | 47 | 0 |
| B | 0 | 47 | 0 |
| C | 0 | 47 | 0 |
| D | 0 | 47 | 0 |
| Mode SS | |||
|---|---|---|---|
| Quadrant | BADHDUFLAG | Total packets | Discarded packets |
| A | 0 | 298 | 0 |
| B | 0 | 298 | 0 |
| C | 0 | 298 | 0 |
| D | 0 | 298 | 0 |
| Quadrant | Total seconds | Saturated seconds | Saturation percentage |
|---|---|---|---|
| A | 14573 | 19 | 0.130378% |
| B | 14573 | 970 | 6.656145% |
| C | 14573 | 7620 | 52.288479% |
| D | 14573 | 758 | 5.201400% |
Noise dominated data is calculated using 1-second bins in cleaned event files. If a bin has >2000 counts, and if more than 50% of those come from <1% of pixels, then it is considered to be noise-dominated and hence unusable.
| Quadrant | # 1 sec bins | Bins with >0 counts | Bins with >2000 counts | High rate bins dominated by noise | Noise dominated (total time) | Noise dominated (detector-on time) | Marked lightcurve |
|---|---|---|---|---|---|---|---|
| A | 19352 | 14576 | 8 | 8 | 0.04% | 0.05% | 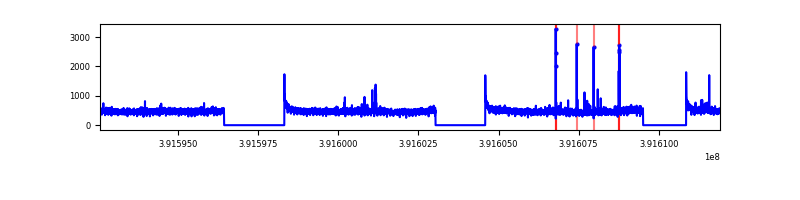 |
| B | 19352 | 14576 | 692 | 692 | 3.58% | 4.75% | 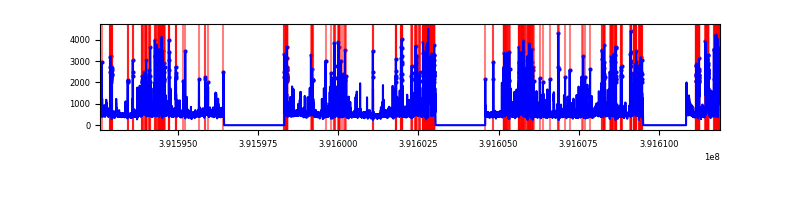 |
| C | 19351 | 14574 | 7635 | 7635 | 39.46% | 52.39% | 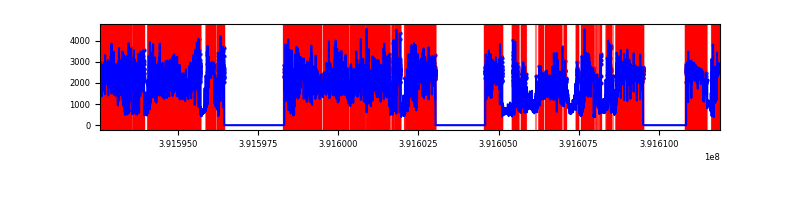 |
| D | 19352 | 14576 | 708 | 708 | 3.66% | 4.86% | 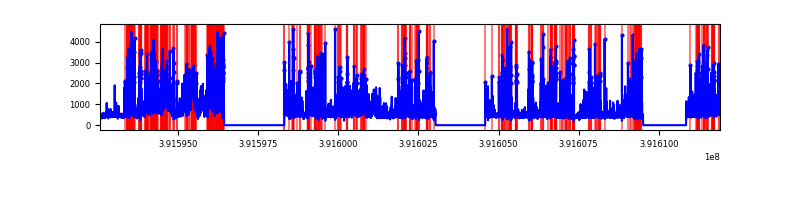 |
Top three noisy pixels from each quadrant. If the there are fewer than three noisy pixels in the level2.evt file, extra rows are filled as -1
| Pixel properties | Quadrant properties | ||||||
|---|---|---|---|---|---|---|---|
| Quadrant | DetID | PixID | Counts | Sigma | Mean | Median | Sigma |
| A | 10 | 83 | 370669 | 1096.95 | 1676 | 1647 | 336.4 |
| A | 9 | 143 | 40246 | 114.74 | 1676 | 1647 | 336.4 |
| A | 13 | 6 | 35129 | 99.53 | 1676 | 1647 | 336.4 |
| B | 5 | 236 | 2560390 | 8373.5 | 1611 | 1571 | 305.6 |
| B | 5 | 172 | 526771 | 1718.67 | 1611 | 1571 | 305.6 |
| B | 0 | 213 | 401040 | 1307.23 | 1611 | 1571 | 305.6 |
| C | 9 | 187 | 22371212 | 78661.2 | 1227 | 1235 | 284.4 |
| C | 15 | 214 | 469580 | 1646.88 | 1227 | 1235 | 284.4 |
| C | 9 | 203 | 356848 | 1250.47 | 1227 | 1235 | 284.4 |
| D | 12 | 227 | 1396945 | 3583.71 | 1592 | 1549 | 389.4 |
| D | 12 | 6 | 1275114 | 3270.82 | 1592 | 1549 | 389.4 |
| D | 7 | 223 | 756229 | 1938.2 | 1592 | 1549 | 389.4 |
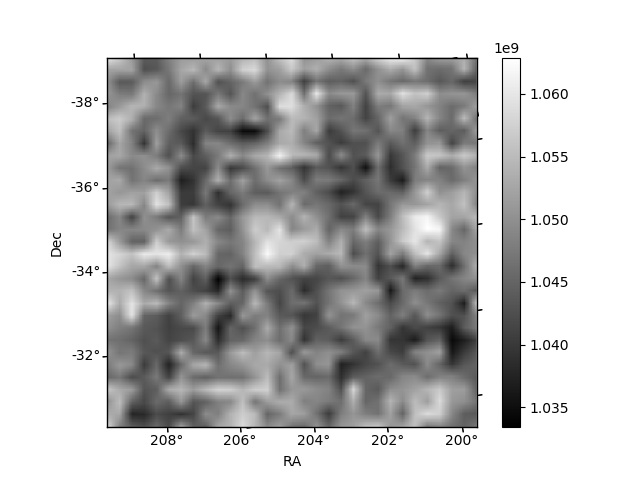
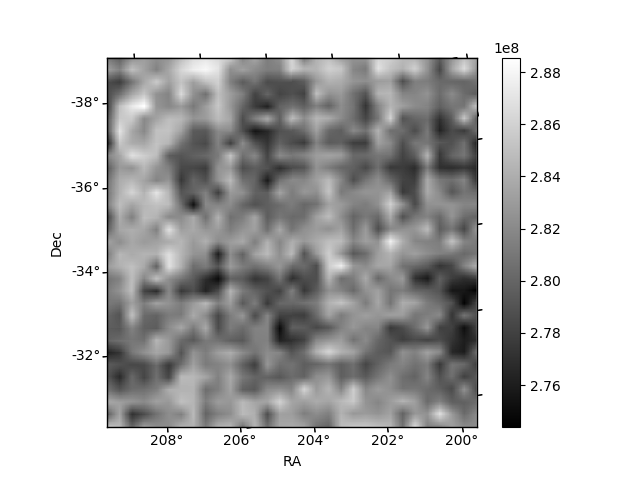
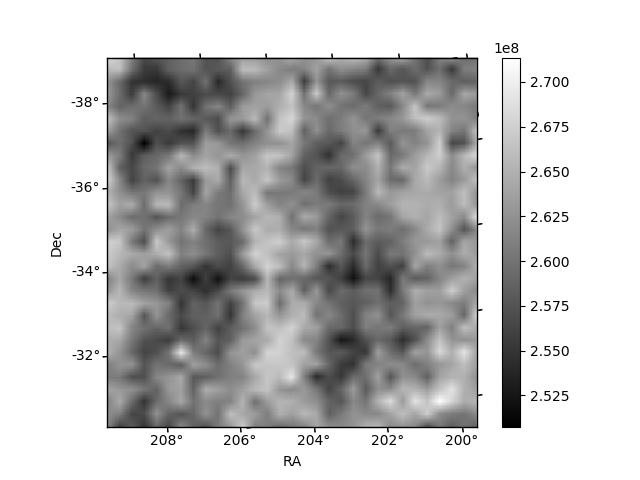
Histogram calculated using DETX and DETY for each event in the final _common_clean file
| Quadrant A | 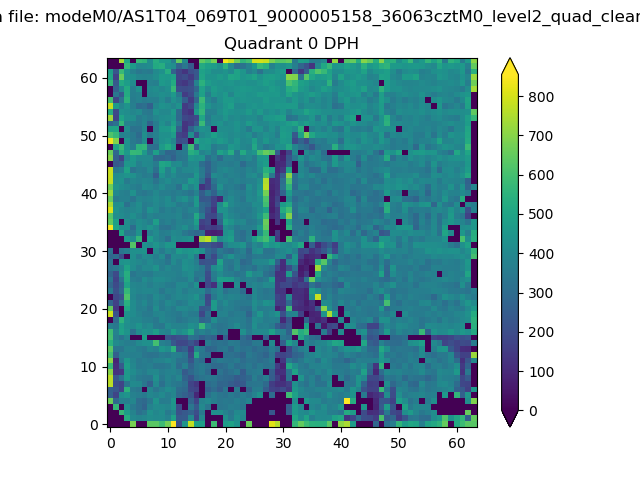 |
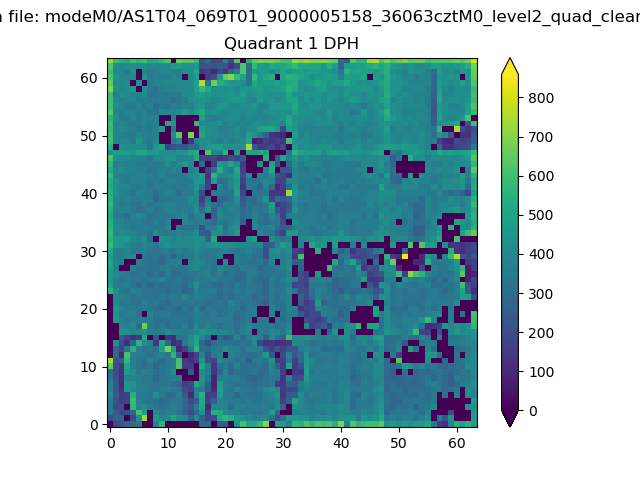 |
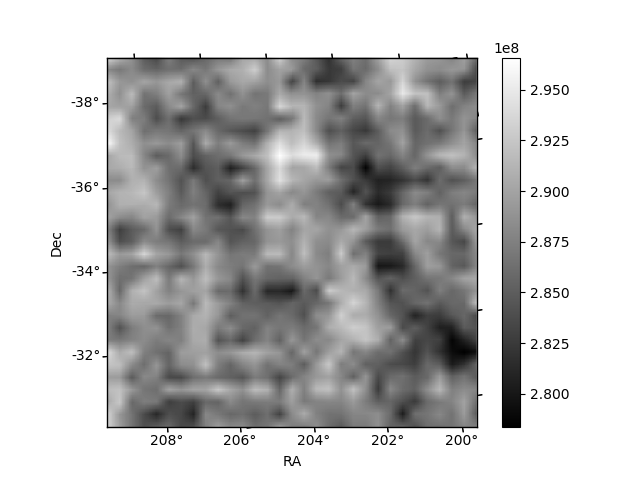
Quadrant B |
|---|---|---|---|
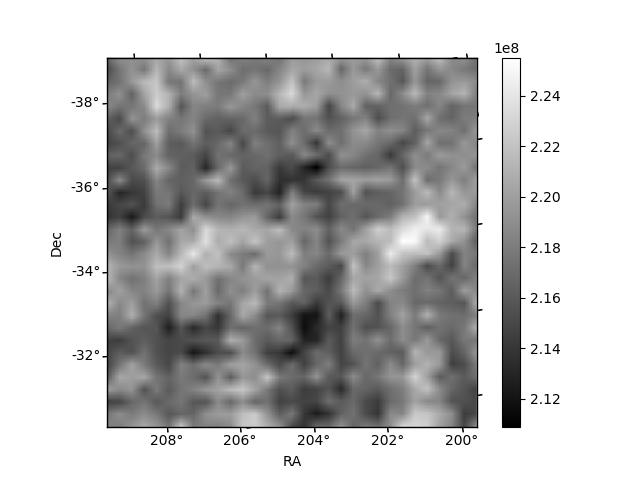
| Quadrant D | 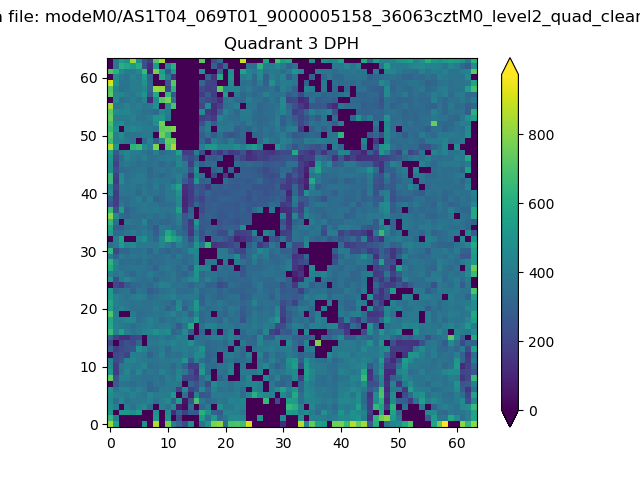 |
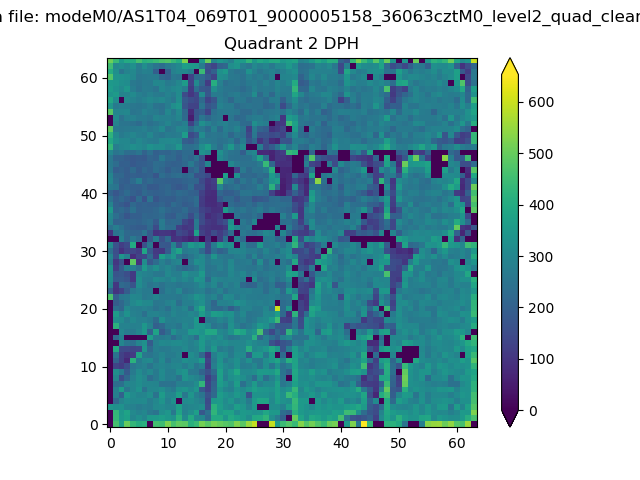 |
Quadrant C |
| Plot type | Count rate plots | Images |
|---|---|---|
| Comparison with Poisson distribution Blue bars denote a histogram of data divided into 1 sec bins. Red curve is a Poisson curve with rate = median count rate of data. |
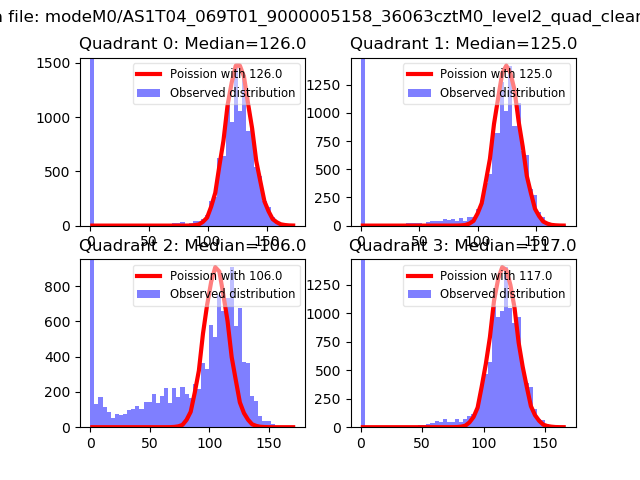 |
 |
| Quadrant-wise count rates Data is divided into 100 sec bins |
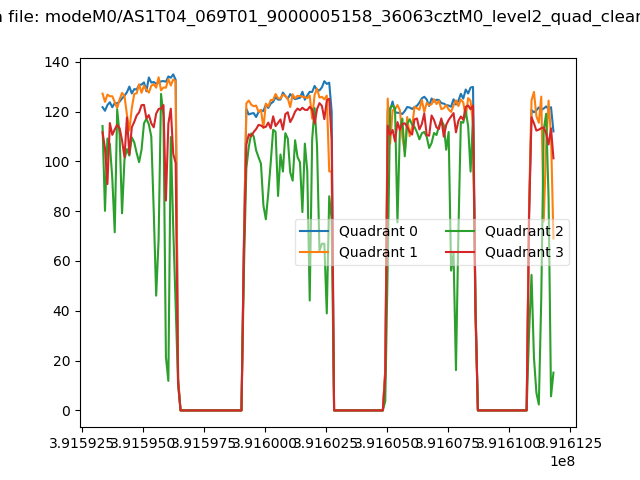 |
|
| Module-wise count rates for Quadrant A Data is divided into 100 sec bins |
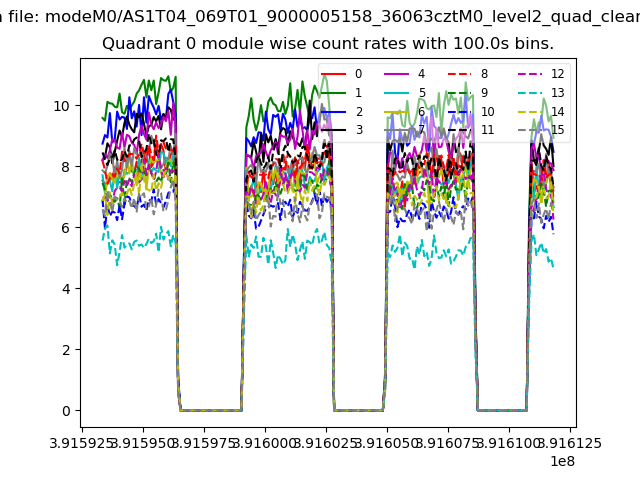 |
 |
| Module-wise count rates for Quadrant B Data is divided into 100 sec bins |
 |
 |
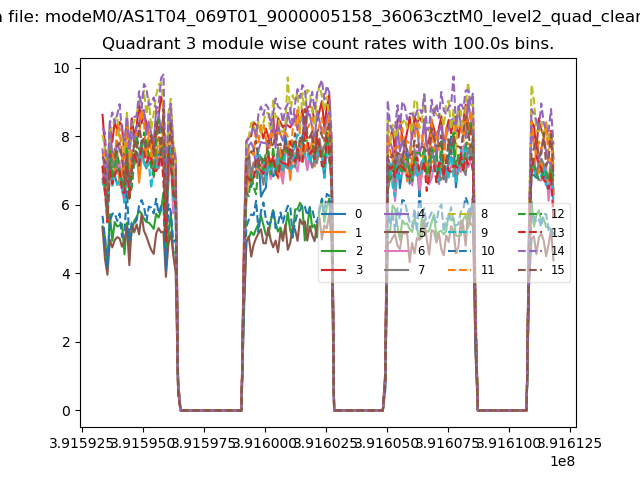
| Module-wise count rates for Quadrant C Data is divided into 100 sec bins |
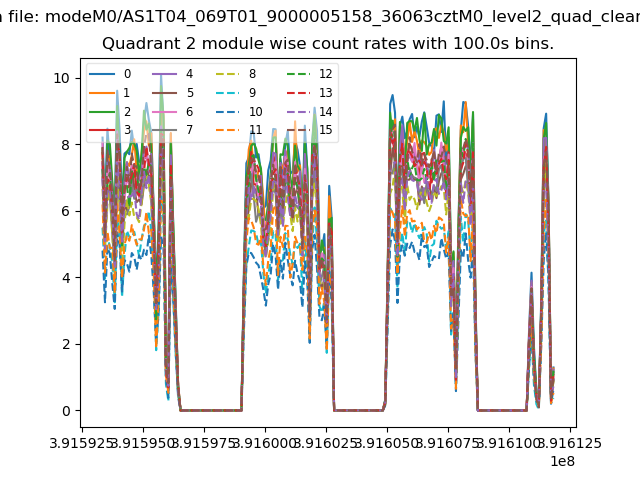 |
 |
| Module-wise count rates for Quadrant D Data is divided into 100 sec bins |
 |
 |
| Parameter | Plot |
|---|---|
| CZT HV Monitor | 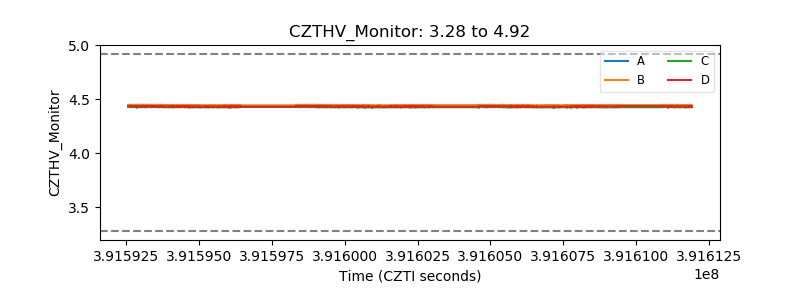 |
| D_VDD |  |
| Temperature 1 | 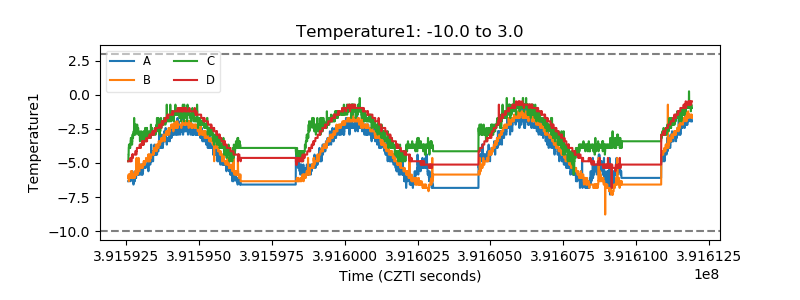 |
| Veto HV Monitor | 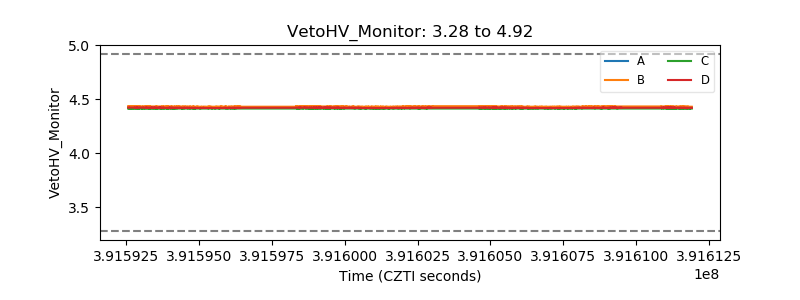 |
| Veto LLD |  |
| Alpha Counter | 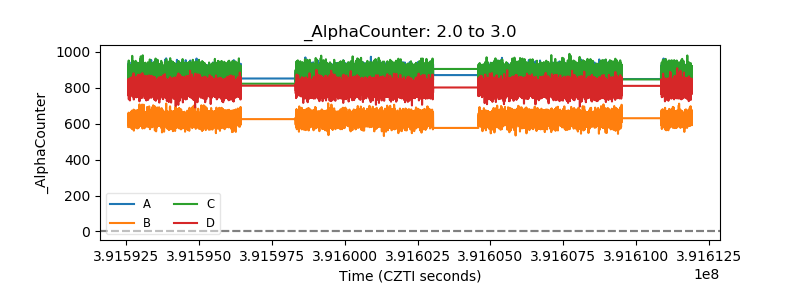 |
| _CPM_Rate | 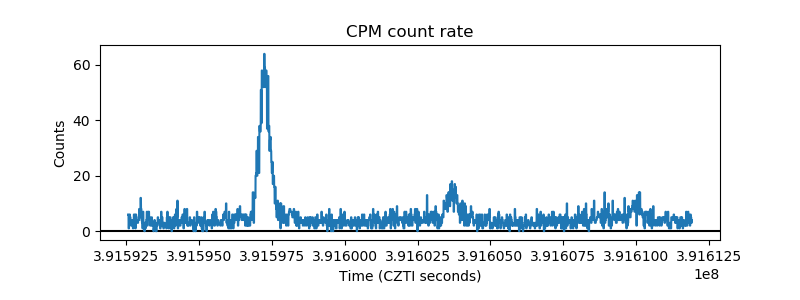 |
| CZT Counter | 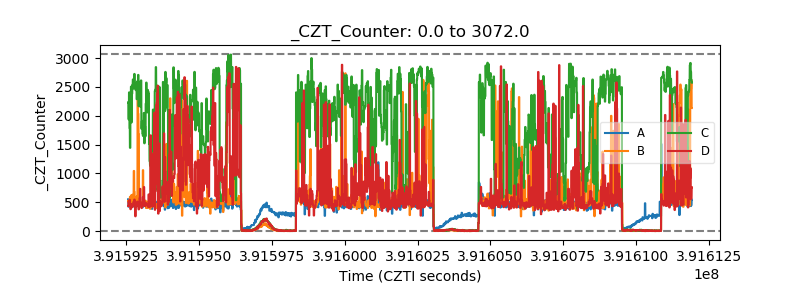 |
| +2.5 Volts monitor |  |
| +5 Volts monitor |  |
| _ROLL_ROT |  |
| _Roll_DEC | 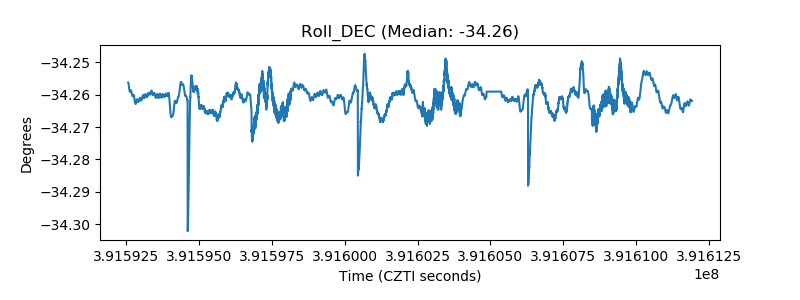 |
| _Roll_RA | 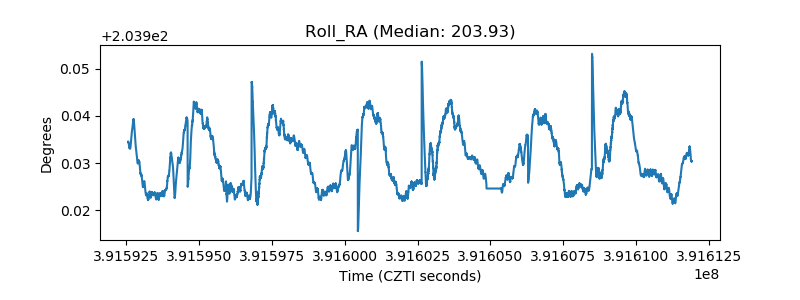 |
| Veto Counter | 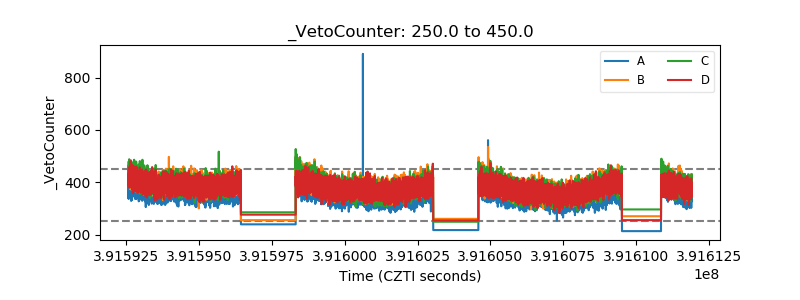 |