| Param | Original file | Final file |
|---|---|---|
| Filename | modeM0/AS1T04_069T01_9000005158_36081cztM0_level2.evt | modeM0/AS1T04_069T01_9000005158_36081cztM0_level2_quad_clean.evt |
| Size (bytes) | 1,196,464,320 | 190,912,320 |
| Size | 1.1 GB | 182.1 MB |
| Events in quadrant A | 7,252,906 | 1,236,329 |
| Events in quadrant B | 8,730,502 | 1,213,479 |
| Events in quadrant C | 8,465,338 | 1,188,021 |
| Events in quadrant D | 10,744,873 | 1,080,134 |
Noise dominated data is calculated using 1-second bins in cleaned event files. If a bin has >2000 counts, and if more than 50% of those come from <1% of pixels, then it is considered to be noise-dominated and hence unusable.
| Quadrant | # 1 sec bins | Bins with >0 counts | Bins with >2000 counts | High rate bins dominated by noise | Noise dominated (total time) | Noise dominated (detector-on time) | Marked lightcurve |
|---|---|---|---|---|---|---|---|
| A | 19676 | 15412 | 1 | 1 | 0.01% | 0.01% | 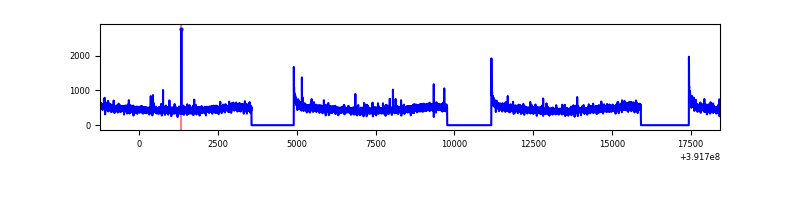 |
| B | 19676 | 15412 | 259 | 259 | 1.32% | 1.68% | 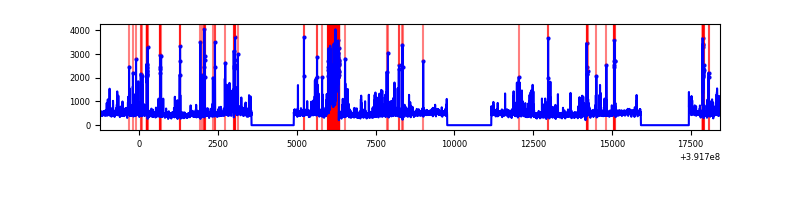 |
| C | 19676 | 15412 | 157 | 157 | 0.80% | 1.02% | 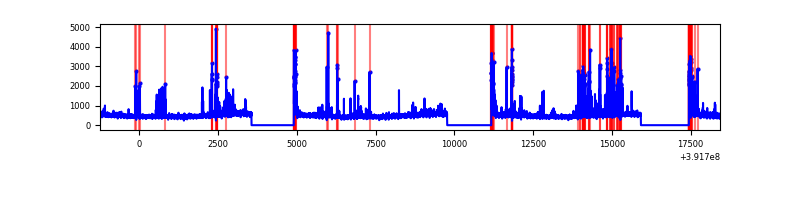 |
| D | 19676 | 15412 | 895 | 895 | 4.55% | 5.81% | 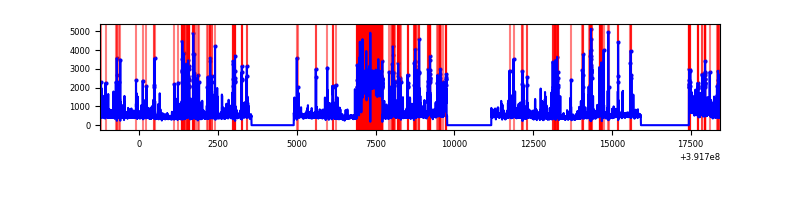 |
Top three noisy pixels from each quadrant. If the there are fewer than three noisy pixels in the level2.evt file, extra rows are filled as -1
| Pixel properties | Quadrant properties | ||||||
|---|---|---|---|---|---|---|---|
| Quadrant | DetID | PixID | Counts | Sigma | Mean | Median | Sigma |
| A | 10 | 83 | 409174 | 1143.6 | 1757 | 1723 | 356.3 |
| A | 13 | 6 | 35079 | 93.62 | 1757 | 1723 | 356.3 |
| A | 13 | 254 | 19273 | 49.26 | 1757 | 1723 | 356.3 |
| B | 5 | 172 | 1160744 | 3479.46 | 1727 | 1684 | 333.1 |
| B | 4 | 232 | 179197 | 532.89 | 1727 | 1684 | 333.1 |
| B | 0 | 190 | 158271 | 470.07 | 1727 | 1684 | 333.1 |
| C | 15 | 208 | 871271 | 2226.69 | 1679 | 1688 | 390.5 |
| C | 15 | 214 | 632018 | 1614.05 | 1679 | 1688 | 390.5 |
| C | 0 | 10 | 343086 | 874.2 | 1679 | 1688 | 390.5 |
| D | 1 | 52 | 2270886 | 5731.72 | 1621 | 1574 | 395.9 |
| D | 12 | 6 | 634390 | 1598.34 | 1621 | 1574 | 395.9 |
| D | 12 | 233 | 316944 | 796.55 | 1621 | 1574 | 395.9 |
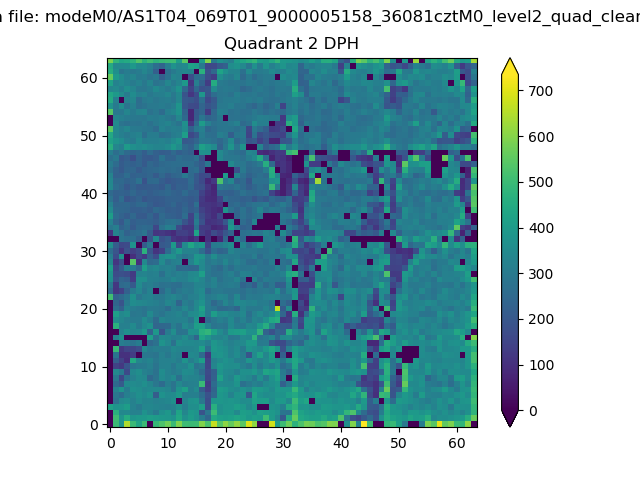
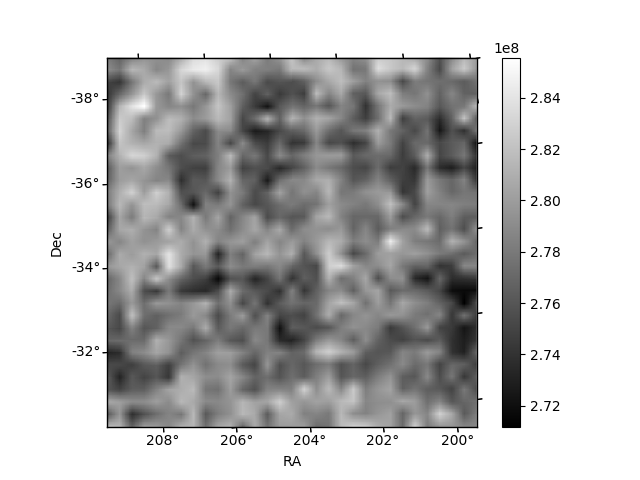
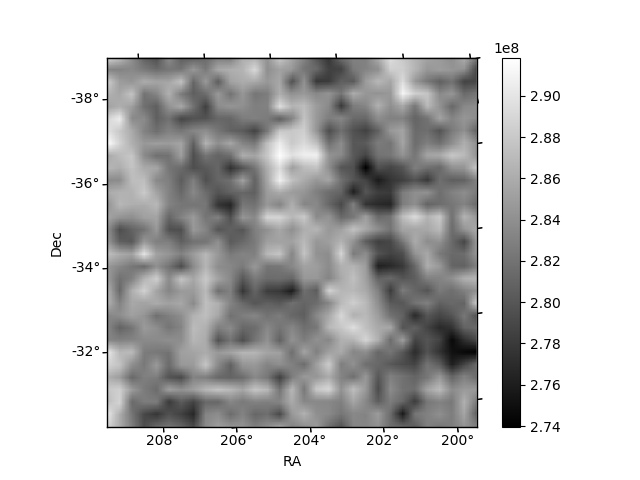
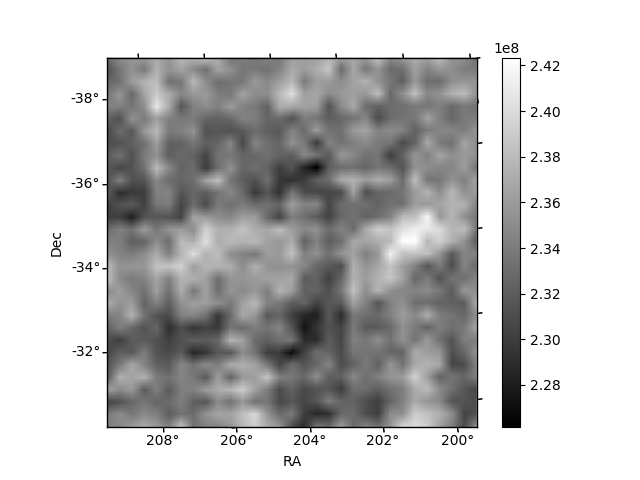
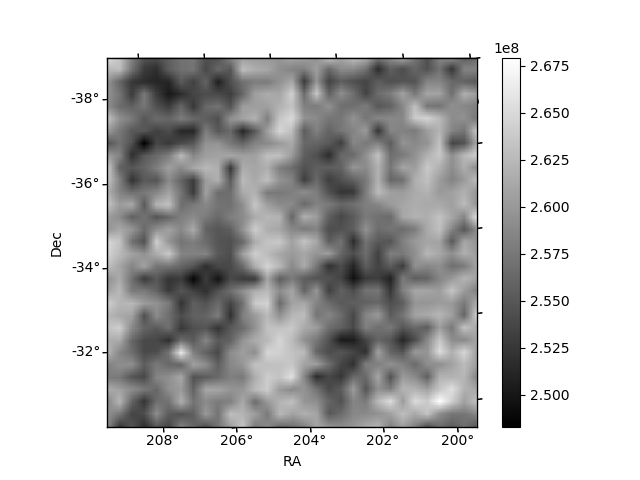
Histogram calculated using DETX and DETY for each event in the final _common_clean file
| Quadrant A | 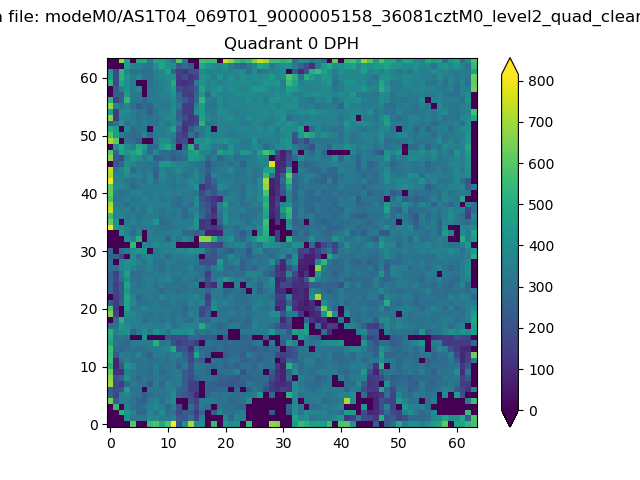 |
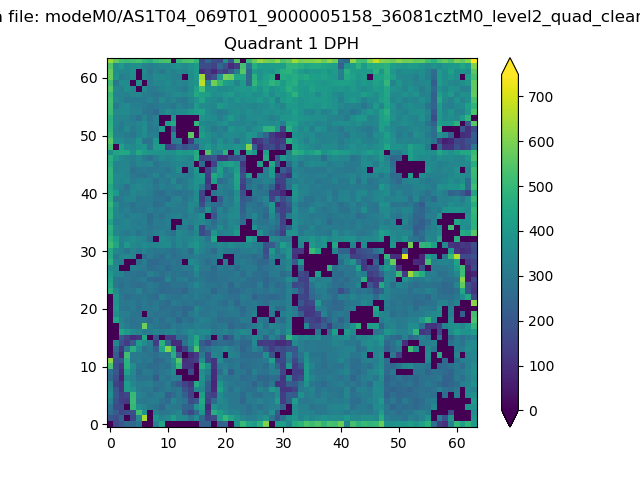 |
Quadrant B |
|---|---|---|---|
| Quadrant D | 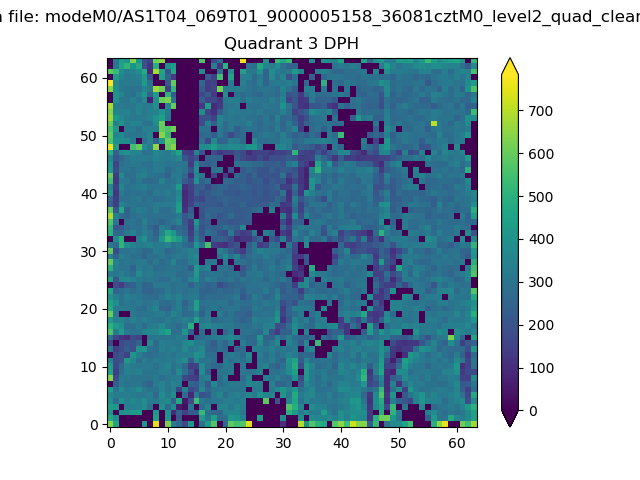 |
 |
Quadrant C |
| Plot type | Count rate plots | Images |
|---|---|---|
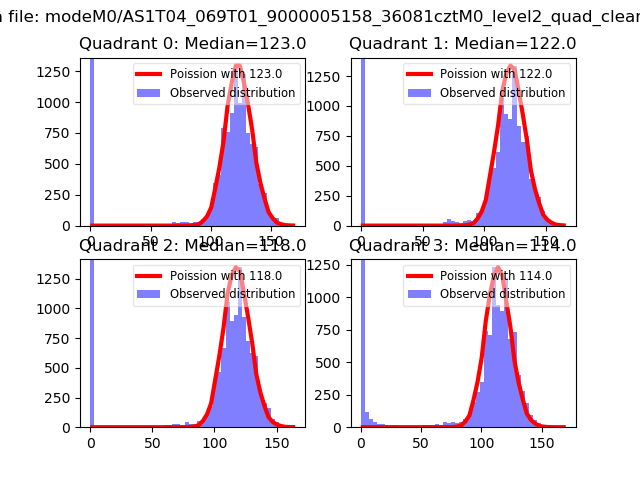
| Comparison with Poisson distribution Blue bars denote a histogram of data divided into 1 sec bins. Red curve is a Poisson curve with rate = median count rate of data. |
 |
 |
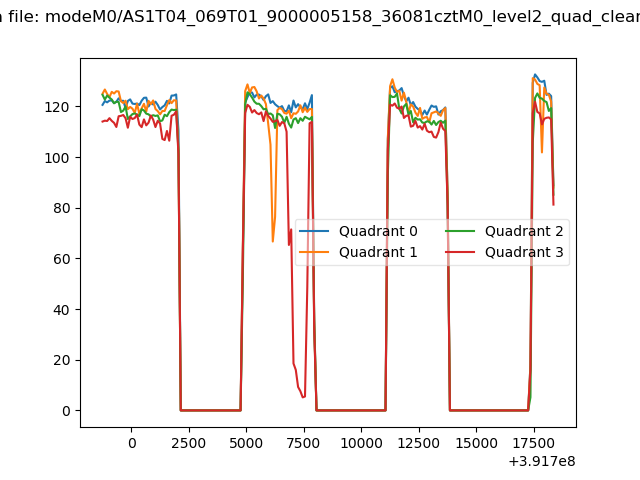
| Quadrant-wise count rates Data is divided into 100 sec bins |
 |
|
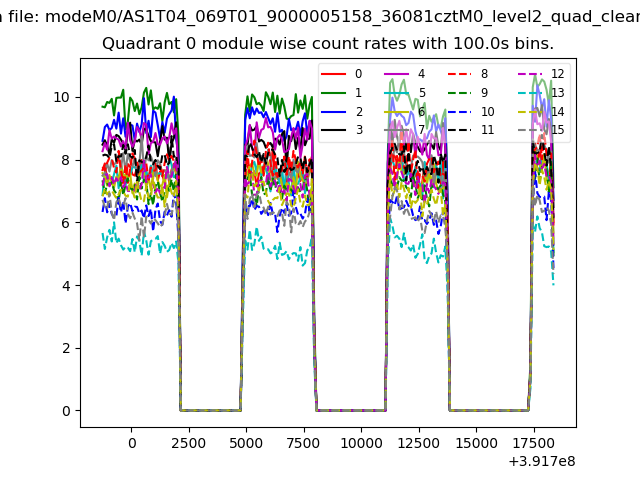
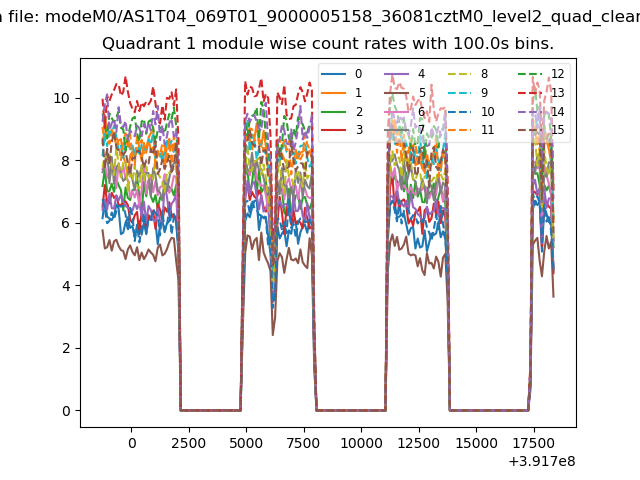
| Module-wise count rates for Quadrant A Data is divided into 100 sec bins |
 |
 |
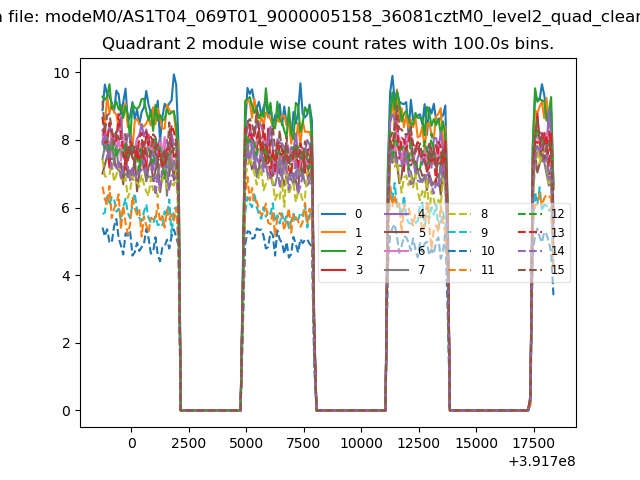
| Module-wise count rates for Quadrant B Data is divided into 100 sec bins |
 |
 |
| Module-wise count rates for Quadrant C Data is divided into 100 sec bins |
 |
 |
| Module-wise count rates for Quadrant D Data is divided into 100 sec bins |
 |
 |
| Parameter | Plot |
|---|---|
| CZT HV Monitor | 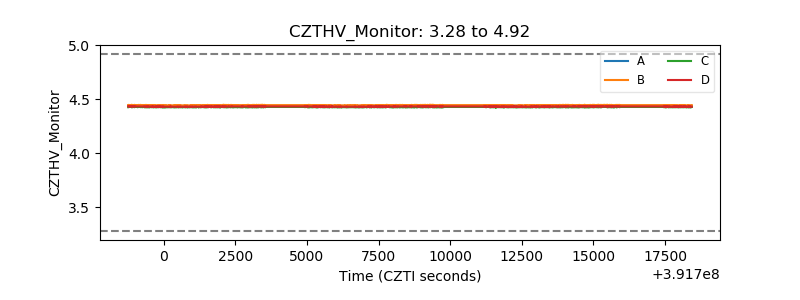 |
| D_VDD | 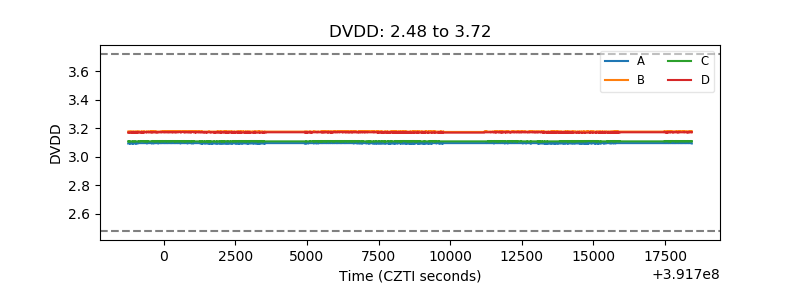 |
| Temperature 1 |  |
| Veto HV Monitor | 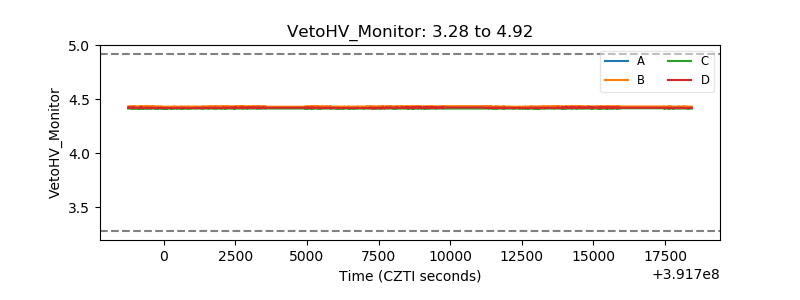 |
| Veto LLD | 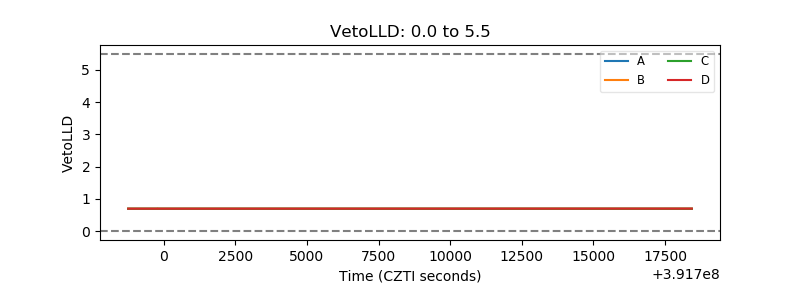 |
| Alpha Counter | 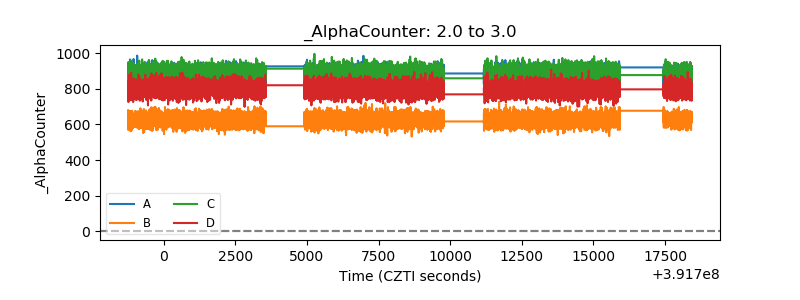 |
| _CPM_Rate | 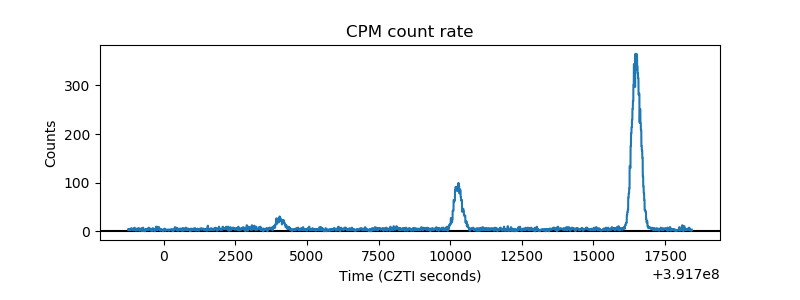 |
| CZT Counter | 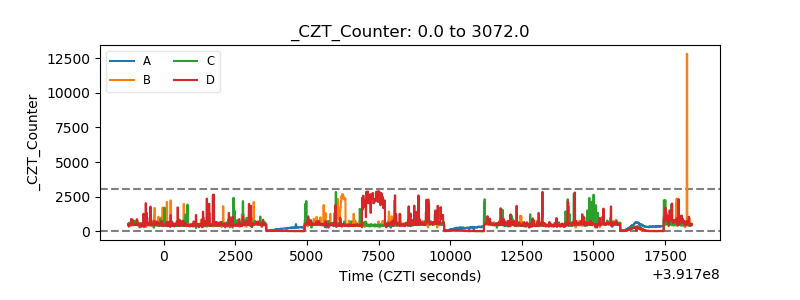 |
| +2.5 Volts monitor |  |
| +5 Volts monitor |  |
| _ROLL_ROT | 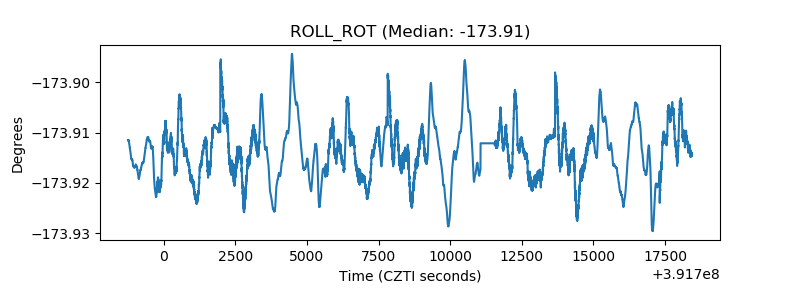 |
| _Roll_DEC | 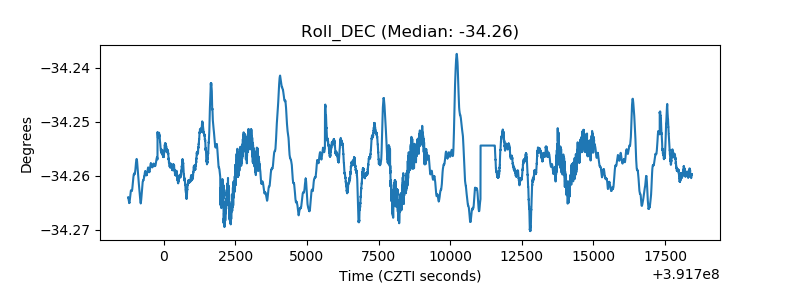 |
| _Roll_RA | 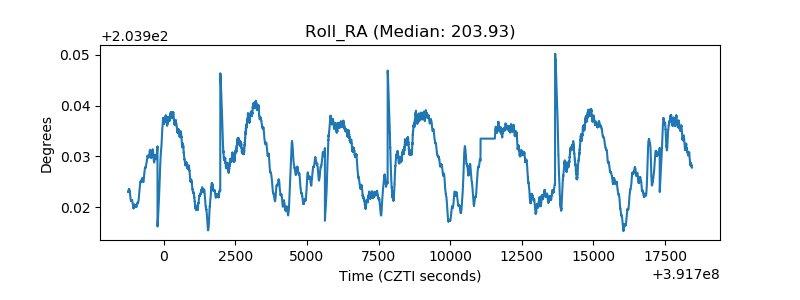 |
| Veto Counter |  |