| Param | Original file | Final file |
|---|---|---|
| Filename | modeM0/AS1T04_069T01_9000005158_36082cztM0_level2.evt | modeM0/AS1T04_069T01_9000005158_36082cztM0_level2_quad_clean.evt |
| Size (bytes) | 411,560,640 | 65,505,600 |
| Size | 392.5 MB | 62.5 MB |
| Events in quadrant A | 2,623,551 | 415,037 |
| Events in quadrant B | 2,888,593 | 409,363 |
| Events in quadrant C | 3,049,635 | 391,228 |
| Events in quadrant D | 3,528,918 | 383,360 |
Noise dominated data is calculated using 1-second bins in cleaned event files. If a bin has >2000 counts, and if more than 50% of those come from <1% of pixels, then it is considered to be noise-dominated and hence unusable.
| Quadrant | # 1 sec bins | Bins with >0 counts | Bins with >2000 counts | High rate bins dominated by noise | Noise dominated (total time) | Noise dominated (detector-on time) | Marked lightcurve |
|---|---|---|---|---|---|---|---|
| A | 7105 | 5494 | 0 | 0 | 0.00% | 0.00% | 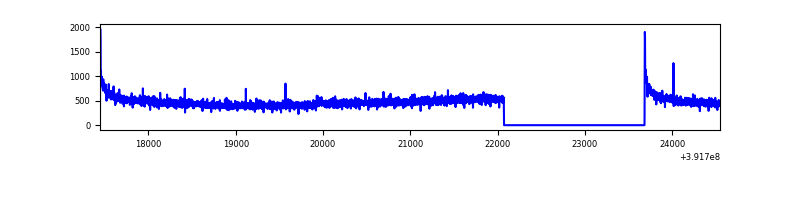 |
| B | 7105 | 5494 | 28 | 28 | 0.39% | 0.51% | 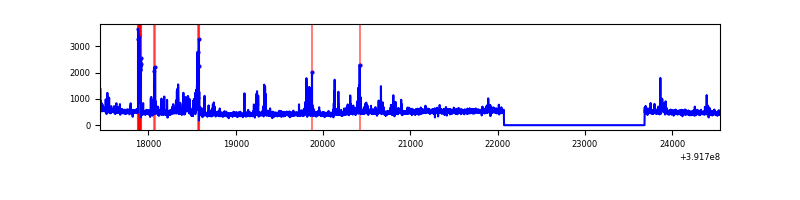 |
| C | 7105 | 5494 | 96 | 96 | 1.35% | 1.75% | 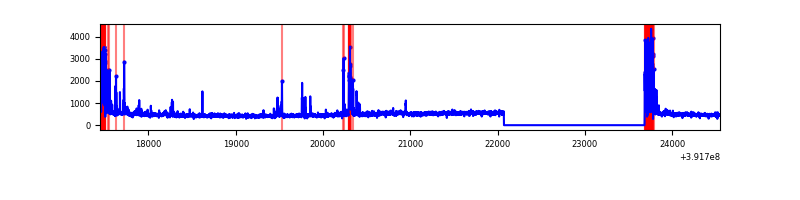 |
| D | 7105 | 5494 | 100 | 100 | 1.41% | 1.82% |  |
Top three noisy pixels from each quadrant. If the there are fewer than three noisy pixels in the level2.evt file, extra rows are filled as -1
| Pixel properties | Quadrant properties | ||||||
|---|---|---|---|---|---|---|---|
| Quadrant | DetID | PixID | Counts | Sigma | Mean | Median | Sigma |
| A | 10 | 83 | 183462 | 1445.84 | 626 | 613 | 126.5 |
| A | 13 | 6 | 12182 | 91.48 | 626 | 613 | 126.5 |
| A | 13 | 254 | 6587 | 47.24 | 626 | 613 | 126.5 |
| B | 5 | 172 | 173134 | 1422.38 | 622 | 607 | 121.3 |
| B | 4 | 232 | 71203 | 582.02 | 622 | 607 | 121.3 |
| B | 0 | 190 | 61415 | 501.32 | 622 | 607 | 121.3 |
| C | 0 | 10 | 328104 | 2321.72 | 596 | 598 | 141.1 |
| C | 15 | 214 | 227219 | 1606.54 | 596 | 598 | 141.1 |
| C | 15 | 208 | 157968 | 1115.61 | 596 | 598 | 141.1 |
| D | 1 | 52 | 543090 | 3688.64 | 597 | 582 | 147.1 |
| D | 13 | 249 | 172859 | 1171.35 | 597 | 582 | 147.1 |
| D | 12 | 6 | 143954 | 974.82 | 597 | 582 | 147.1 |
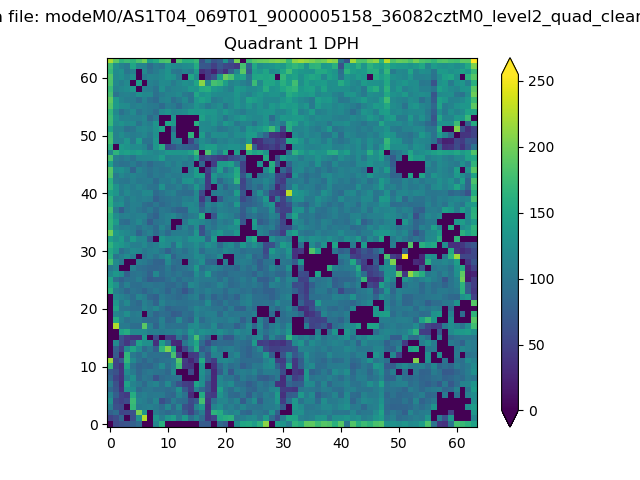
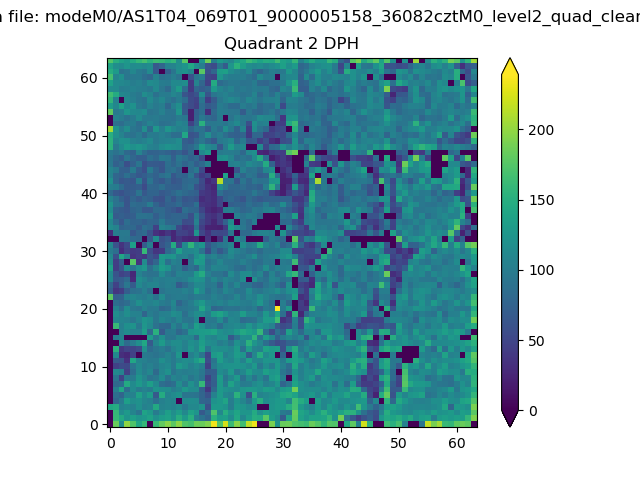
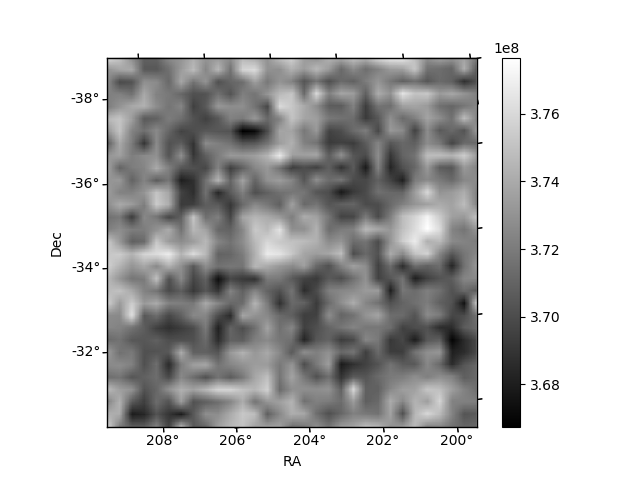
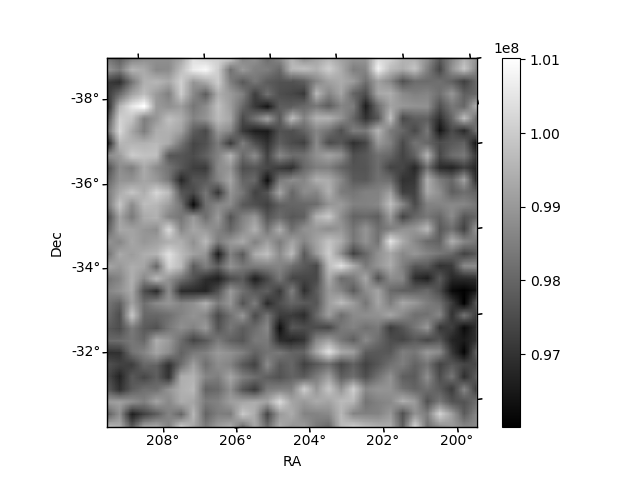
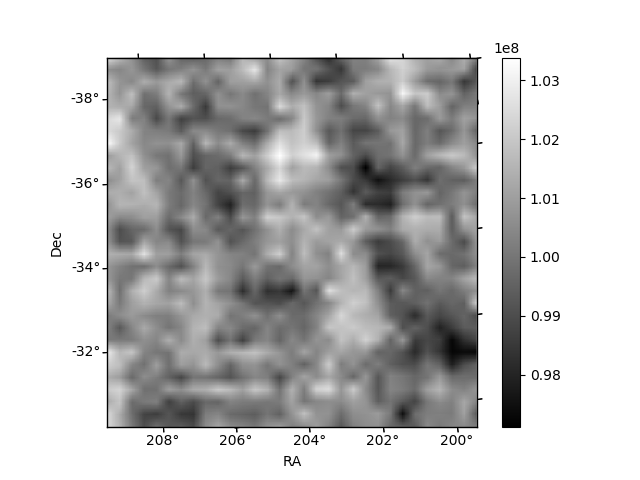
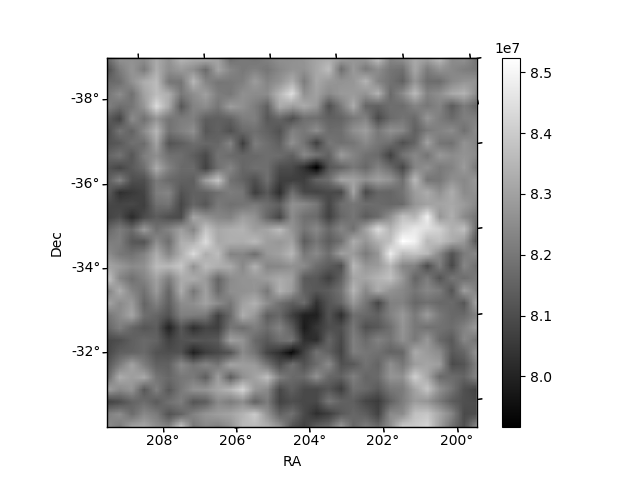
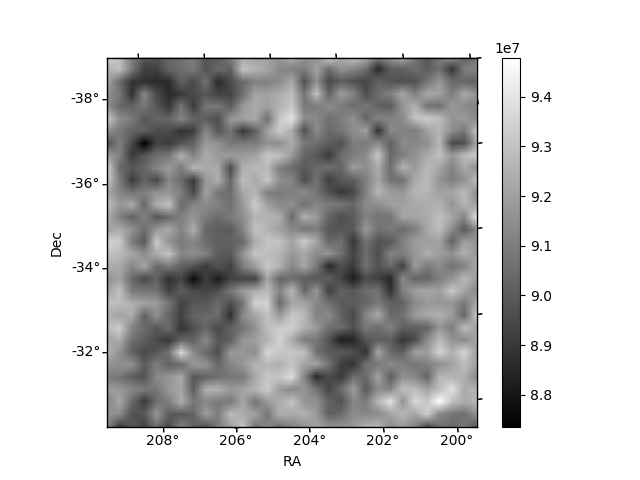
Histogram calculated using DETX and DETY for each event in the final _common_clean file
| Quadrant A | 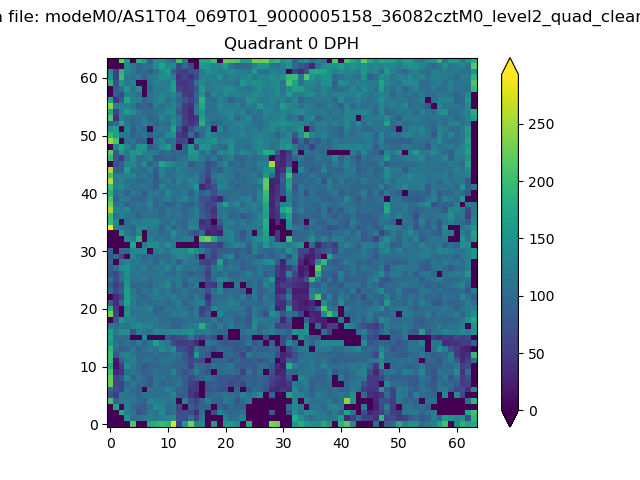 |
 |
Quadrant B |
|---|---|---|---|
| Quadrant D | 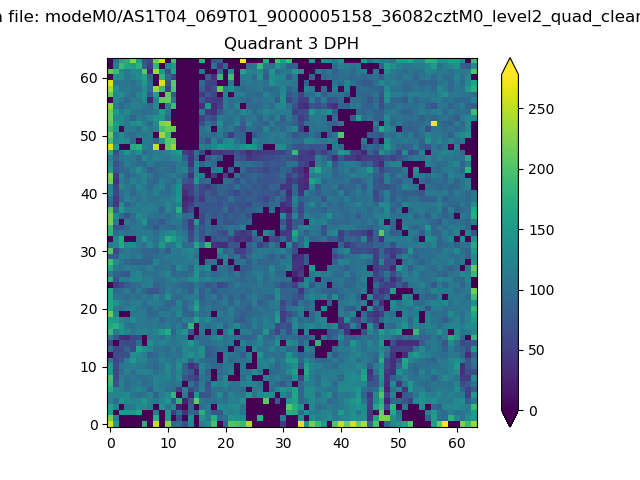 |
 |
Quadrant C |
| Plot type | Count rate plots | Images |
|---|---|---|
| Comparison with Poisson distribution Blue bars denote a histogram of data divided into 1 sec bins. Red curve is a Poisson curve with rate = median count rate of data. |
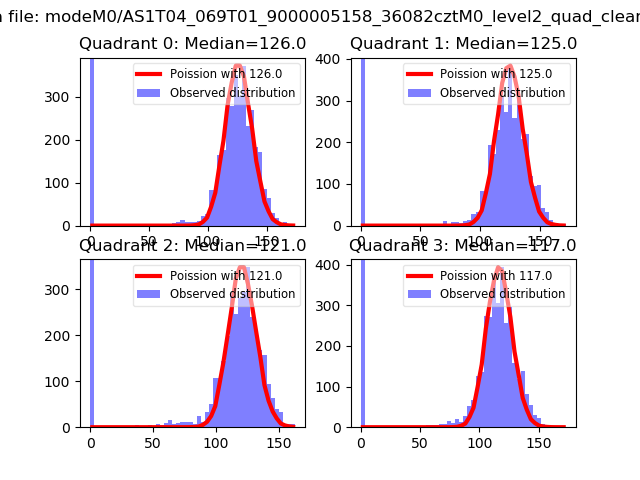 |
 |
| Quadrant-wise count rates Data is divided into 100 sec bins |
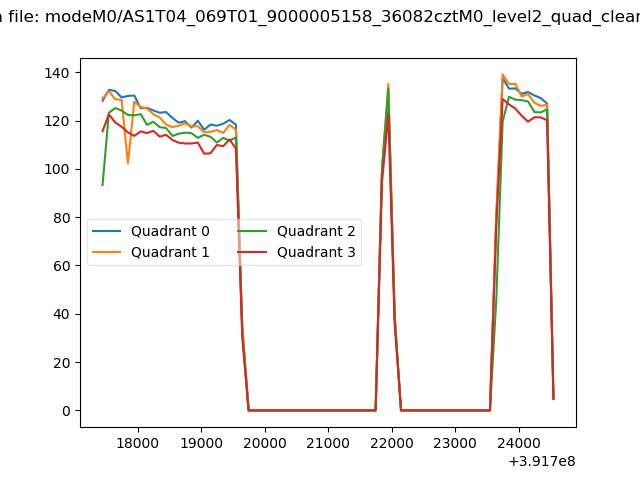 |
|
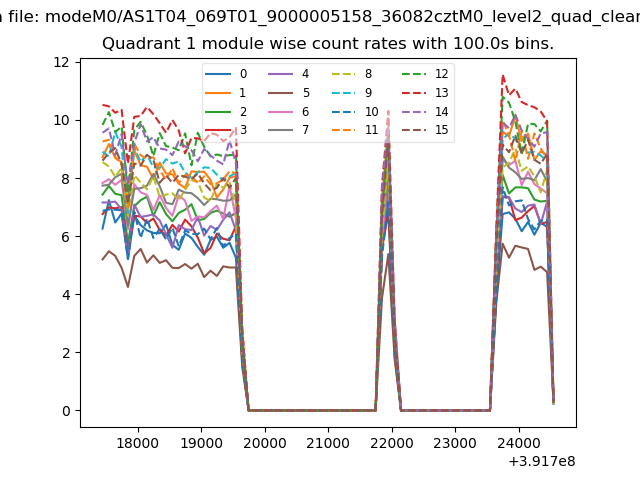
| Module-wise count rates for Quadrant A Data is divided into 100 sec bins |
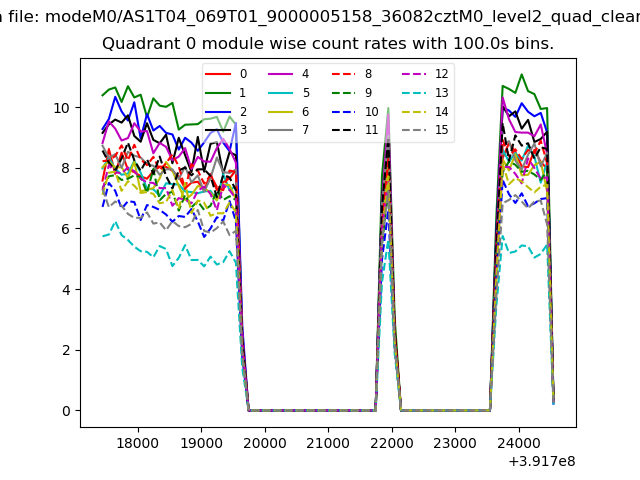 |
 |
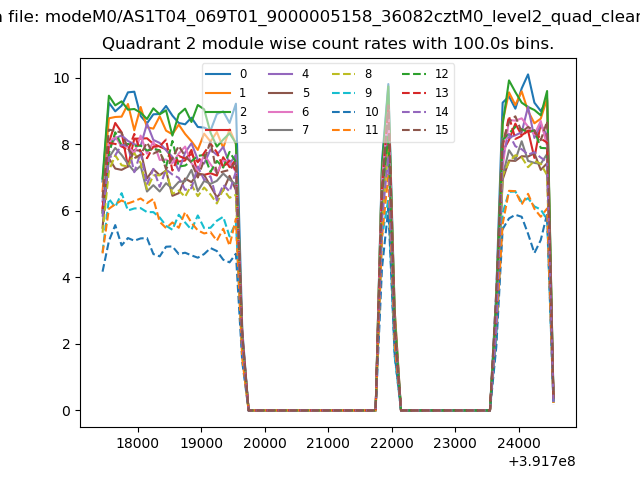
| Module-wise count rates for Quadrant B Data is divided into 100 sec bins |
 |
 |
| Module-wise count rates for Quadrant C Data is divided into 100 sec bins |
 |
 |
| Module-wise count rates for Quadrant D Data is divided into 100 sec bins |
 |
 |
| Parameter | Plot |
|---|---|
| CZT HV Monitor | 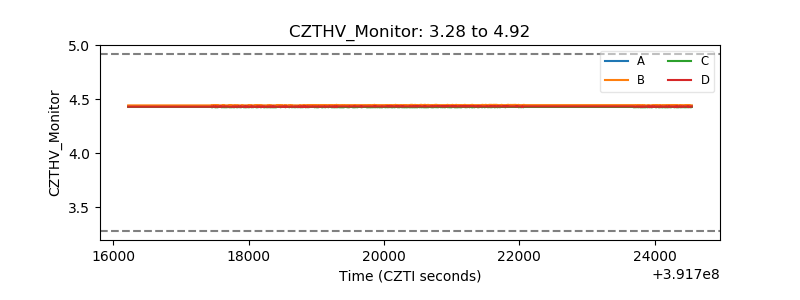 |
| D_VDD | 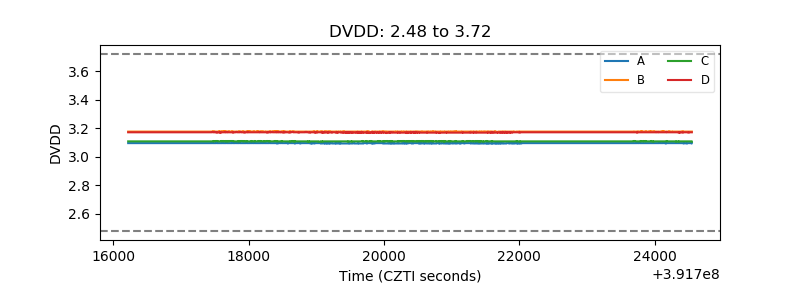 |
| Temperature 1 | 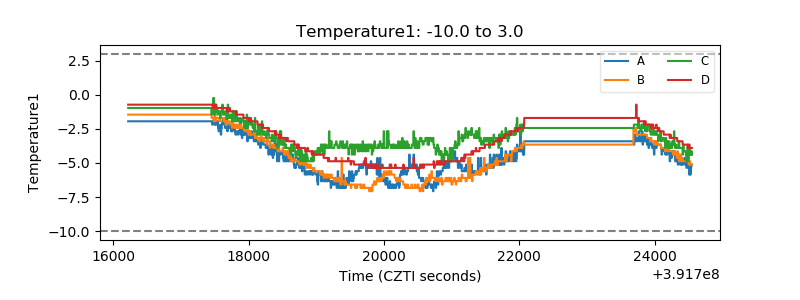 |
| Veto HV Monitor | 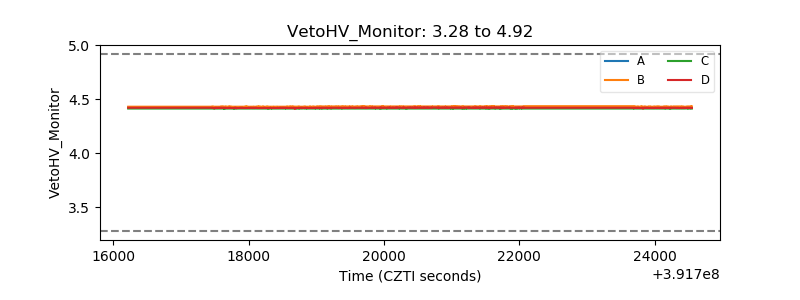 |
| Veto LLD | 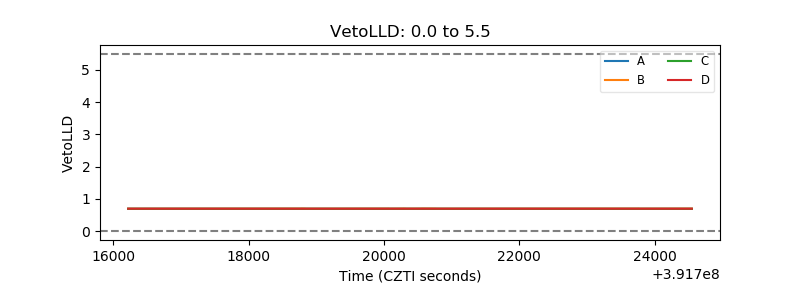 |
| Alpha Counter | 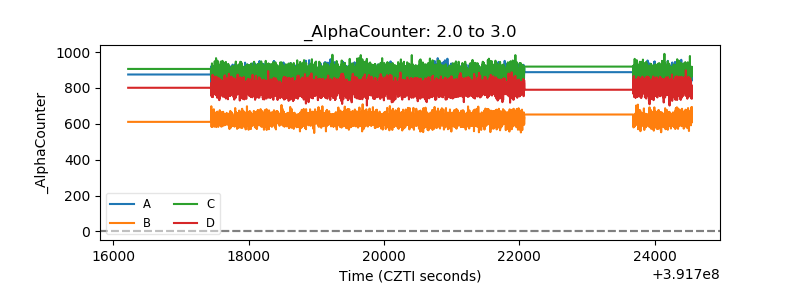 |
| _CPM_Rate | 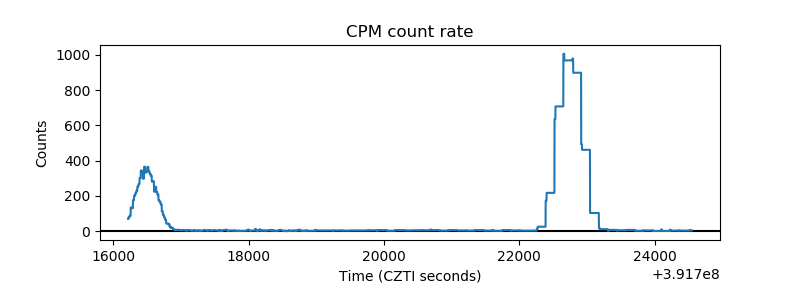 |
| CZT Counter | 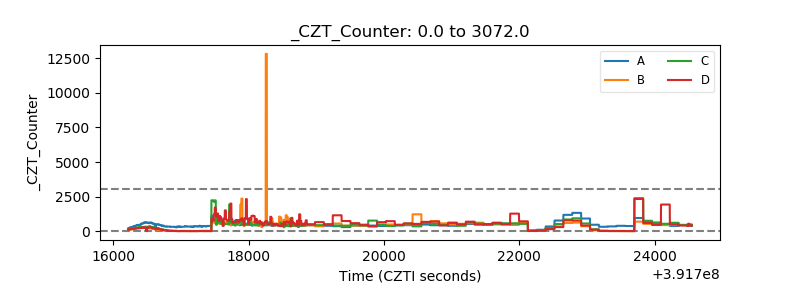 |
| +2.5 Volts monitor |  |
| +5 Volts monitor | 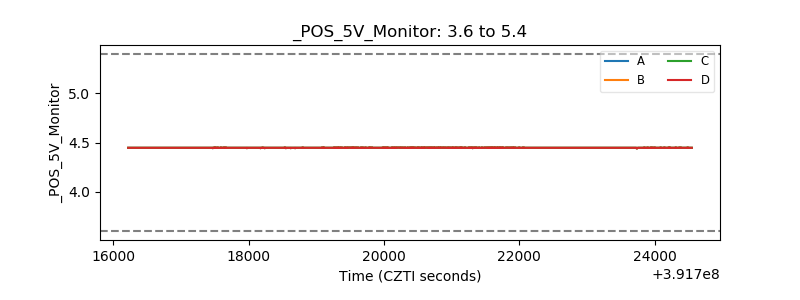 |
| _ROLL_ROT | 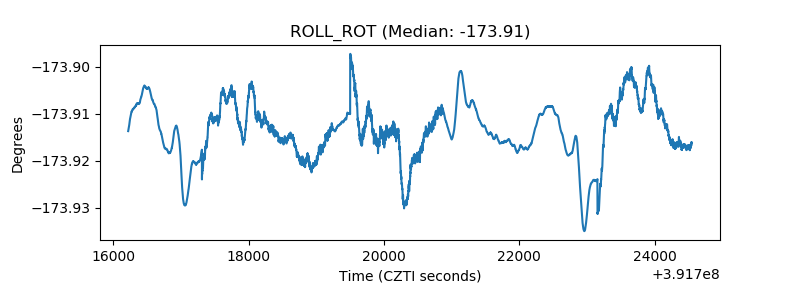 |
| _Roll_DEC | 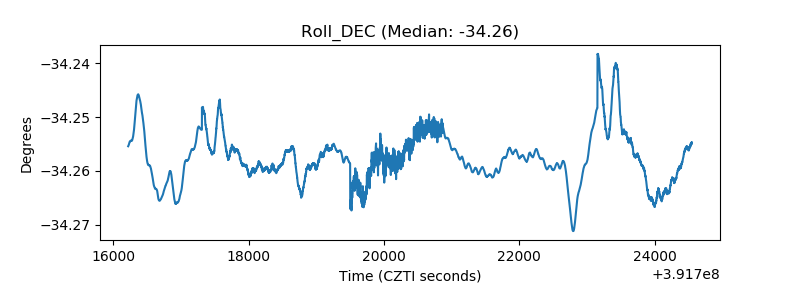 |
| _Roll_RA | 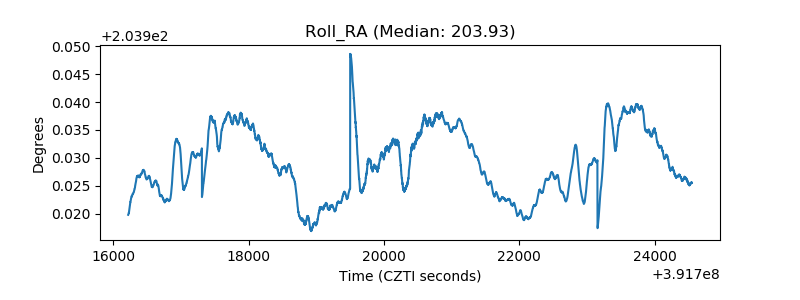 |
| Veto Counter |  |