| Param | Original file | Final file |
|---|---|---|
| Filename | modeM0/AS1T04_069T01_9000005158_36101cztM0_level2.evt | modeM0/AS1T04_069T01_9000005158_36101cztM0_level2_quad_clean.evt |
| Size (bytes) | 474,143,040 | 57,101,760 |
| Size | 452.2 MB | 54.5 MB |
| Events in quadrant A | 2,644,182 | 357,973 |
| Events in quadrant B | 3,906,247 | 357,820 |
| Events in quadrant C | 3,396,322 | 344,134 |
| Events in quadrant D | 4,068,415 | 312,974 |
| Mode M0 | |||
|---|---|---|---|
| Quadrant | BADHDUFLAG | Total packets | Discarded packets |
| A | 0 | 10841 | 3 |
| B | 0 | 14790 | 2 |
| C | 0 | 13003 | 2 |
| D | 0 | 15454 | 2 |
| Mode M9 | |||
|---|---|---|---|
| Quadrant | BADHDUFLAG | Total packets | Discarded packets |
| A | 0 | 34 | 0 |
| B | 0 | 34 | 0 |
| C | 0 | 34 | 0 |
| D | 0 | 35 | 0 |
| Mode SS | |||
|---|---|---|---|
| Quadrant | BADHDUFLAG | Total packets | Discarded packets |
| A | 0 | 102 | 0 |
| B | 0 | 102 | 0 |
| C | 0 | 102 | 0 |
| D | 0 | 102 | 0 |
| Quadrant | Total seconds | Saturated seconds | Saturation percentage |
|---|---|---|---|
| A | 5079 | 25 | 0.492223% |
| B | 5079 | 399 | 7.855877% |
| C | 5079 | 168 | 3.307738% |
| D | 5079 | 443 | 8.722189% |
Noise dominated data is calculated using 1-second bins in cleaned event files. If a bin has >2000 counts, and if more than 50% of those come from <1% of pixels, then it is considered to be noise-dominated and hence unusable.
| Quadrant | # 1 sec bins | Bins with >0 counts | Bins with >2000 counts | High rate bins dominated by noise | Noise dominated (total time) | Noise dominated (detector-on time) | Marked lightcurve |
|---|---|---|---|---|---|---|---|
| A | 7112 | 5080 | 8 | 8 | 0.11% | 0.16% | 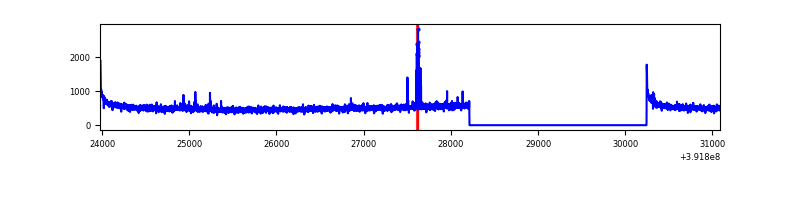 |
| B | 7112 | 5080 | 297 | 297 | 4.18% | 5.85% | 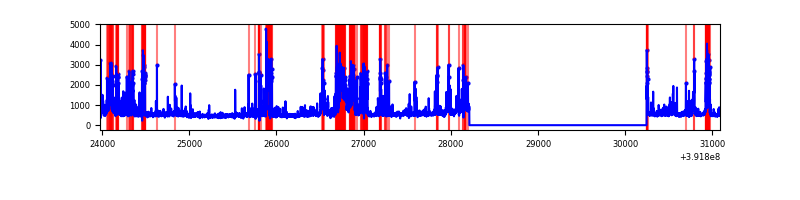 |
| C | 7112 | 5080 | 157 | 157 | 2.21% | 3.09% | 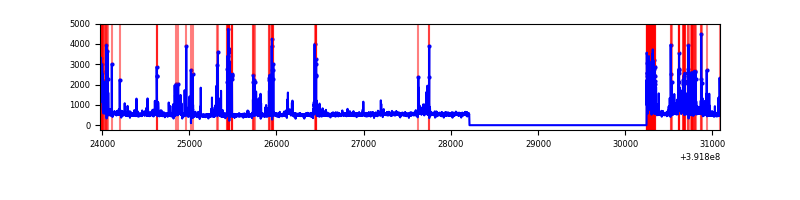 |
| D | 7111 | 5078 | 376 | 376 | 5.29% | 7.40% | 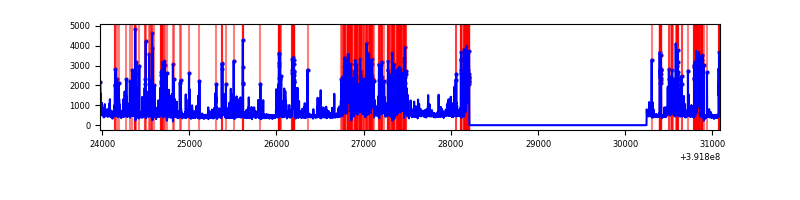 |
Top three noisy pixels from each quadrant. If the there are fewer than three noisy pixels in the level2.evt file, extra rows are filled as -1
| Pixel properties | Quadrant properties | ||||||
|---|---|---|---|---|---|---|---|
| Quadrant | DetID | PixID | Counts | Sigma | Mean | Median | Sigma |
| A | 10 | 83 | 166955 | 1336.09 | 618 | 606 | 124.5 |
| A | 15 | 223 | 53456 | 424.48 | 618 | 606 | 124.5 |
| A | 9 | 143 | 16030 | 123.88 | 618 | 606 | 124.5 |
| B | 5 | 172 | 796486 | 6929.52 | 603 | 589 | 114.9 |
| B | 5 | 236 | 516157 | 4488.82 | 603 | 589 | 114.9 |
| B | 5 | 255 | 79203 | 684.46 | 603 | 589 | 114.9 |
| C | 0 | 207 | 469639 | 3399.77 | 596 | 602 | 138.0 |
| C | 15 | 214 | 228265 | 1650.19 | 596 | 602 | 138.0 |
| C | 0 | 10 | 209170 | 1511.79 | 596 | 602 | 138.0 |
| D | 1 | 52 | 949417 | 6779.98 | 573 | 558 | 140.0 |
| D | 12 | 6 | 485857 | 3467.66 | 573 | 558 | 140.0 |
| D | 13 | 249 | 163936 | 1167.4 | 573 | 558 | 140.0 |
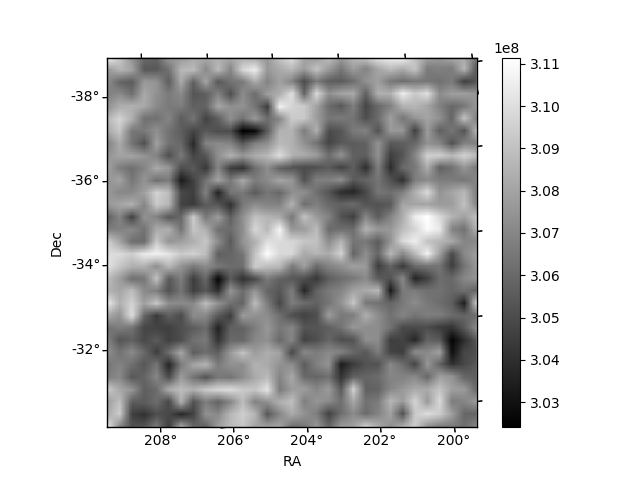
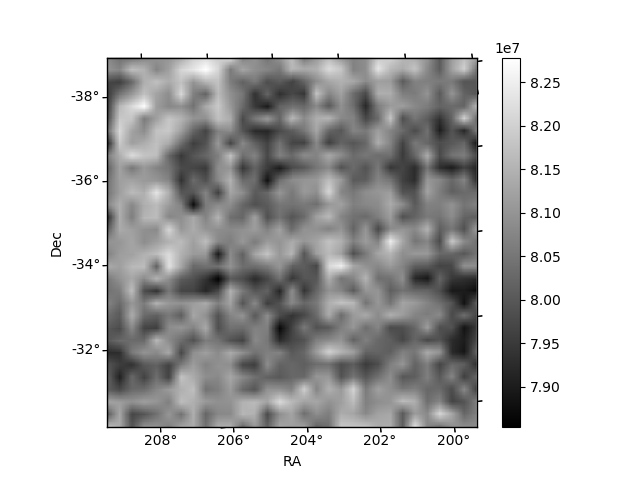
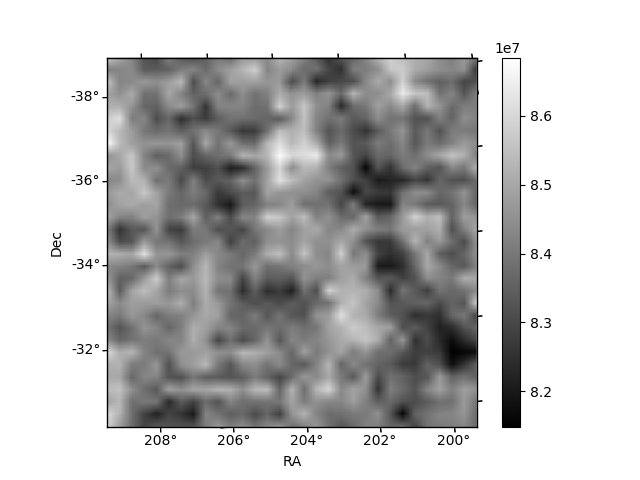
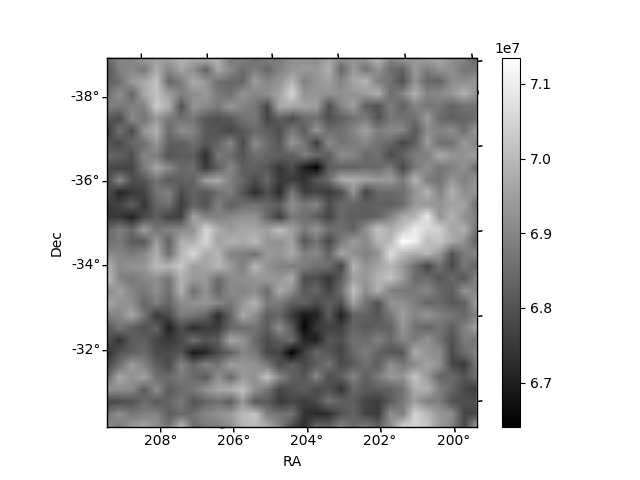
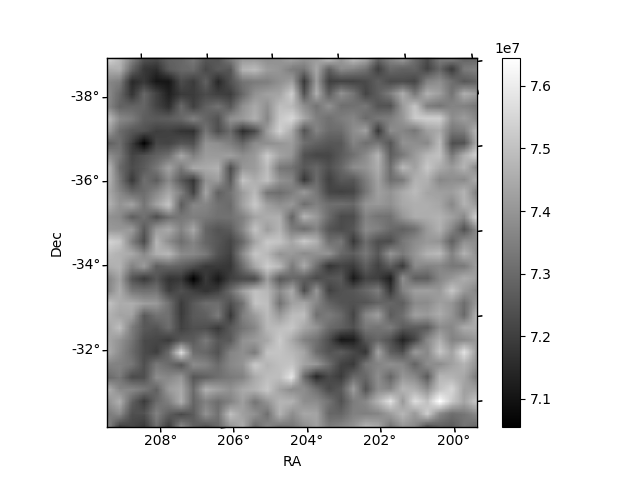
Histogram calculated using DETX and DETY for each event in the final _common_clean file
| Quadrant A | 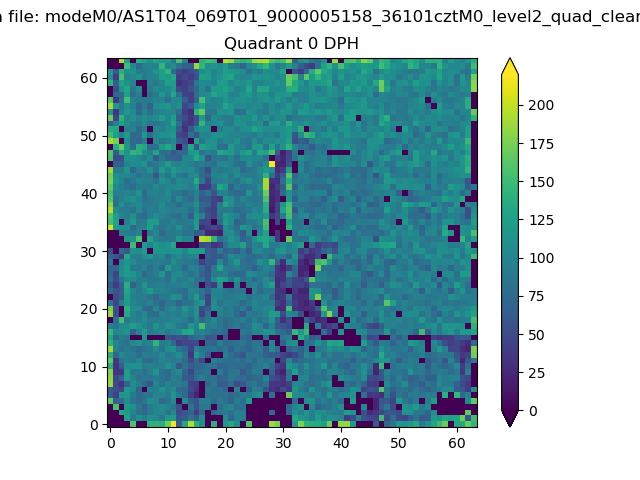 |
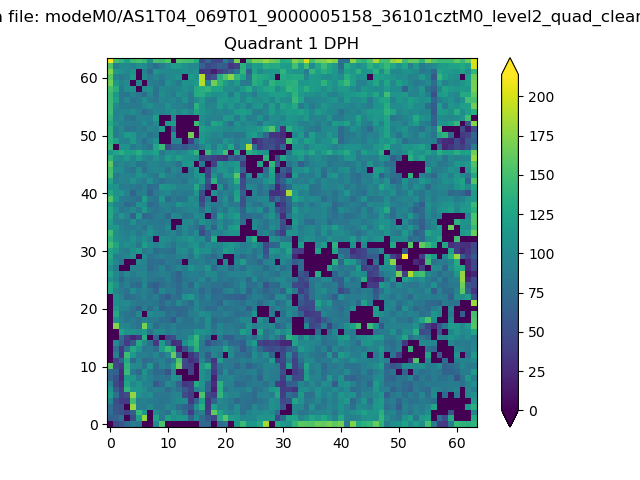 |
Quadrant B |
|---|---|---|---|
| Quadrant D |  |
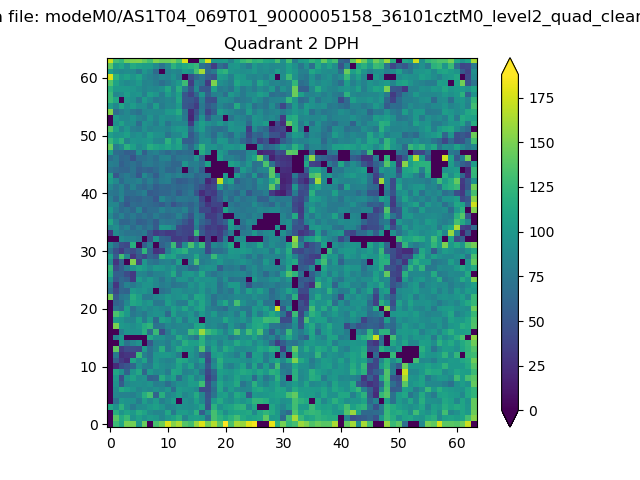 |
Quadrant C |
| Plot type | Count rate plots | Images |
|---|---|---|
| Comparison with Poisson distribution Blue bars denote a histogram of data divided into 1 sec bins. Red curve is a Poisson curve with rate = median count rate of data. |
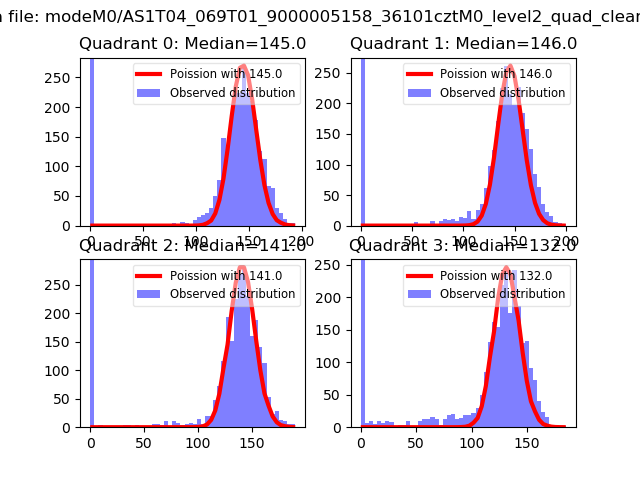 |
 |
| Quadrant-wise count rates Data is divided into 100 sec bins |
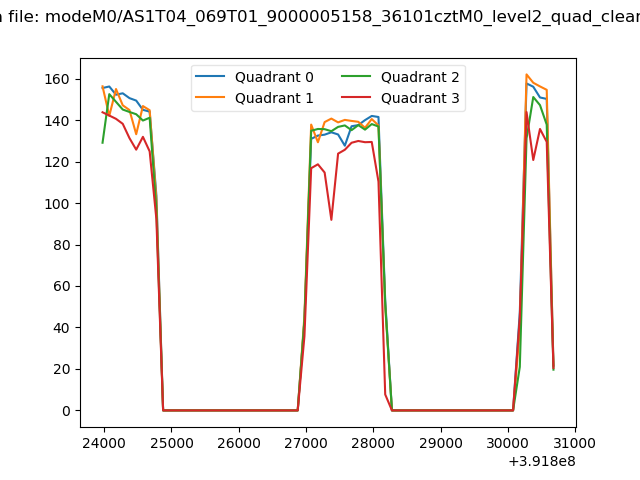 |
|
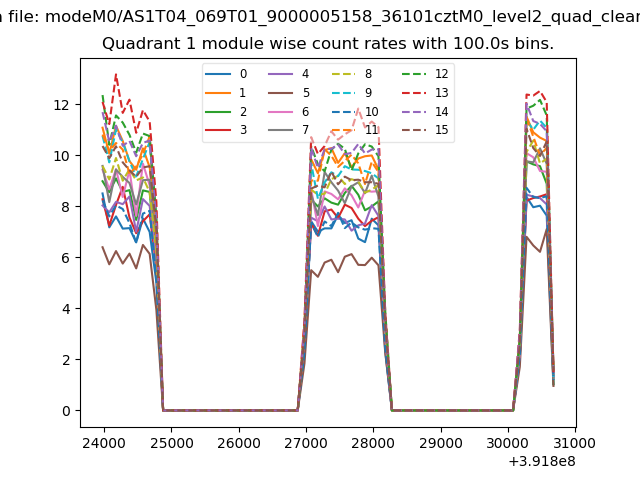
| Module-wise count rates for Quadrant A Data is divided into 100 sec bins |
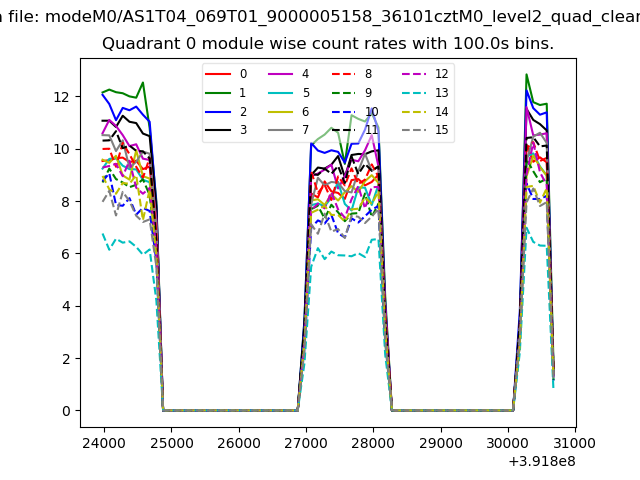 |
 |
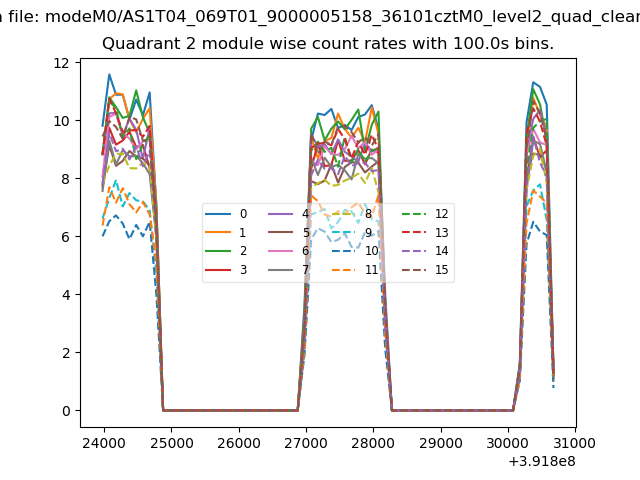
| Module-wise count rates for Quadrant B Data is divided into 100 sec bins |
 |
 |
| Module-wise count rates for Quadrant C Data is divided into 100 sec bins |
 |
 |
| Module-wise count rates for Quadrant D Data is divided into 100 sec bins |
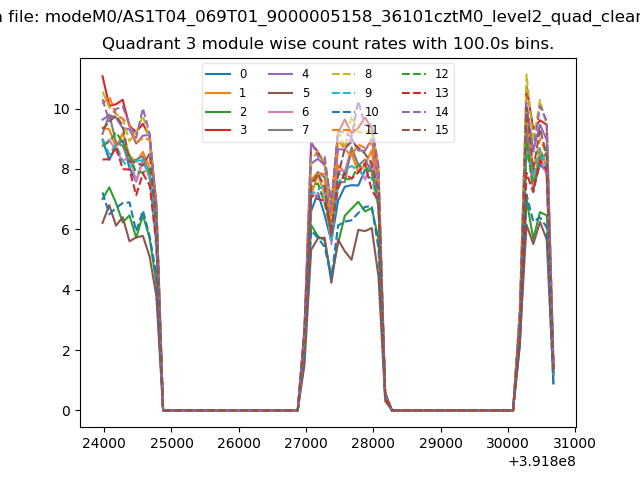 |
 |
| Parameter | Plot |
|---|---|
| CZT HV Monitor | 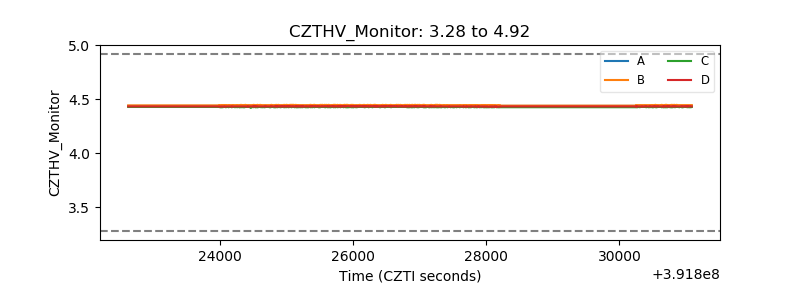 |
| D_VDD | 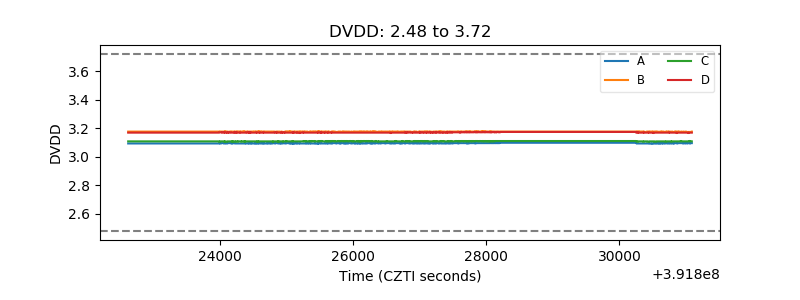 |
| Temperature 1 |  |
| Veto HV Monitor | 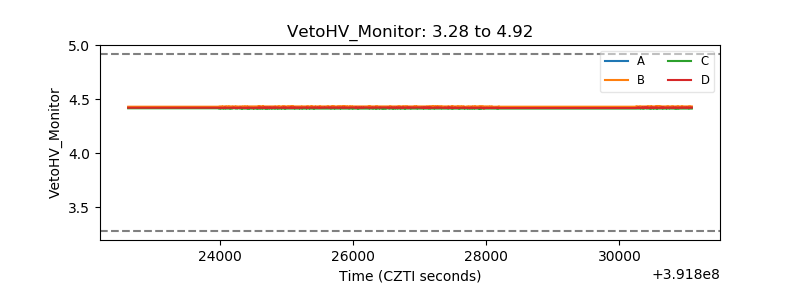 |
| Veto LLD | 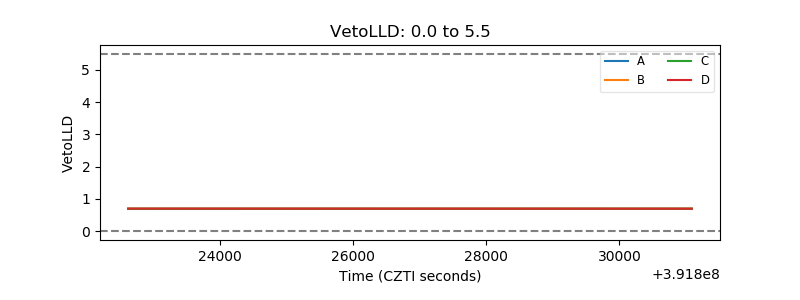 |
| Alpha Counter | 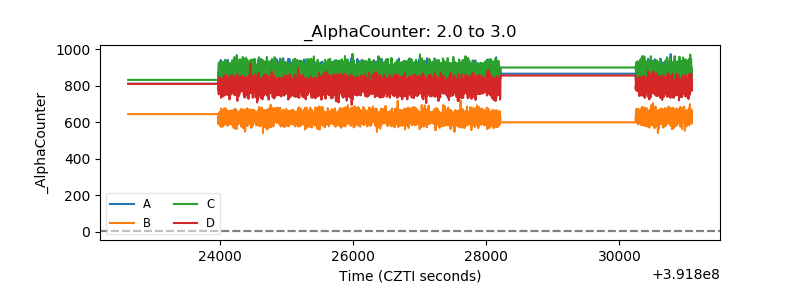 |
| _CPM_Rate | 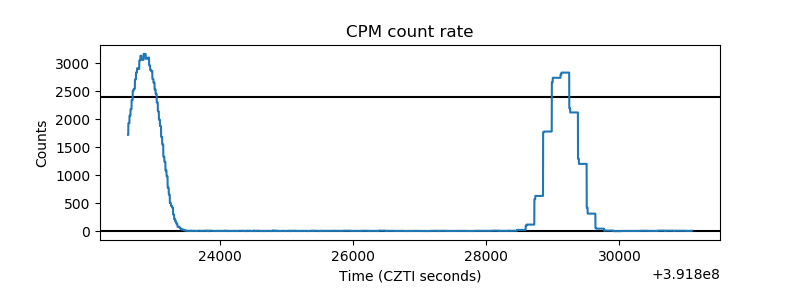 |
| CZT Counter | 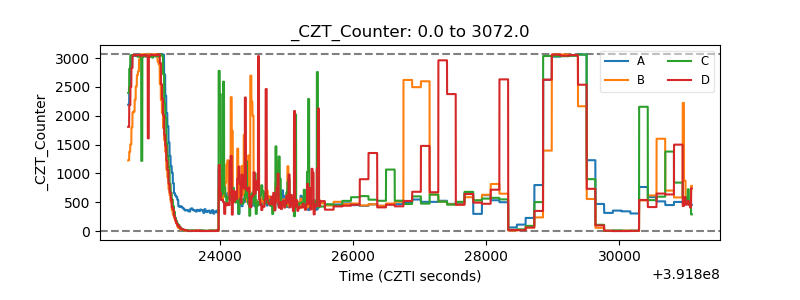 |
| +2.5 Volts monitor |  |
| +5 Volts monitor |  |
| _ROLL_ROT | 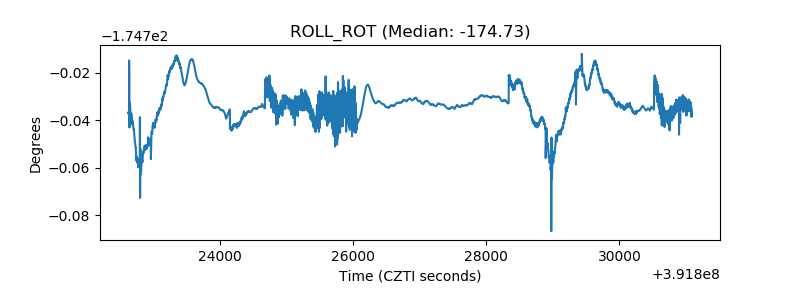 |
| _Roll_DEC | 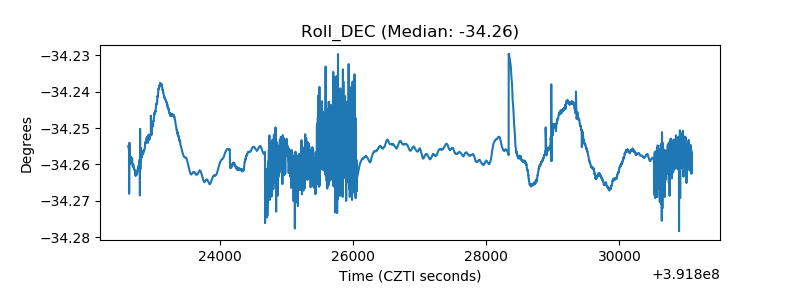 |
| _Roll_RA | 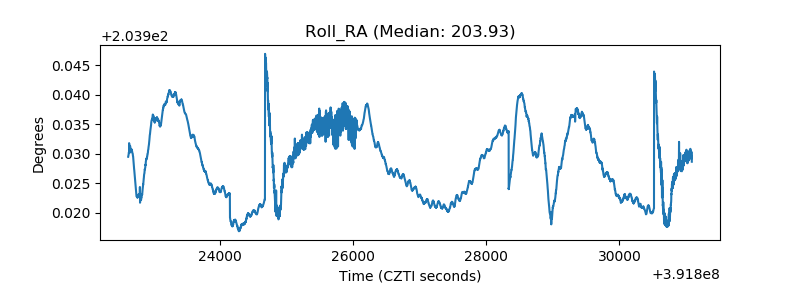 |
| Veto Counter | 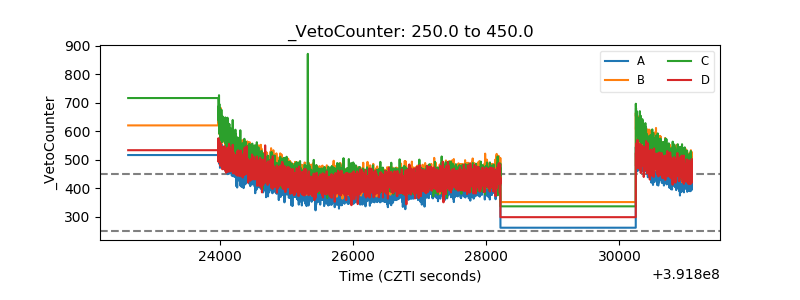 |