| Param | Original file | Final file |
|---|---|---|
| Filename | modeM0/AS1T04_069T01_9000005158_36120cztM0_level2.evt | modeM0/AS1T04_069T01_9000005158_36120cztM0_level2_quad_clean.evt |
| Size (bytes) | 515,211,840 | 68,333,760 |
| Size | 491.3 MB | 65.2 MB |
| Events in quadrant A | 2,681,803 | 442,422 |
| Events in quadrant B | 4,763,768 | 404,665 |
| Events in quadrant C | 3,663,150 | 424,942 |
| Events in quadrant D | 4,118,640 | 409,008 |
| Mode M0 | |||
|---|---|---|---|
| Quadrant | BADHDUFLAG | Total packets | Discarded packets |
| A | 0 | 11437 | 3 |
| B | 0 | 17708 | 2 |
| C | 0 | 14286 | 2 |
| D | 0 | 15924 | 2 |
| Mode M9 | |||
|---|---|---|---|
| Quadrant | BADHDUFLAG | Total packets | Discarded packets |
| A | 0 | 31 | 0 |
| B | 0 | 31 | 0 |
| C | 0 | 31 | 0 |
| D | 0 | 32 | 0 |
| Mode SS | |||
|---|---|---|---|
| Quadrant | BADHDUFLAG | Total packets | Discarded packets |
| A | 0 | 114 | 0 |
| B | 0 | 114 | 0 |
| C | 0 | 114 | 0 |
| D | 0 | 114 | 0 |
| Quadrant | Total seconds | Saturated seconds | Saturation percentage |
|---|---|---|---|
| A | 5537 | 8 | 0.144483% |
| B | 5537 | 756 | 13.653603% |
| C | 5537 | 240 | 4.334477% |
| D | 5537 | 345 | 6.230811% |
Noise dominated data is calculated using 1-second bins in cleaned event files. If a bin has >2000 counts, and if more than 50% of those come from <1% of pixels, then it is considered to be noise-dominated and hence unusable.
| Quadrant | # 1 sec bins | Bins with >0 counts | Bins with >2000 counts | High rate bins dominated by noise | Noise dominated (total time) | Noise dominated (detector-on time) | Marked lightcurve |
|---|---|---|---|---|---|---|---|
| A | 7090 | 5538 | 3 | 3 | 0.04% | 0.05% | 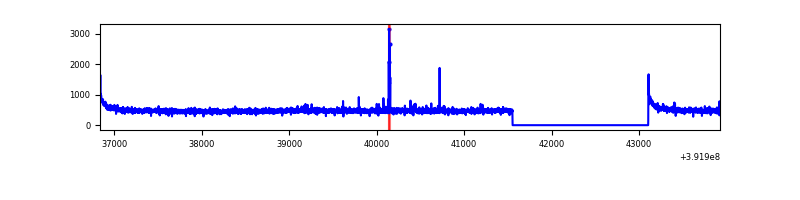 |
| B | 7090 | 5538 | 559 | 559 | 7.88% | 10.09% | 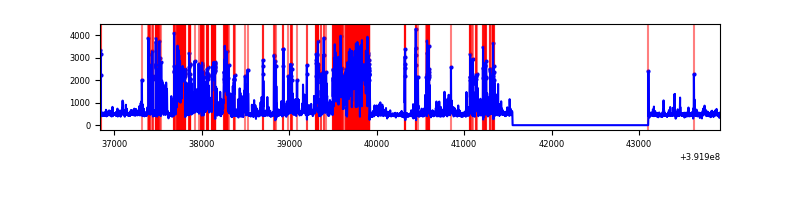 |
| C | 7090 | 5538 | 190 | 190 | 2.68% | 3.43% | 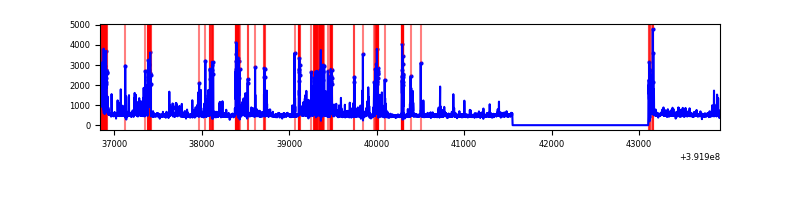 |
| D | 7090 | 5538 | 317 | 317 | 4.47% | 5.72% | 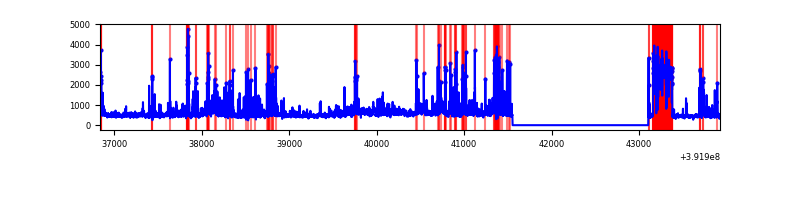 |
Top three noisy pixels from each quadrant. If the there are fewer than three noisy pixels in the level2.evt file, extra rows are filled as -1
| Pixel properties | Quadrant properties | ||||||
|---|---|---|---|---|---|---|---|
| Quadrant | DetID | PixID | Counts | Sigma | Mean | Median | Sigma |
| A | 10 | 83 | 182936 | 1416.58 | 635 | 622 | 128.7 |
| A | 9 | 143 | 28301 | 215.06 | 635 | 622 | 128.7 |
| A | 13 | 254 | 8328 | 59.87 | 635 | 622 | 128.7 |
| B | 5 | 172 | 2128189 | 18562.05 | 592 | 576 | 114.6 |
| B | 5 | 236 | 109487 | 950.18 | 592 | 576 | 114.6 |
| B | 0 | 190 | 45634 | 393.1 | 592 | 576 | 114.6 |
| C | 12 | 249 | 685563 | 4858.39 | 604 | 607 | 141.0 |
| C | 15 | 214 | 233675 | 1653.15 | 604 | 607 | 141.0 |
| C | 0 | 10 | 210943 | 1491.91 | 604 | 607 | 141.0 |
| D | 1 | 52 | 956575 | 6495.73 | 594 | 577 | 147.2 |
| D | 12 | 6 | 311722 | 2114.14 | 594 | 577 | 147.2 |
| D | 12 | 233 | 136356 | 922.58 | 594 | 577 | 147.2 |
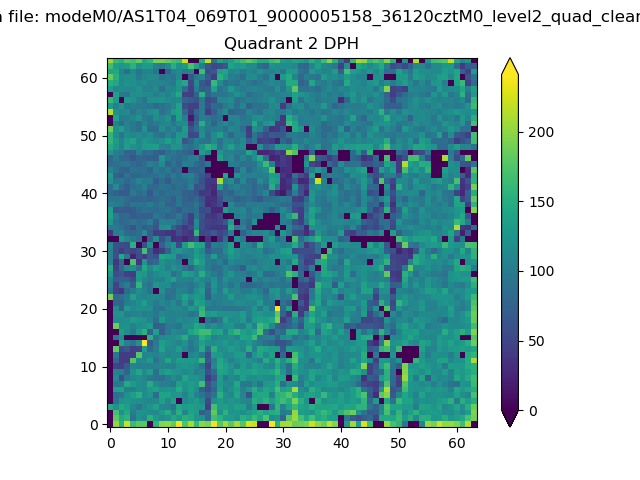
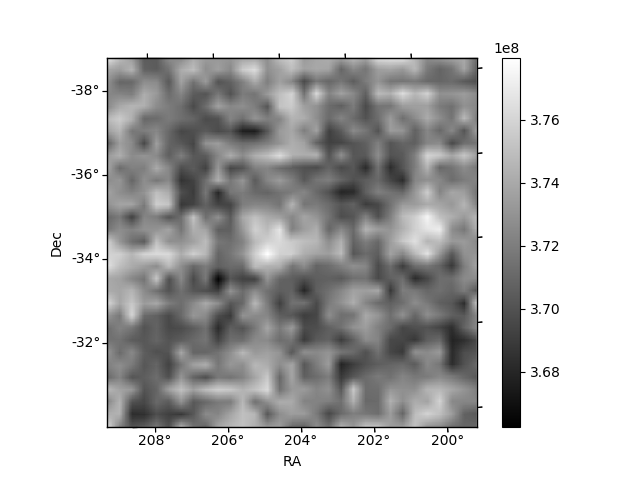
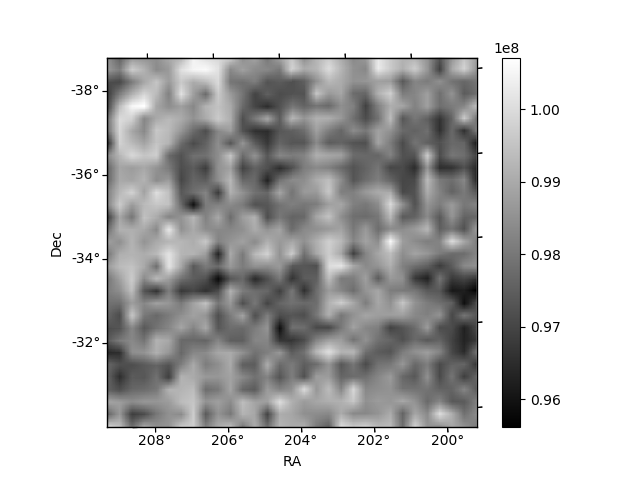
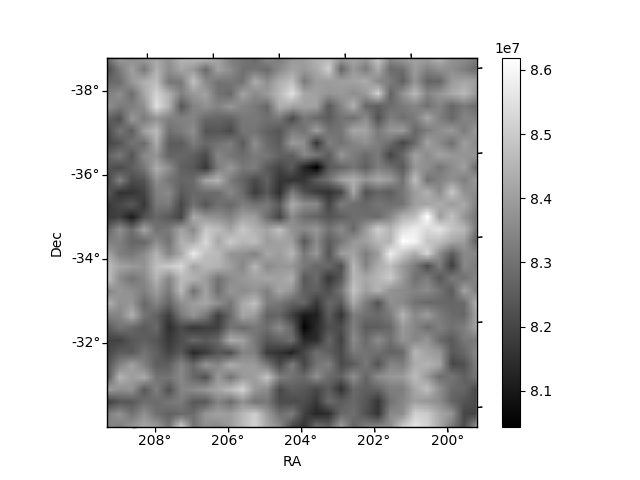
Histogram calculated using DETX and DETY for each event in the final _common_clean file
| Quadrant A | 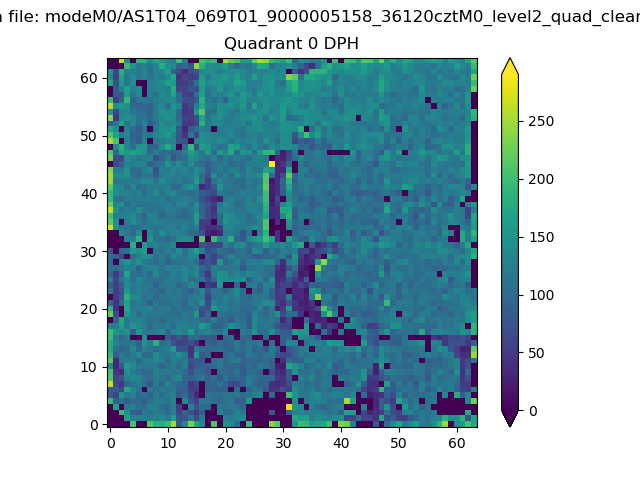 |
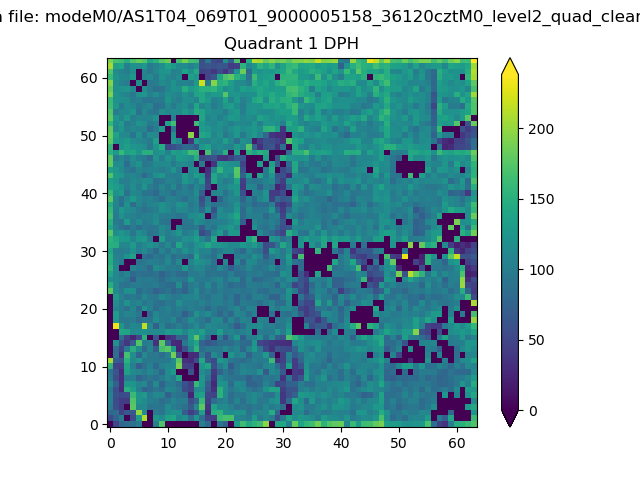 |
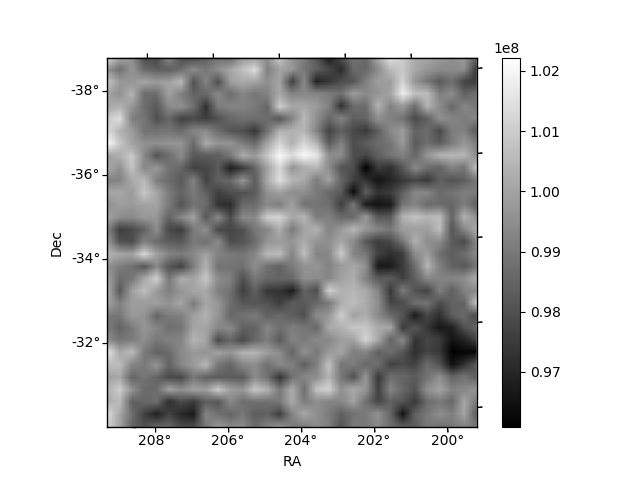
Quadrant B |
|---|---|---|---|
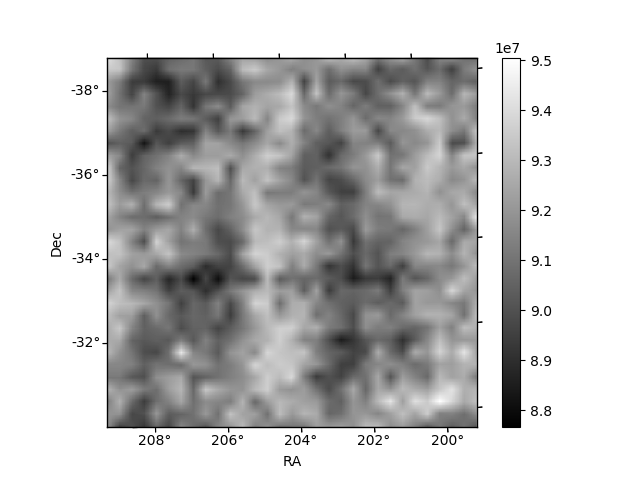
| Quadrant D | 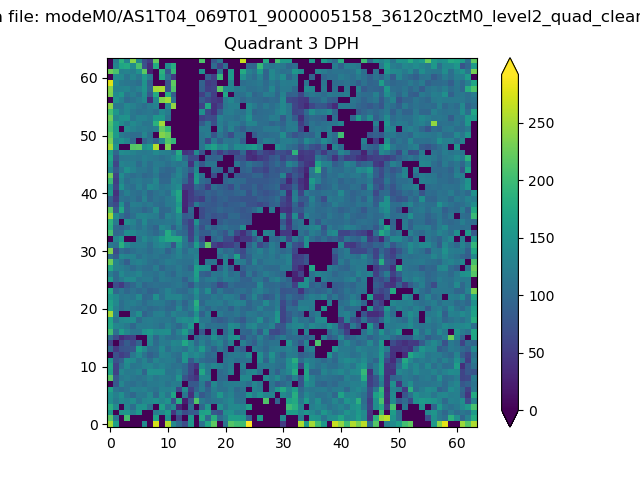 |
 |
Quadrant C |
| Plot type | Count rate plots | Images |
|---|---|---|
| Comparison with Poisson distribution Blue bars denote a histogram of data divided into 1 sec bins. Red curve is a Poisson curve with rate = median count rate of data. |
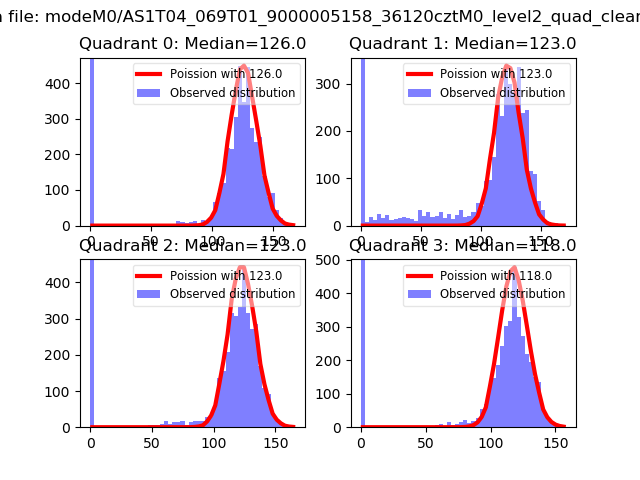 |
 |
| Quadrant-wise count rates Data is divided into 100 sec bins |
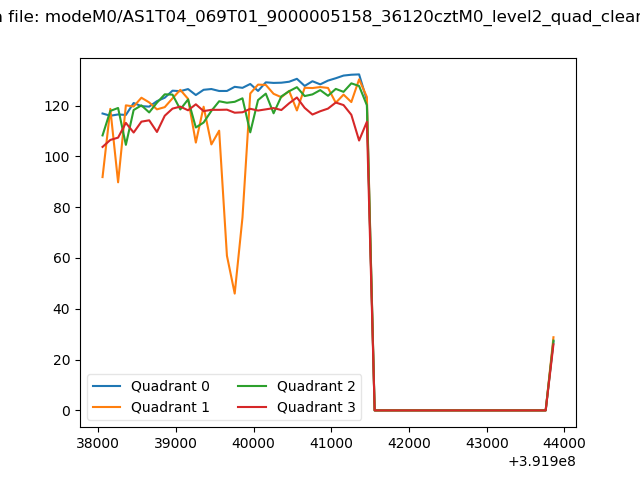 |
|
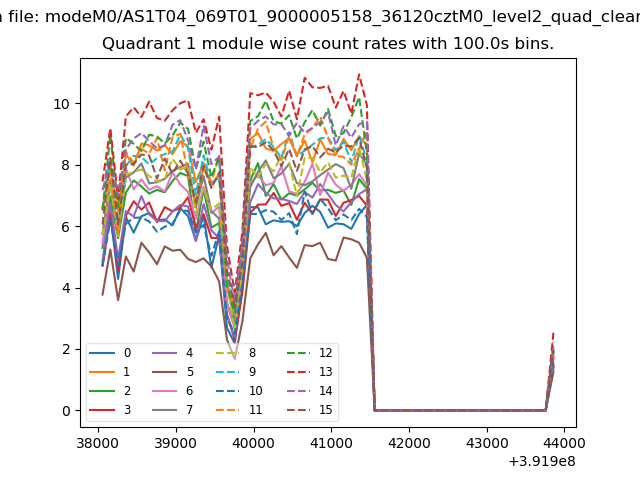
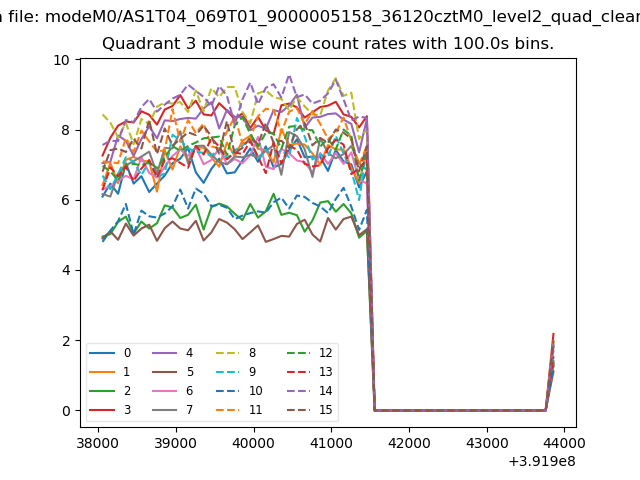
| Module-wise count rates for Quadrant A Data is divided into 100 sec bins |
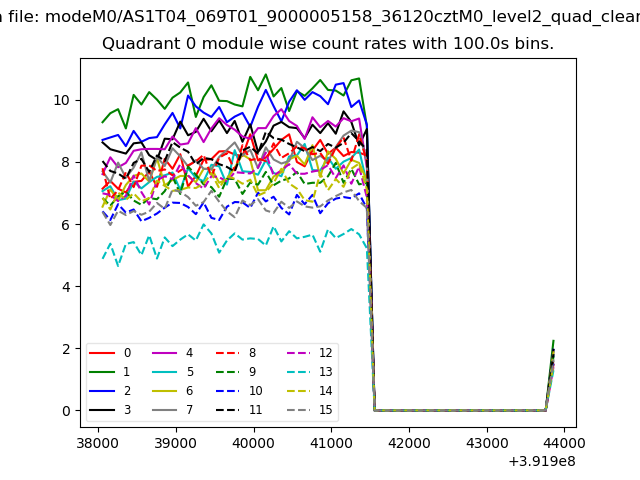 |
 |
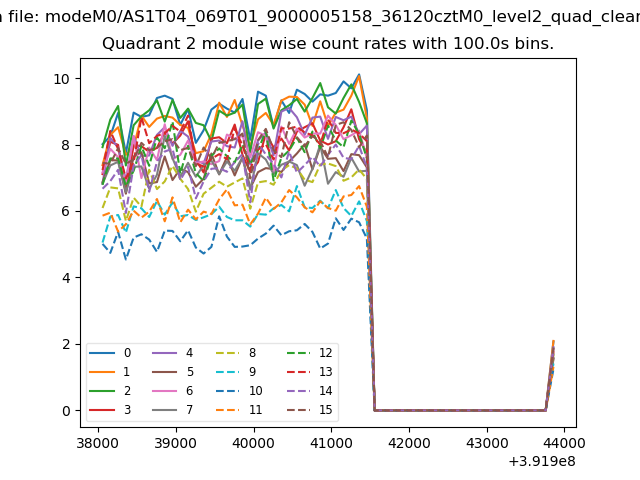
| Module-wise count rates for Quadrant B Data is divided into 100 sec bins |
 |
 |
| Module-wise count rates for Quadrant C Data is divided into 100 sec bins |
 |
 |
| Module-wise count rates for Quadrant D Data is divided into 100 sec bins |
 |
 |
| Parameter | Plot |
|---|---|
| CZT HV Monitor | 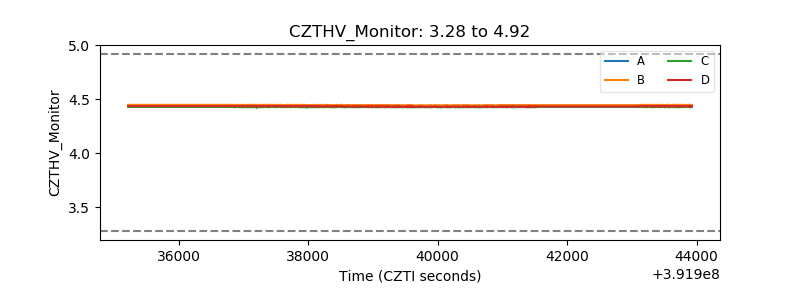 |
| D_VDD | 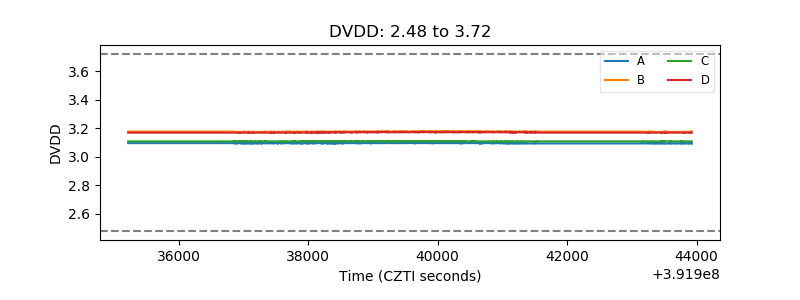 |
| Temperature 1 | 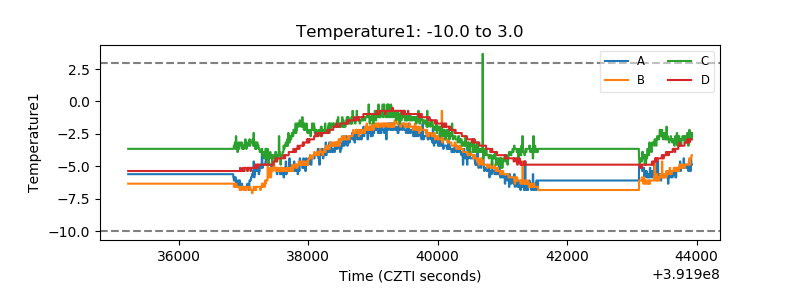 |
| Veto HV Monitor |  |
| Veto LLD | 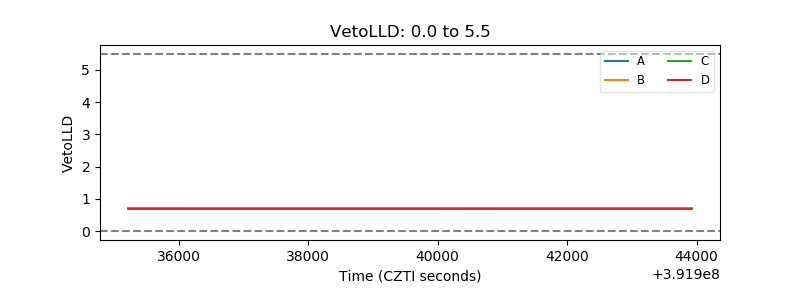 |
| Alpha Counter | 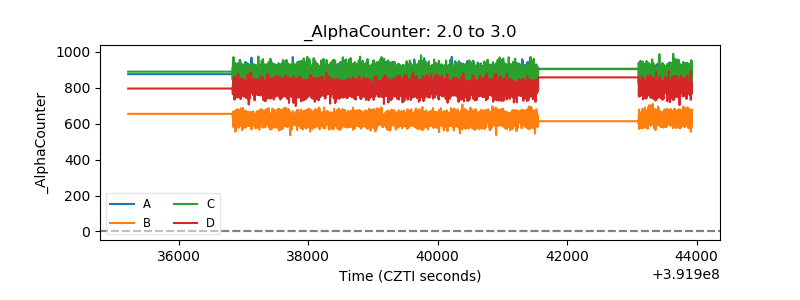 |
| _CPM_Rate | 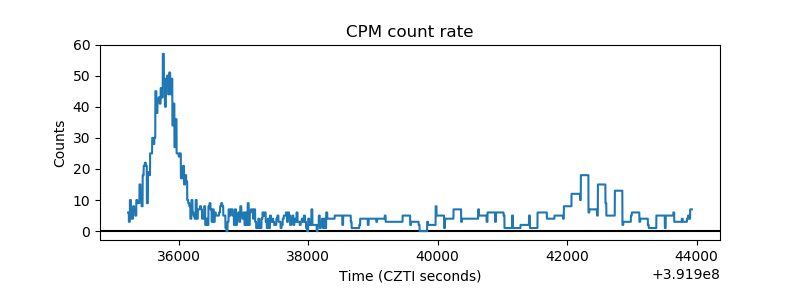 |
| CZT Counter | 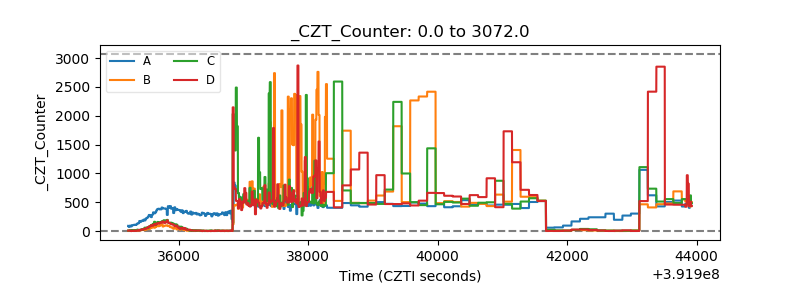 |
| +2.5 Volts monitor | 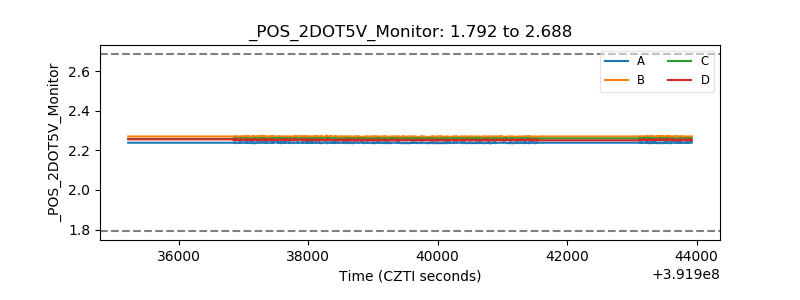 |
| +5 Volts monitor |  |
| _ROLL_ROT | 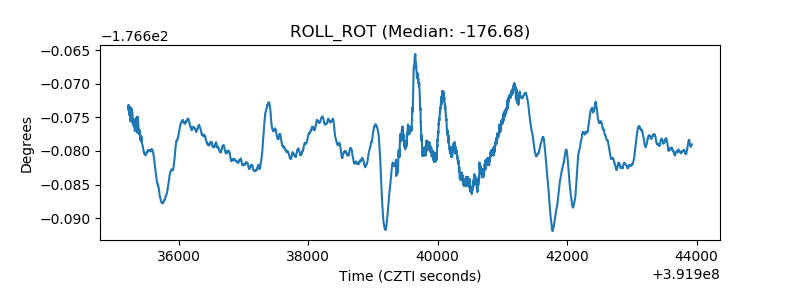 |
| _Roll_DEC | 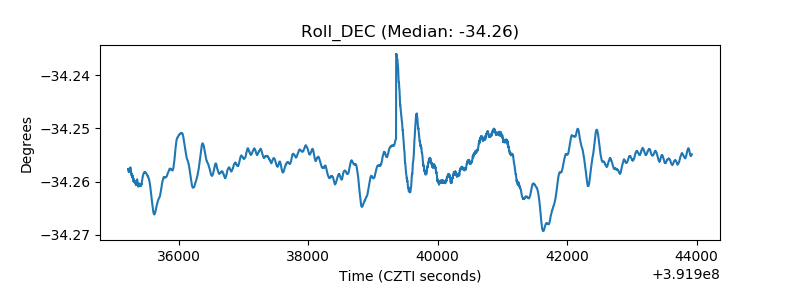 |
| _Roll_RA | 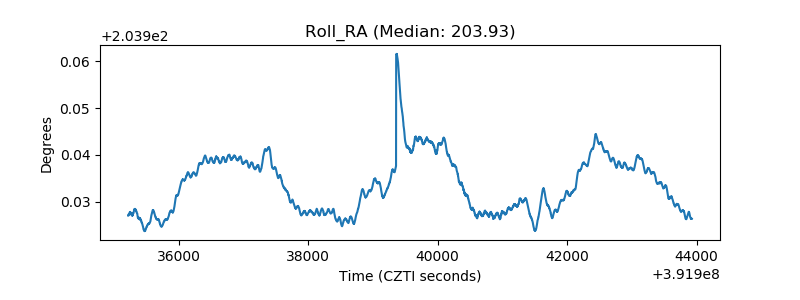 |
| Veto Counter | 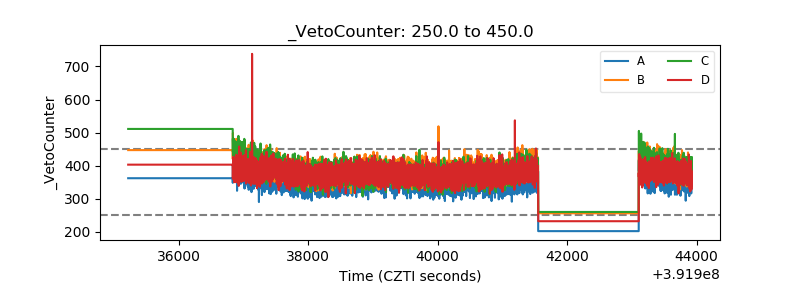 |