| Param | Original file | Final file |
|---|---|---|
| Filename | modeM0/AS1T04_069T01_9000005158_36122cztM0_level2.evt | modeM0/AS1T04_069T01_9000005158_36122cztM0_level2_quad_clean.evt |
| Size (bytes) | 641,963,520 | 88,600,320 |
| Size | 612.2 MB | 84.5 MB |
| Events in quadrant A | 3,207,963 | 593,767 |
| Events in quadrant B | 3,753,601 | 592,839 |
| Events in quadrant C | 4,046,717 | 570,795 |
| Events in quadrant D | 7,984,835 | 462,677 |
| Mode M0 | |||
|---|---|---|---|
| Quadrant | BADHDUFLAG | Total packets | Discarded packets |
| A | 0 | 13659 | 3 |
| B | 0 | 15320 | 2 |
| C | 0 | 16012 | 2 |
| D | 0 | 28168 | 2 |
| Mode M9 | |||
|---|---|---|---|
| Quadrant | BADHDUFLAG | Total packets | Discarded packets |
| A | 0 | 26 | 0 |
| B | 0 | 26 | 0 |
| C | 0 | 26 | 0 |
| D | 0 | 26 | 0 |
| Mode SS | |||
|---|---|---|---|
| Quadrant | BADHDUFLAG | Total packets | Discarded packets |
| A | 0 | 138 | 0 |
| B | 0 | 138 | 0 |
| C | 0 | 138 | 0 |
| D | 0 | 138 | 0 |
| Quadrant | Total seconds | Saturated seconds | Saturation percentage |
|---|---|---|---|
| A | 6625 | 14 | 0.211321% |
| B | 6625 | 189 | 2.852830% |
| C | 6625 | 224 | 3.381132% |
| D | 6625 | 1545 | 23.320755% |
Noise dominated data is calculated using 1-second bins in cleaned event files. If a bin has >2000 counts, and if more than 50% of those come from <1% of pixels, then it is considered to be noise-dominated and hence unusable.
| Quadrant | # 1 sec bins | Bins with >0 counts | Bins with >2000 counts | High rate bins dominated by noise | Noise dominated (total time) | Noise dominated (detector-on time) | Marked lightcurve |
|---|---|---|---|---|---|---|---|
| A | 9280 | 6627 | 1 | 1 | 0.01% | 0.02% | 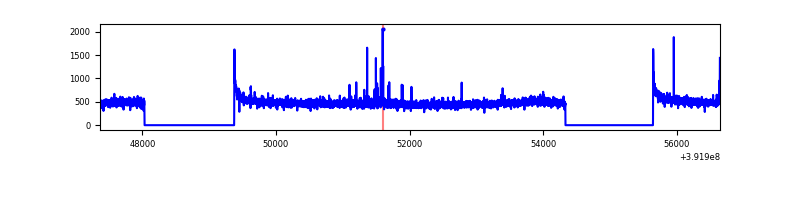 |
| B | 9280 | 6627 | 121 | 121 | 1.30% | 1.83% | 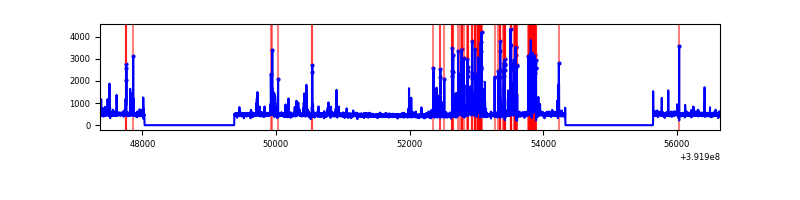 |
| C | 9280 | 6627 | 180 | 180 | 1.94% | 2.72% | 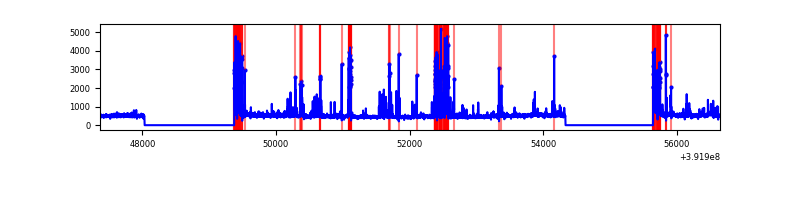 |
| D | 9280 | 6627 | 1603 | 1603 | 17.27% | 24.19% | 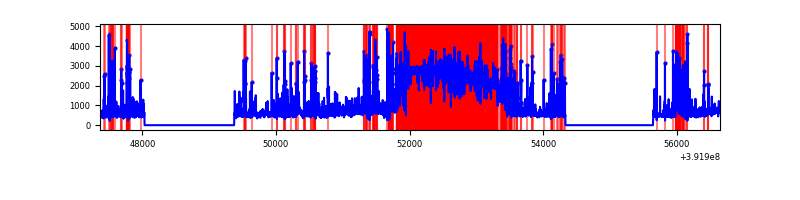 |
Top three noisy pixels from each quadrant. If the there are fewer than three noisy pixels in the level2.evt file, extra rows are filled as -1
| Pixel properties | Quadrant properties | ||||||
|---|---|---|---|---|---|---|---|
| Quadrant | DetID | PixID | Counts | Sigma | Mean | Median | Sigma |
| A | 10 | 83 | 193693 | 1227.45 | 768 | 751 | 157.2 |
| A | 9 | 143 | 30211 | 187.42 | 768 | 751 | 157.2 |
| A | 13 | 254 | 9984 | 58.74 | 768 | 751 | 157.2 |
| B | 5 | 172 | 643998 | 4397.95 | 754 | 733 | 146.3 |
| B | 0 | 155 | 43479 | 292.25 | 754 | 733 | 146.3 |
| B | 0 | 190 | 30794 | 205.52 | 754 | 733 | 146.3 |
| C | 0 | 207 | 571944 | 3330.62 | 732 | 736 | 171.5 |
| C | 15 | 214 | 276820 | 1609.8 | 732 | 736 | 171.5 |
| C | 0 | 10 | 251346 | 1461.27 | 732 | 736 | 171.5 |
| D | 10 | 203 | 2268669 | 13668.36 | 671 | 651 | 165.9 |
| D | 1 | 52 | 1774697 | 10691.4 | 671 | 651 | 165.9 |
| D | 12 | 6 | 301040 | 1810.31 | 671 | 651 | 165.9 |
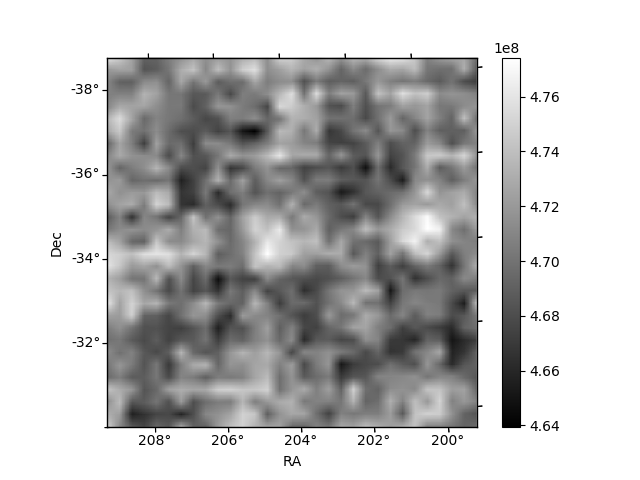
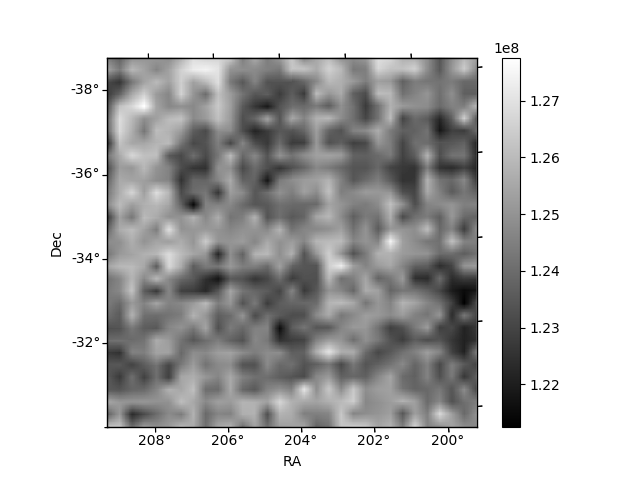
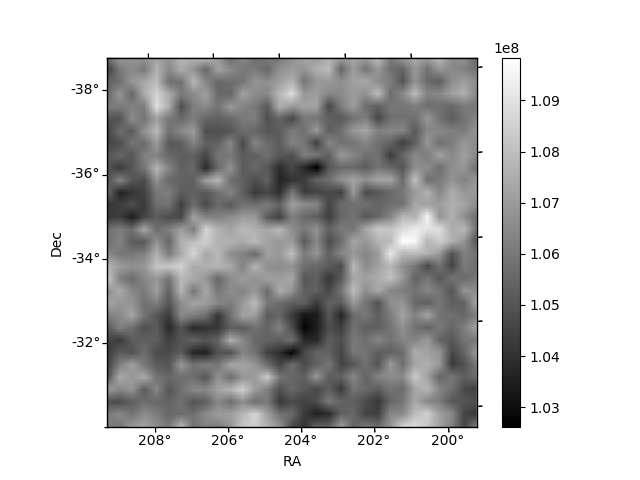
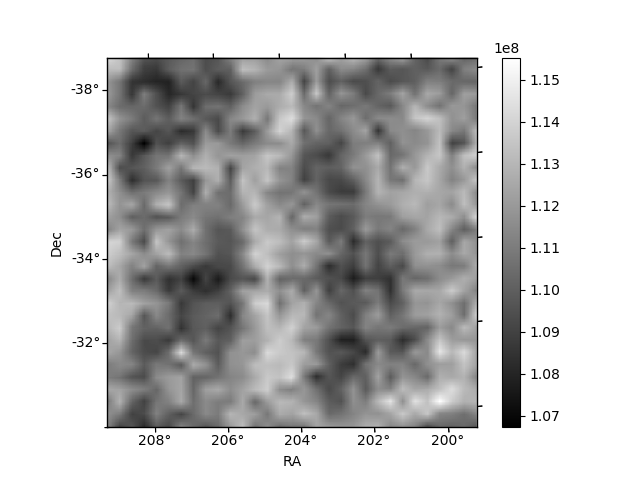
Histogram calculated using DETX and DETY for each event in the final _common_clean file
| Quadrant A | 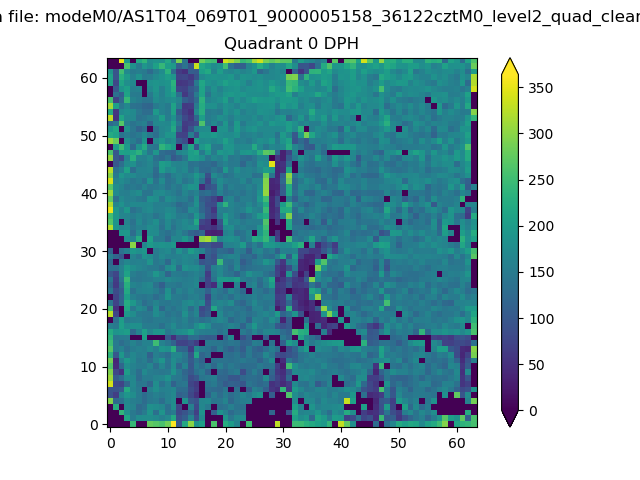 |
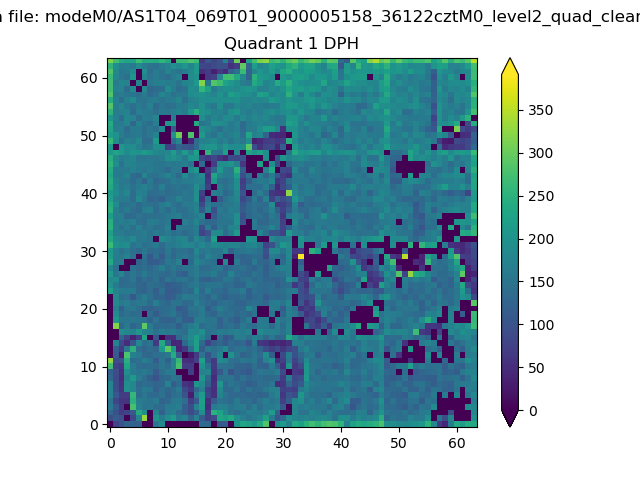 |
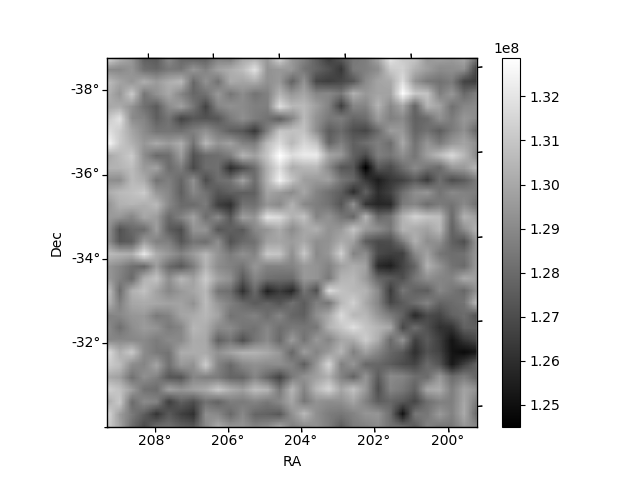
Quadrant B |
|---|---|---|---|
| Quadrant D | 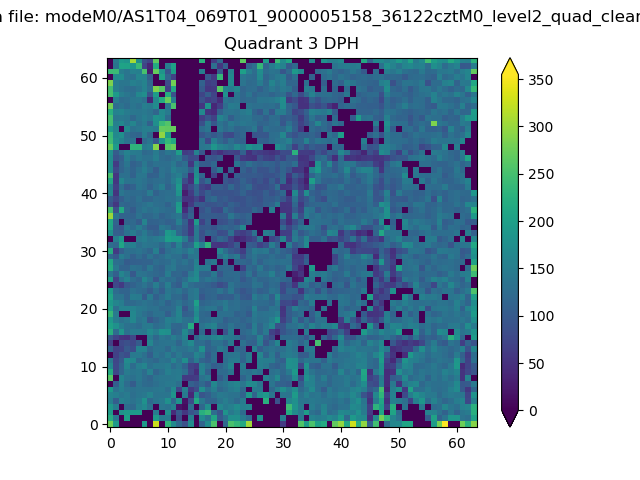 |
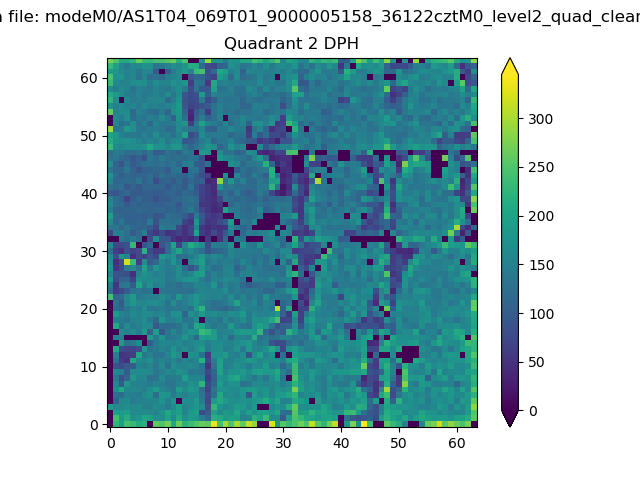 |
Quadrant C |
| Plot type | Count rate plots | Images |
|---|---|---|
| Comparison with Poisson distribution Blue bars denote a histogram of data divided into 1 sec bins. Red curve is a Poisson curve with rate = median count rate of data. |
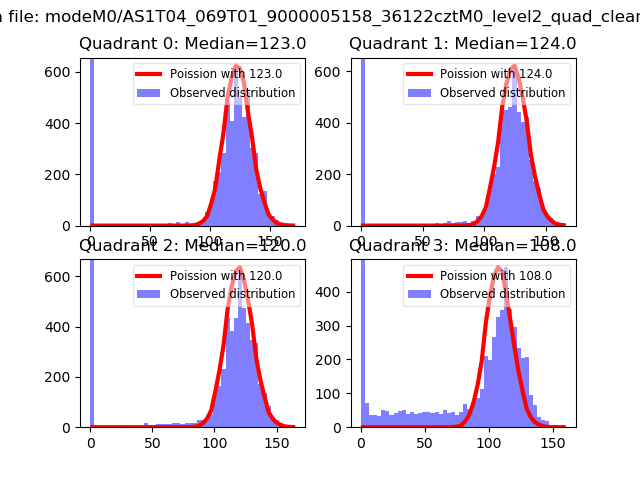 |
 |
| Quadrant-wise count rates Data is divided into 100 sec bins |
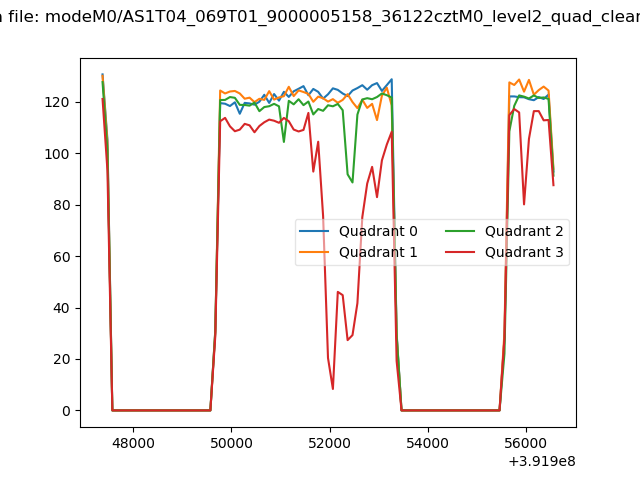 |
|
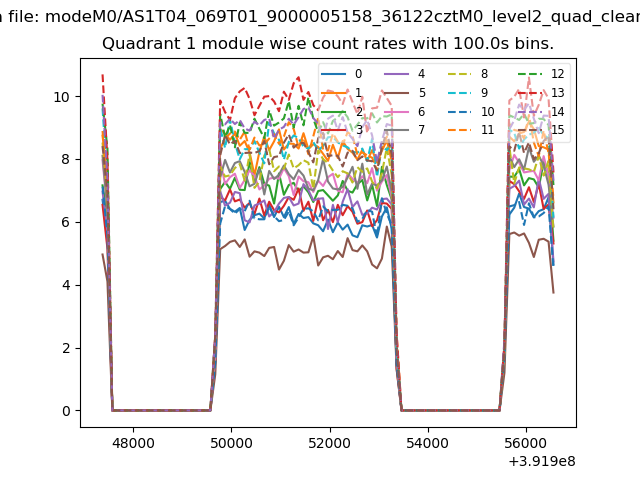
| Module-wise count rates for Quadrant A Data is divided into 100 sec bins |
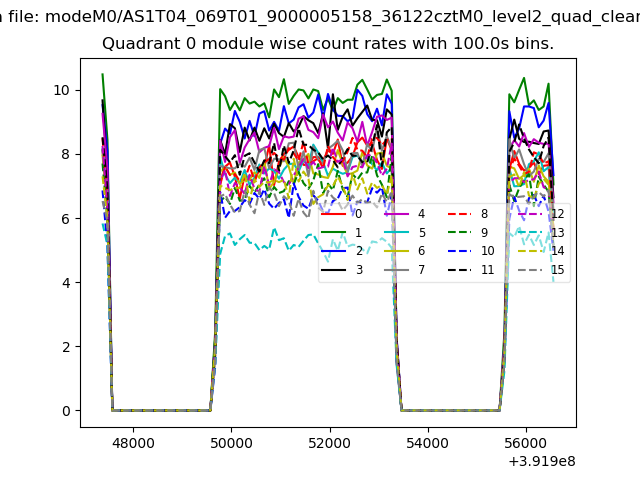 |
 |
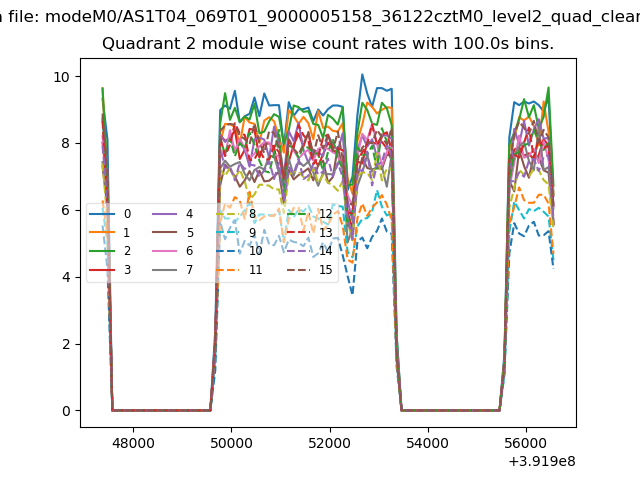
| Module-wise count rates for Quadrant B Data is divided into 100 sec bins |
 |
 |
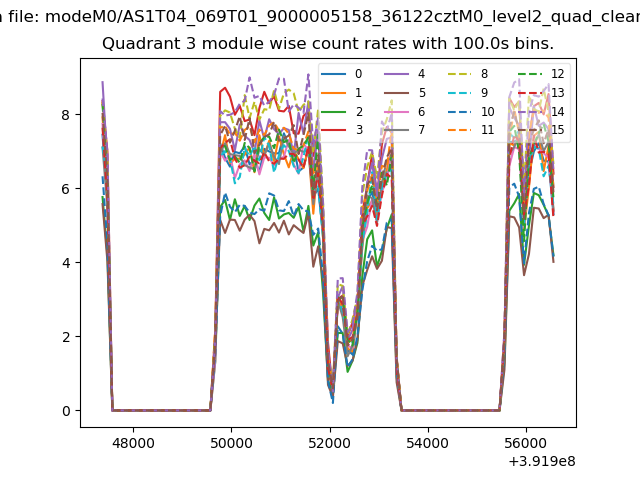
| Module-wise count rates for Quadrant C Data is divided into 100 sec bins |
 |
 |
| Module-wise count rates for Quadrant D Data is divided into 100 sec bins |
 |
 |
| Parameter | Plot |
|---|---|
| CZT HV Monitor | 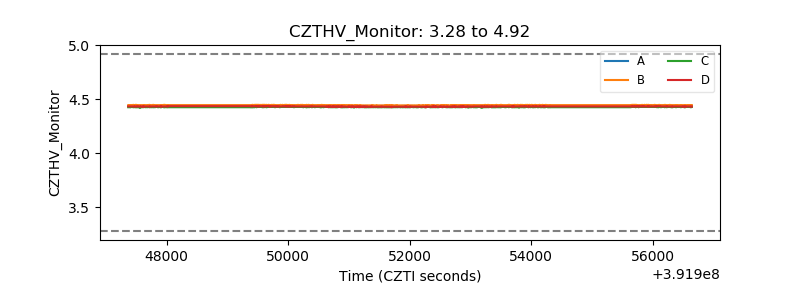 |
| D_VDD | 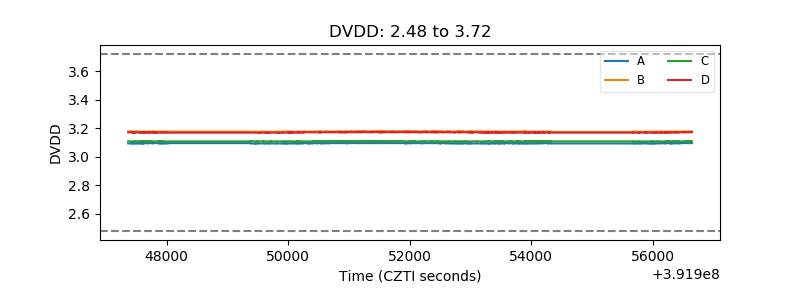 |
| Temperature 1 |  |
| Veto HV Monitor |  |
| Veto LLD | 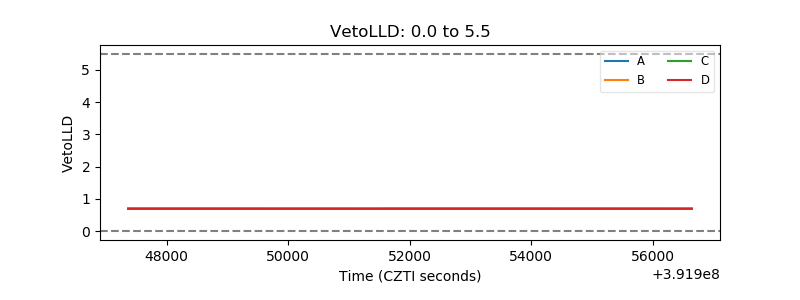 |
| Alpha Counter | 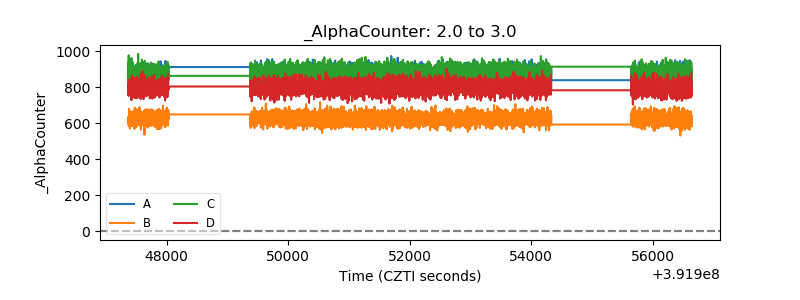 |
| _CPM_Rate | 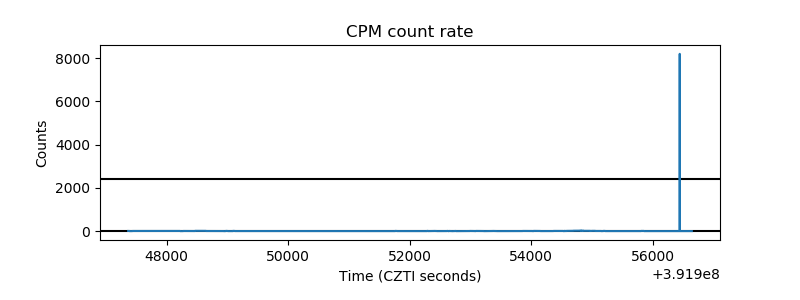 |
| CZT Counter | 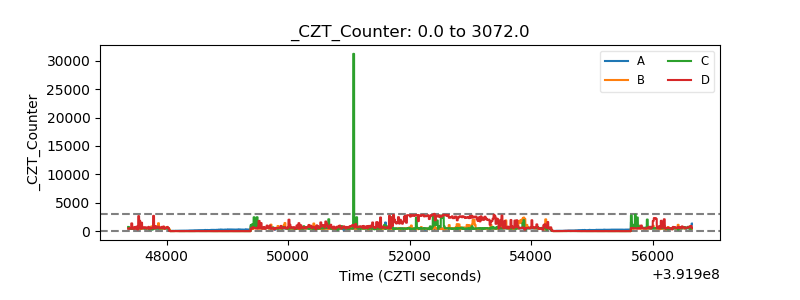 |
| +2.5 Volts monitor |  |
| +5 Volts monitor |  |
| _ROLL_ROT | 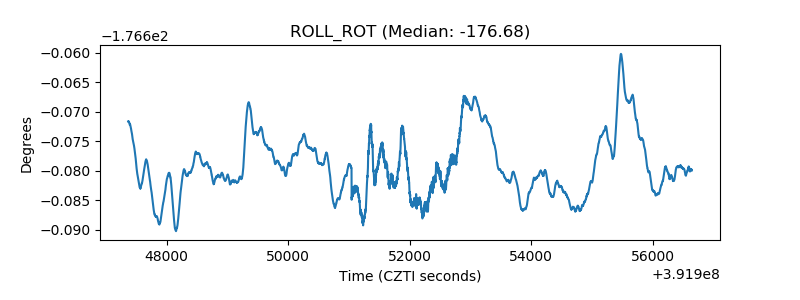 |
| _Roll_DEC | 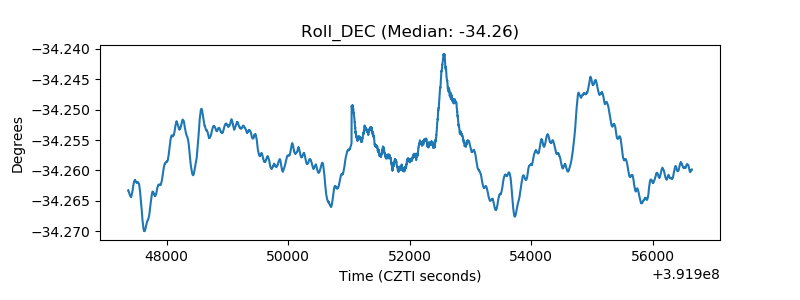 |
| _Roll_RA | 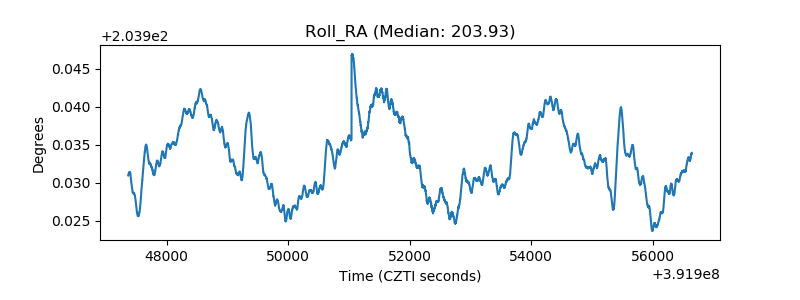 |
| Veto Counter | 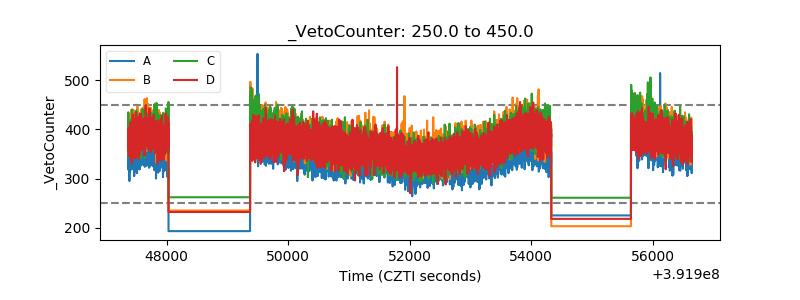 |