| Param | Original file | Final file |
|---|---|---|
| Filename | modeM0/AS1T04_069T01_9000005158_36142cztM0_level2.evt | modeM0/AS1T04_069T01_9000005158_36142cztM0_level2_quad_clean.evt |
| Size (bytes) | 439,119,360 | 64,281,600 |
| Size | 418.8 MB | 61.3 MB |
| Events in quadrant A | 2,647,310 | 415,519 |
| Events in quadrant B | 4,033,126 | 385,876 |
| Events in quadrant C | 2,861,949 | 392,054 |
| Events in quadrant D | 3,393,295 | 378,569 |
| Mode M0 | |||
|---|---|---|---|
| Quadrant | BADHDUFLAG | Total packets | Discarded packets |
| A | 0 | 11316 | 3 |
| B | 0 | 15550 | 2 |
| C | 0 | 11789 | 2 |
| D | 0 | 13675 | 2 |
| Mode M9 | |||
|---|---|---|---|
| Quadrant | BADHDUFLAG | Total packets | Discarded packets |
| A | 0 | 30 | 0 |
| B | 0 | 30 | 0 |
| C | 0 | 30 | 0 |
| D | 0 | 31 | 0 |
| Mode SS | |||
|---|---|---|---|
| Quadrant | BADHDUFLAG | Total packets | Discarded packets |
| A | 0 | 108 | 0 |
| B | 0 | 108 | 0 |
| C | 0 | 108 | 0 |
| D | 0 | 108 | 0 |
| Quadrant | Total seconds | Saturated seconds | Saturation percentage |
|---|---|---|---|
| A | 5345 | 19 | 0.355472% |
| B | 5345 | 480 | 8.980355% |
| C | 5345 | 130 | 2.432180% |
| D | 5345 | 130 | 2.432180% |
Noise dominated data is calculated using 1-second bins in cleaned event files. If a bin has >2000 counts, and if more than 50% of those come from <1% of pixels, then it is considered to be noise-dominated and hence unusable.
| Quadrant | # 1 sec bins | Bins with >0 counts | Bins with >2000 counts | High rate bins dominated by noise | Noise dominated (total time) | Noise dominated (detector-on time) | Marked lightcurve |
|---|---|---|---|---|---|---|---|
| A | 7108 | 5346 | 2 | 2 | 0.03% | 0.04% | 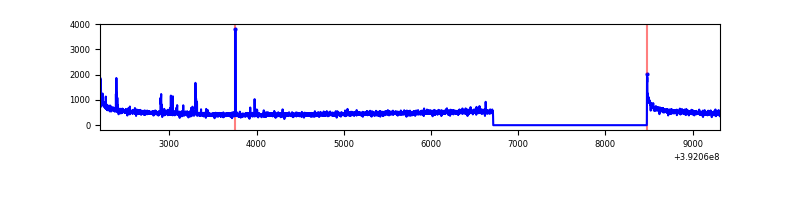 |
| B | 7108 | 5346 | 357 | 357 | 5.02% | 6.68% | 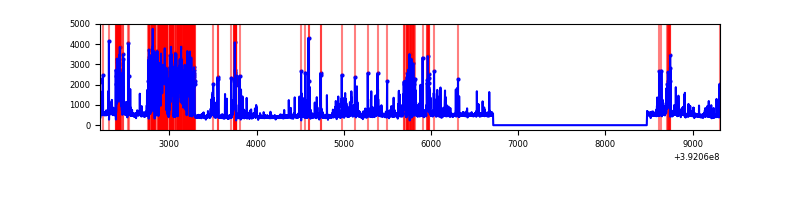 |
| C | 7108 | 5346 | 92 | 92 | 1.29% | 1.72% |  |
| D | 7108 | 5346 | 118 | 118 | 1.66% | 2.21% | 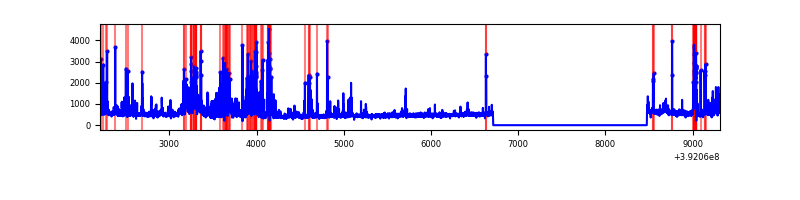 |
Top three noisy pixels from each quadrant. If the there are fewer than three noisy pixels in the level2.evt file, extra rows are filled as -1
| Pixel properties | Quadrant properties | ||||||
|---|---|---|---|---|---|---|---|
| Quadrant | DetID | PixID | Counts | Sigma | Mean | Median | Sigma |
| A | 10 | 83 | 184287 | 1446.81 | 621 | 609 | 127.0 |
| A | 9 | 143 | 47339 | 368.09 | 621 | 609 | 127.0 |
| A | 8 | 144 | 13373 | 100.54 | 621 | 609 | 127.0 |
| B | 5 | 172 | 1551563 | 13468.39 | 592 | 575 | 115.2 |
| B | 4 | 171 | 61397 | 528.16 | 592 | 575 | 115.2 |
| B | 0 | 190 | 28677 | 244.03 | 592 | 575 | 115.2 |
| C | 0 | 10 | 325924 | 2359.01 | 589 | 593 | 137.9 |
| C | 15 | 214 | 224118 | 1620.8 | 589 | 593 | 137.9 |
| C | 0 | 207 | 6311 | 41.46 | 589 | 593 | 137.9 |
| D | 1 | 52 | 424874 | 2919.08 | 590 | 573 | 145.4 |
| D | 2 | 249 | 230348 | 1580.79 | 590 | 573 | 145.4 |
| D | 12 | 6 | 112205 | 768.0 | 590 | 573 | 145.4 |
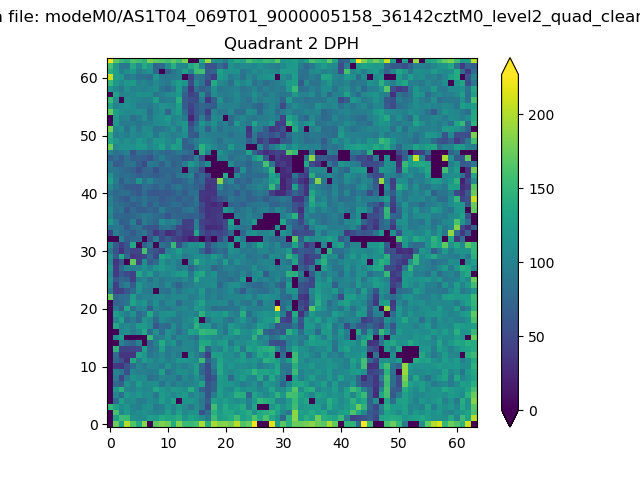
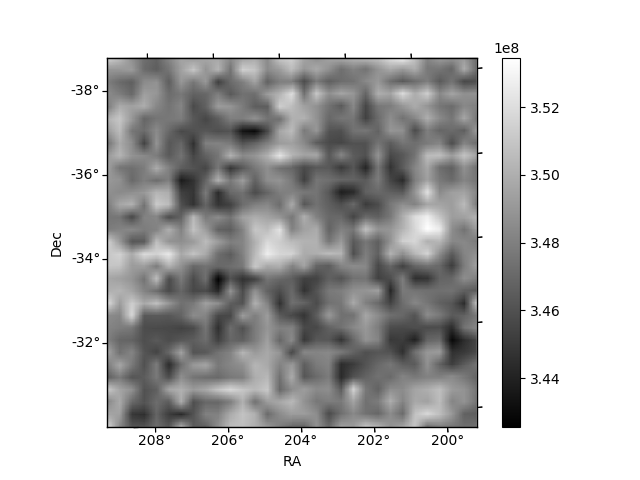
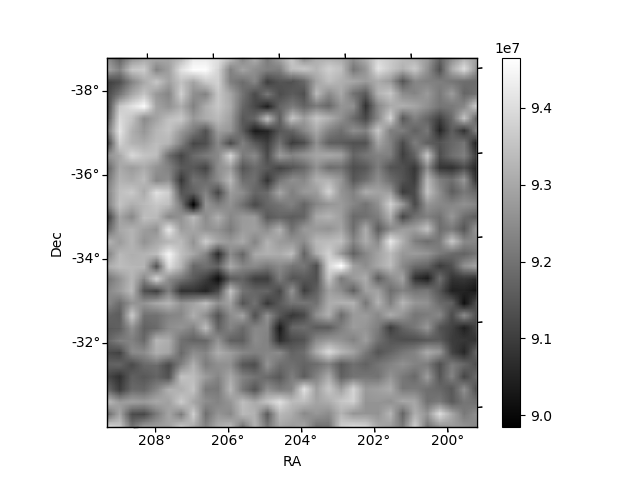
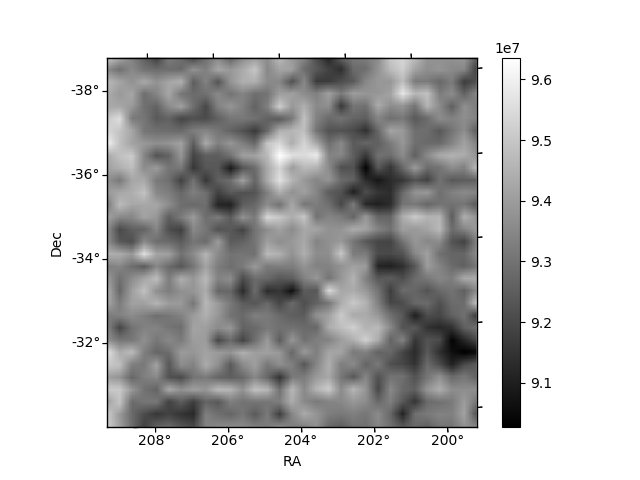
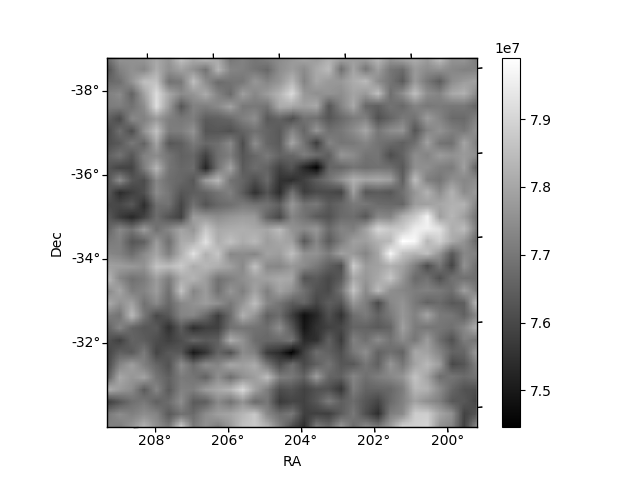
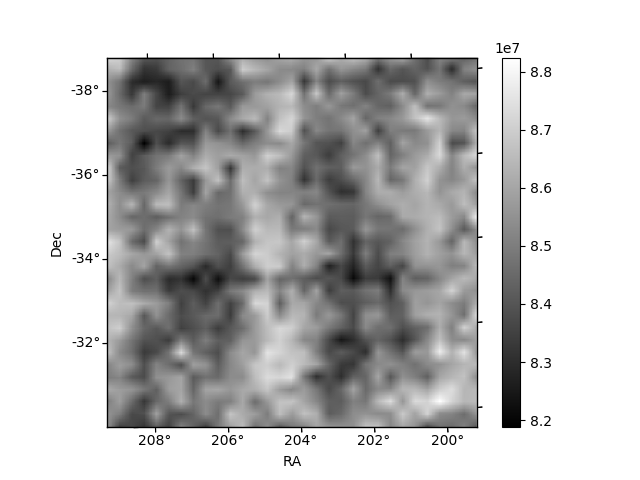
Histogram calculated using DETX and DETY for each event in the final _common_clean file
| Quadrant A | 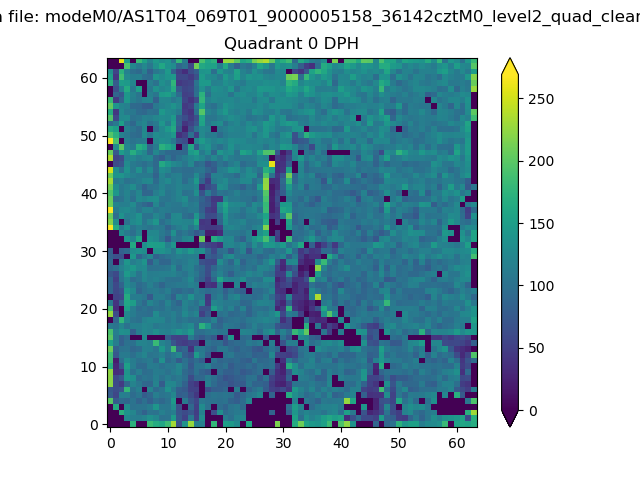 |
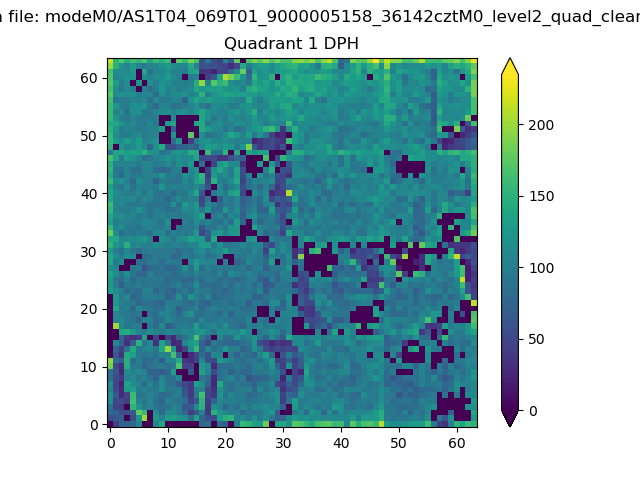 |
Quadrant B |
|---|---|---|---|
| Quadrant D | 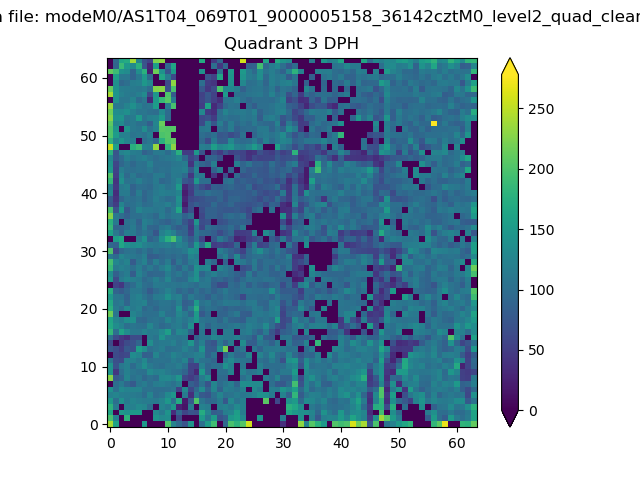 |
 |
Quadrant C |
| Plot type | Count rate plots | Images |
|---|---|---|
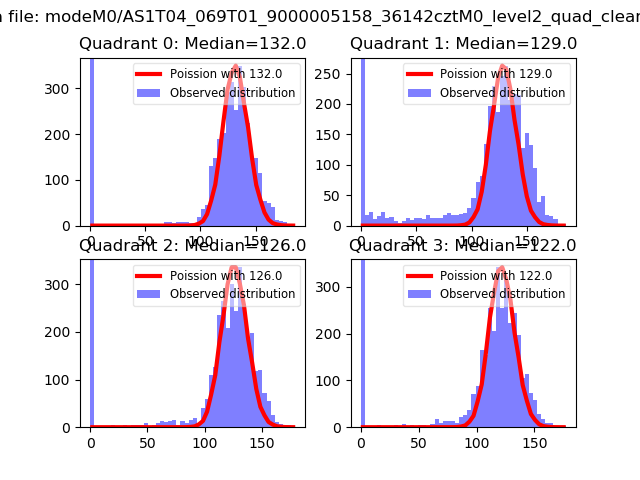
| Comparison with Poisson distribution Blue bars denote a histogram of data divided into 1 sec bins. Red curve is a Poisson curve with rate = median count rate of data. |
 |
 |
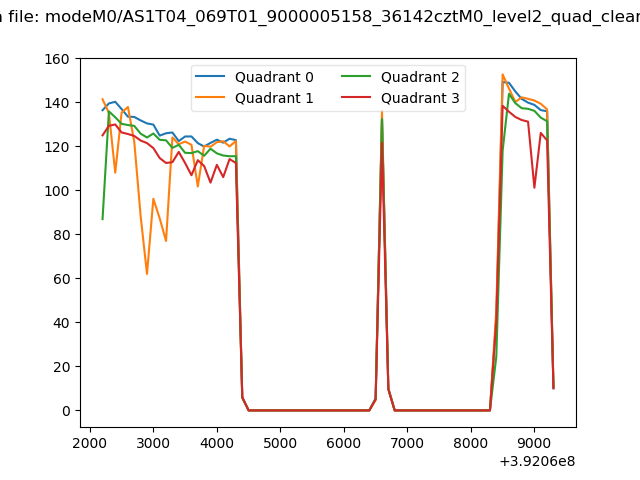
| Quadrant-wise count rates Data is divided into 100 sec bins |
 |
|
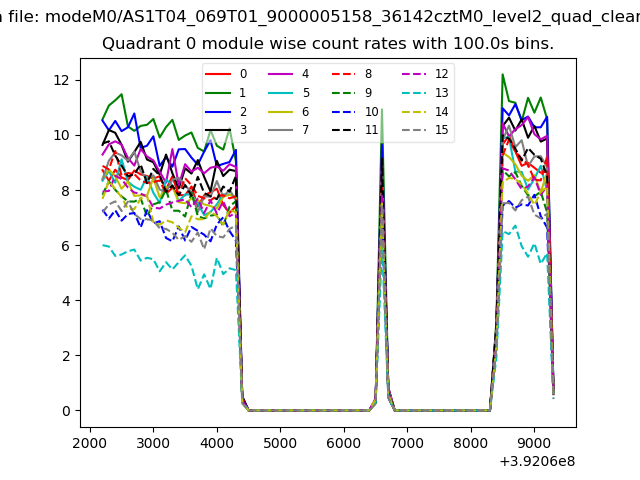
| Module-wise count rates for Quadrant A Data is divided into 100 sec bins |
 |
 |
| Module-wise count rates for Quadrant B Data is divided into 100 sec bins |
 |
 |
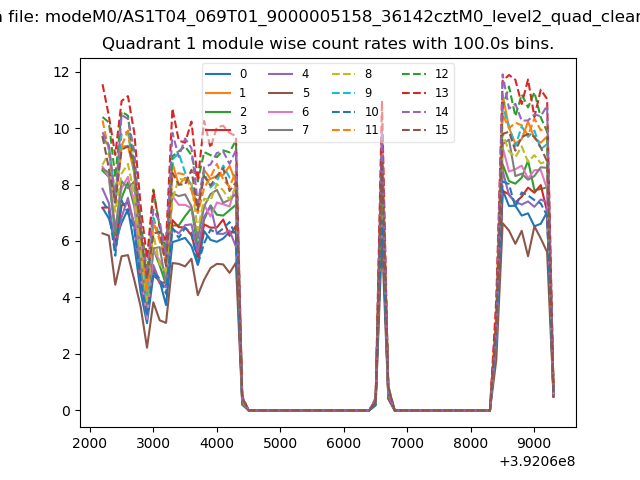
| Module-wise count rates for Quadrant C Data is divided into 100 sec bins |
 |
 |
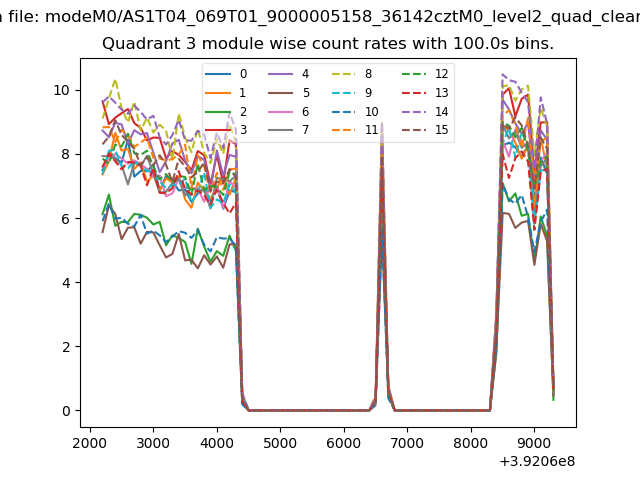
| Module-wise count rates for Quadrant D Data is divided into 100 sec bins |
 |
 |
| Parameter | Plot |
|---|---|
| CZT HV Monitor | 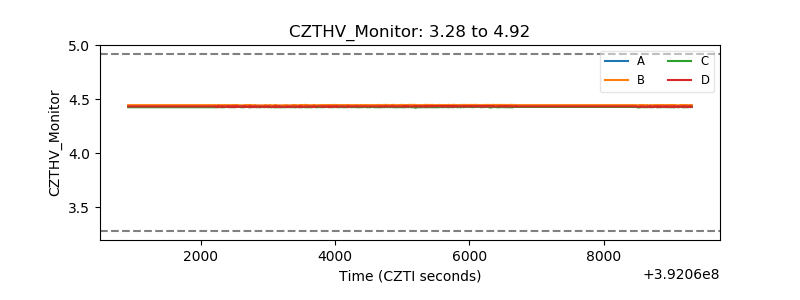 |
| D_VDD | 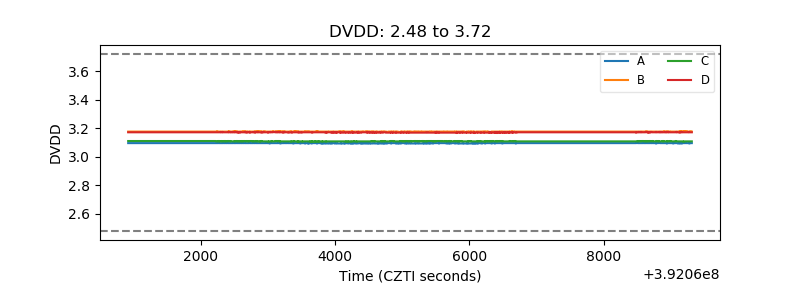 |
| Temperature 1 | 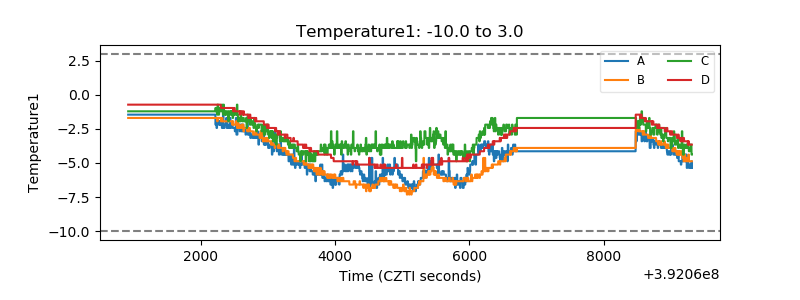 |
| Veto HV Monitor | 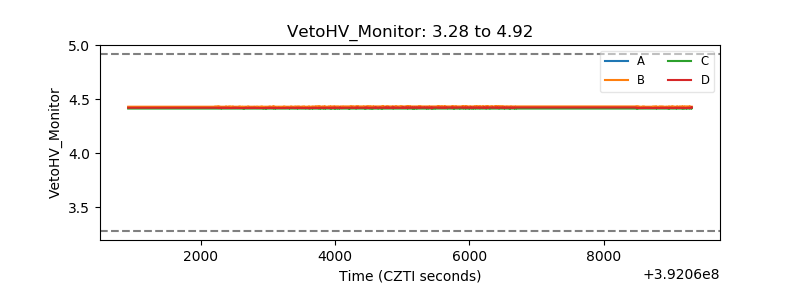 |
| Veto LLD | 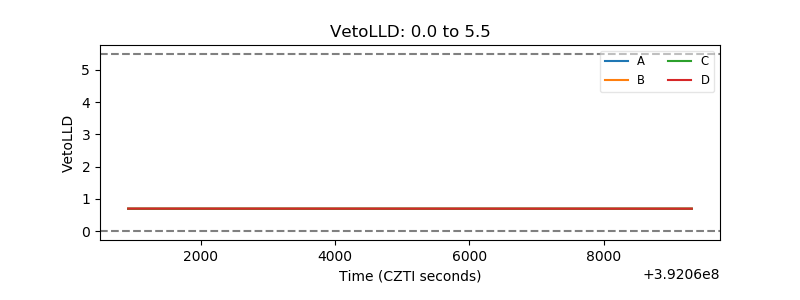 |
| Alpha Counter |  |
| _CPM_Rate | 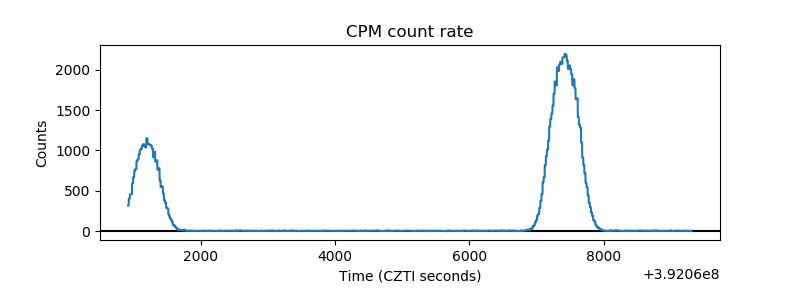 |
| CZT Counter | 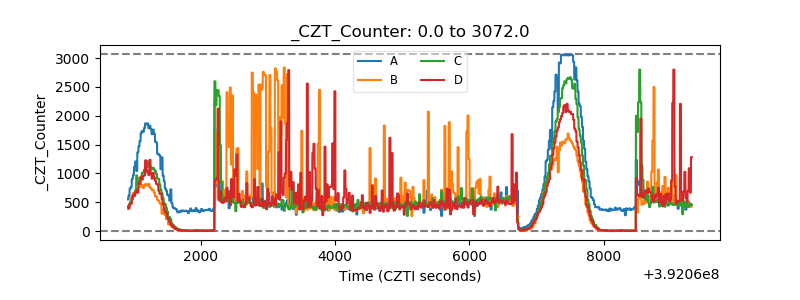 |
| +2.5 Volts monitor |  |
| +5 Volts monitor |  |
| _ROLL_ROT | 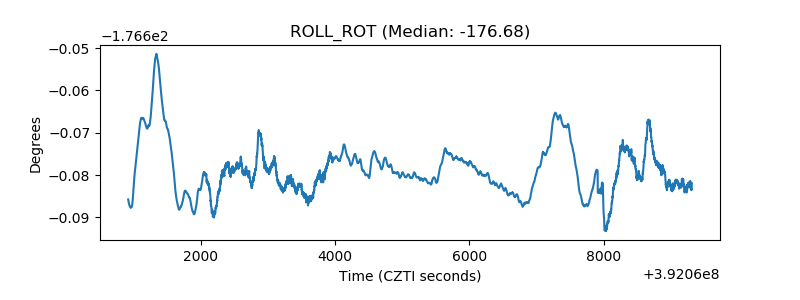 |
| _Roll_DEC | 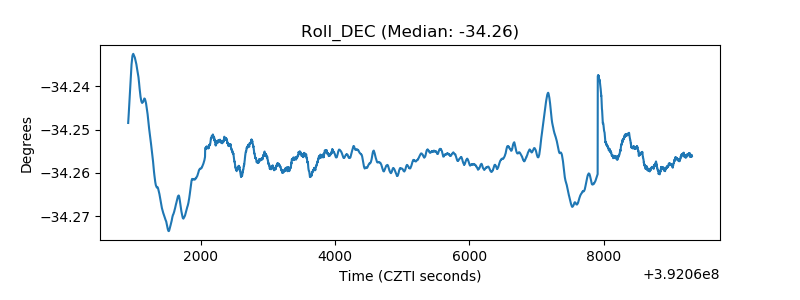 |
| _Roll_RA | 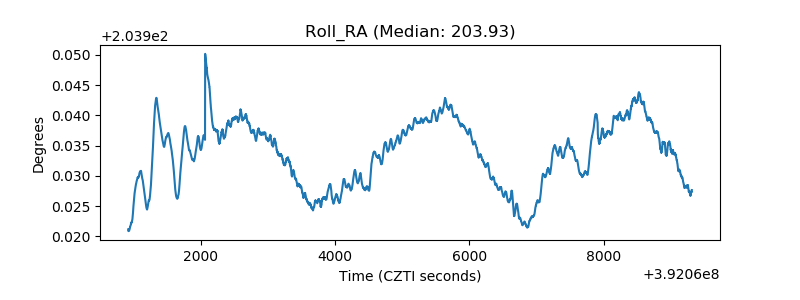 |
| Veto Counter | 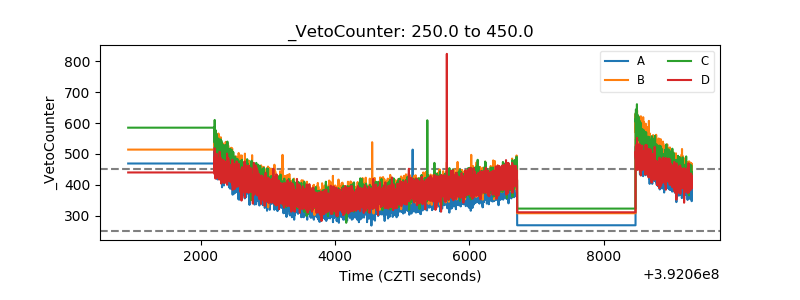 |