| Param | Original file | Final file |
|---|---|---|
| Filename | modeM0/AS1T04_069T01_9000005158_36148cztM0_level2.evt | modeM0/AS1T04_069T01_9000005158_36148cztM0_level2_quad_clean.evt |
| Size (bytes) | 399,844,800 | 54,984,960 |
| Size | 381.3 MB | 52.4 MB |
| Events in quadrant A | 2,627,650 | 328,711 |
| Events in quadrant B | 3,123,064 | 329,998 |
| Events in quadrant C | 2,761,766 | 325,533 |
| Events in quadrant D | 3,234,058 | 306,712 |
Noise dominated data is calculated using 1-second bins in cleaned event files. If a bin has >2000 counts, and if more than 50% of those come from <1% of pixels, then it is considered to be noise-dominated and hence unusable.
| Quadrant | # 1 sec bins | Bins with >0 counts | Bins with >2000 counts | High rate bins dominated by noise | Noise dominated (total time) | Noise dominated (detector-on time) | Marked lightcurve |
|---|---|---|---|---|---|---|---|
| A | 7189 | 5338 | 2 | 2 | 0.03% | 0.04% | 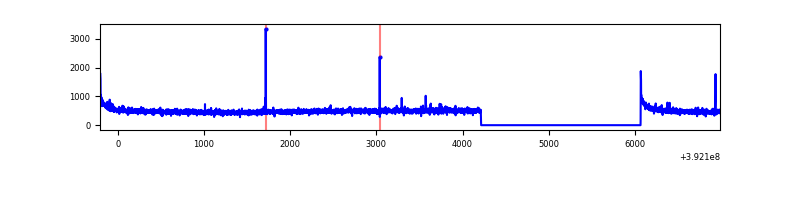 |
| B | 7189 | 5338 | 41 | 41 | 0.57% | 0.77% | 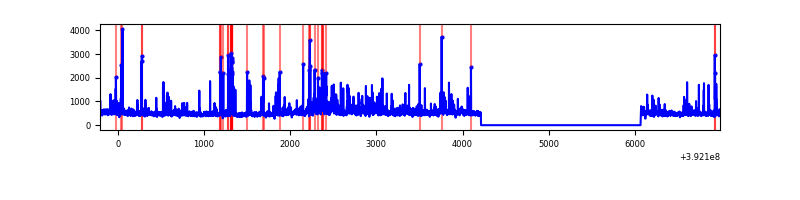 |
| C | 7189 | 5338 | 29 | 29 | 0.40% | 0.54% | 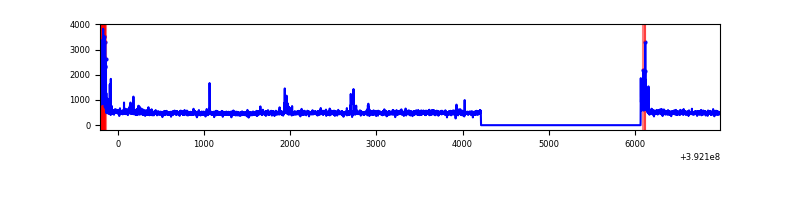 |
| D | 7189 | 5338 | 104 | 104 | 1.45% | 1.95% | 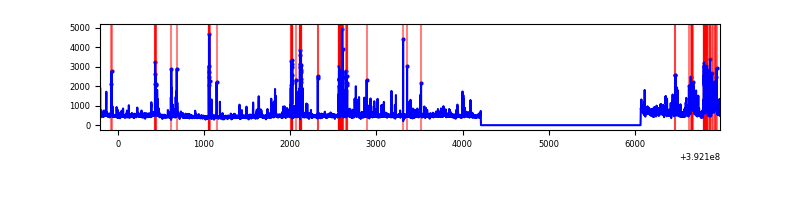 |
Top three noisy pixels from each quadrant. If the there are fewer than three noisy pixels in the level2.evt file, extra rows are filled as -1
| Pixel properties | Quadrant properties | ||||||
|---|---|---|---|---|---|---|---|
| Quadrant | DetID | PixID | Counts | Sigma | Mean | Median | Sigma |
| A | 10 | 83 | 176966 | 1422.59 | 619 | 607 | 124.0 |
| A | 8 | 144 | 22365 | 175.51 | 619 | 607 | 124.0 |
| A | 9 | 143 | 20838 | 163.19 | 619 | 607 | 124.0 |
| B | 5 | 172 | 420822 | 3537.55 | 615 | 600 | 118.8 |
| B | 0 | 213 | 138818 | 1163.56 | 615 | 600 | 118.8 |
| B | 0 | 190 | 56496 | 470.55 | 615 | 600 | 118.8 |
| C | 15 | 214 | 228665 | 1616.07 | 601 | 602 | 141.1 |
| C | 0 | 10 | 167535 | 1182.9 | 601 | 602 | 141.1 |
| C | 0 | 207 | 22215 | 153.15 | 601 | 602 | 141.1 |
| D | 1 | 52 | 316811 | 2146.09 | 595 | 577 | 147.4 |
| D | 13 | 249 | 308021 | 2086.44 | 595 | 577 | 147.4 |
| D | 2 | 250 | 80567 | 542.84 | 595 | 577 | 147.4 |
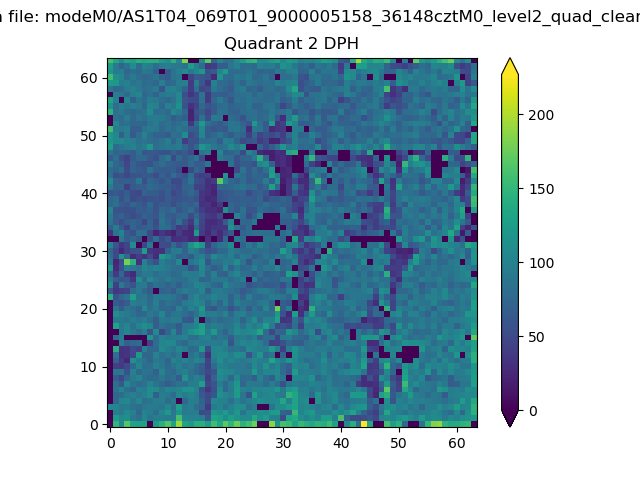
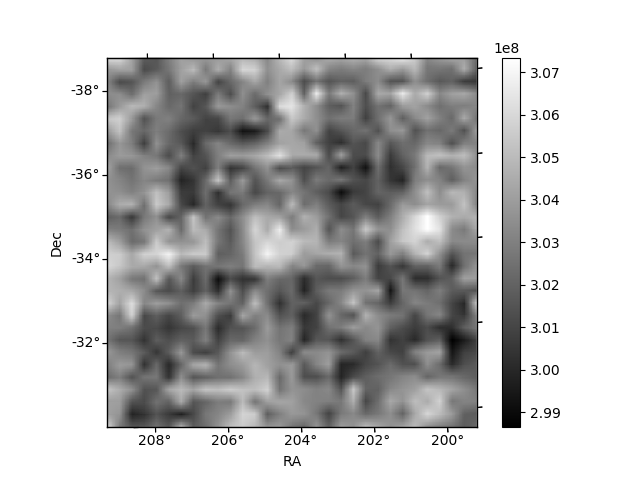
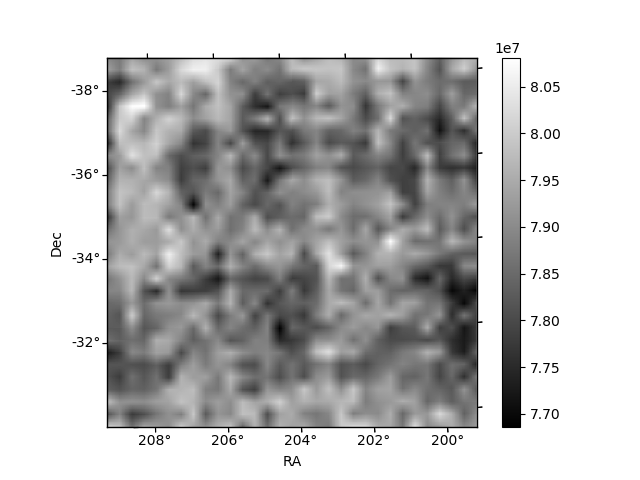
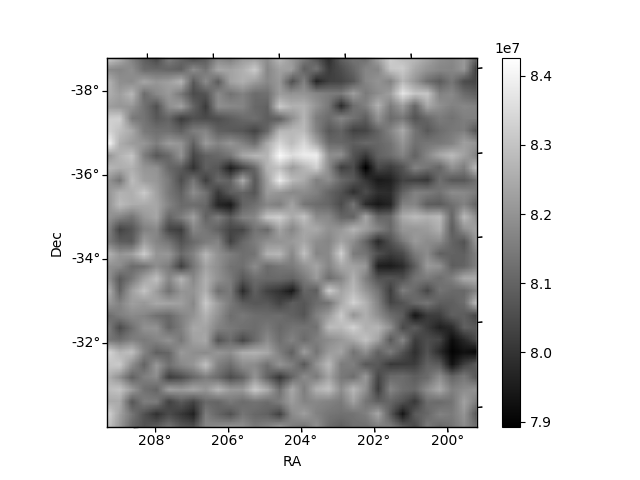
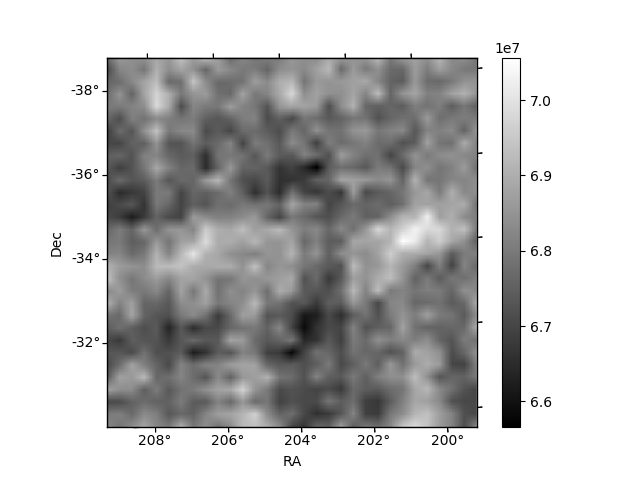
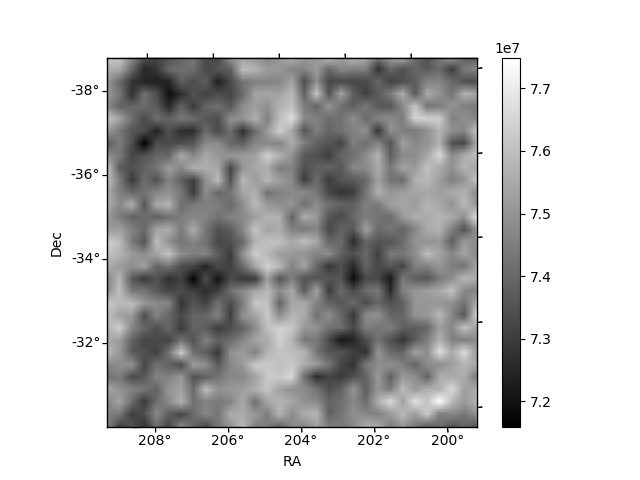
Histogram calculated using DETX and DETY for each event in the final _common_clean file
| Quadrant A | 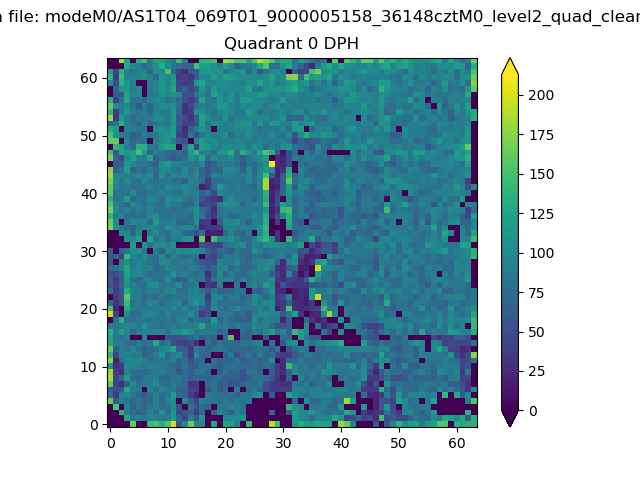 |
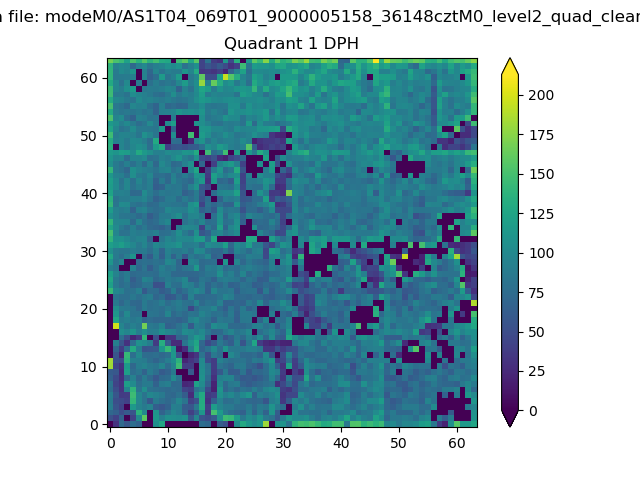 |
Quadrant B |
|---|---|---|---|
| Quadrant D | 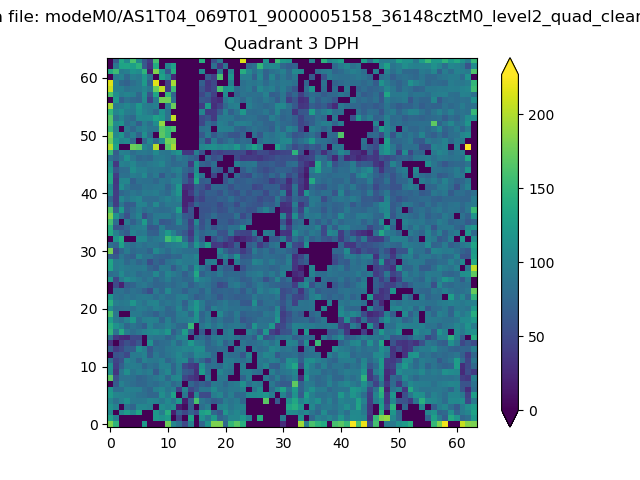 |
 |
Quadrant C |
| Plot type | Count rate plots | Images |
|---|---|---|
| Comparison with Poisson distribution Blue bars denote a histogram of data divided into 1 sec bins. Red curve is a Poisson curve with rate = median count rate of data. |
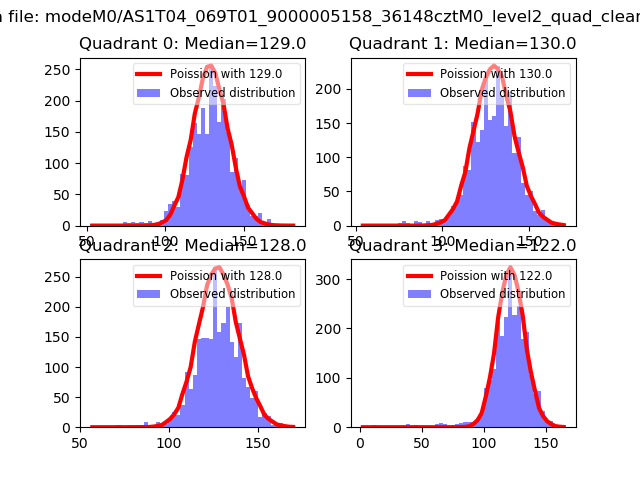 |
 |
| Quadrant-wise count rates Data is divided into 100 sec bins |
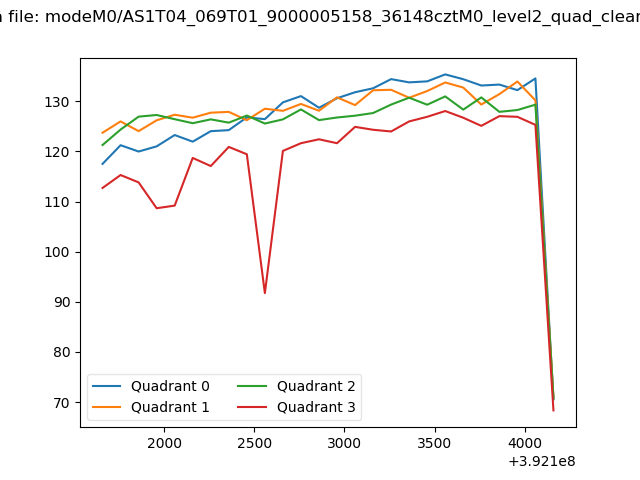 |
|
| Module-wise count rates for Quadrant A Data is divided into 100 sec bins |
 |
 |
| Module-wise count rates for Quadrant B Data is divided into 100 sec bins |
 |
 |
| Module-wise count rates for Quadrant C Data is divided into 100 sec bins |
 |
 |
| Module-wise count rates for Quadrant D Data is divided into 100 sec bins |
 |
 |
| Parameter | Plot |
|---|---|
| CZT HV Monitor |  |
| D_VDD | 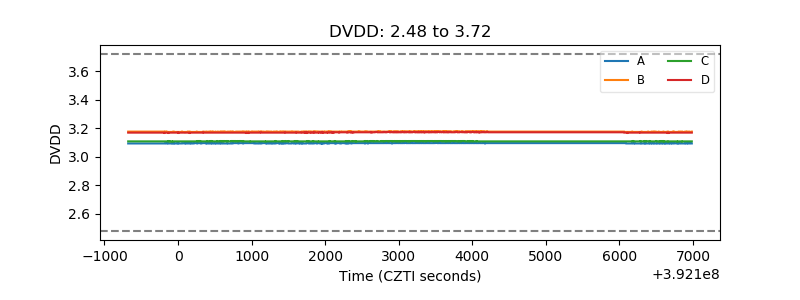 |
| Temperature 1 | 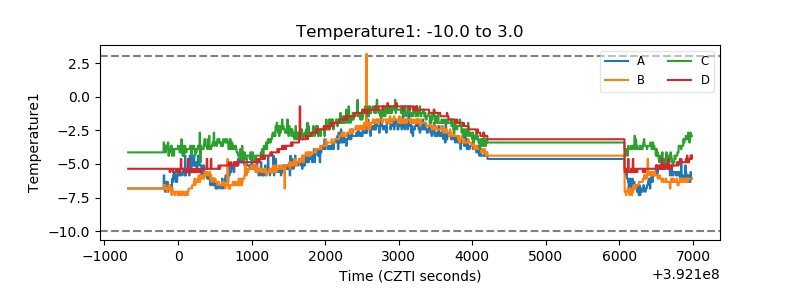 |
| Veto HV Monitor | 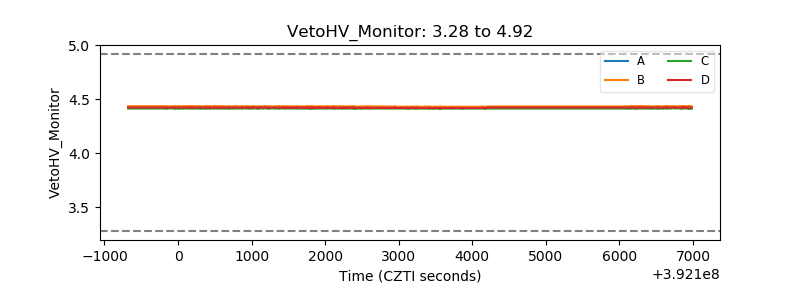 |
| Veto LLD | 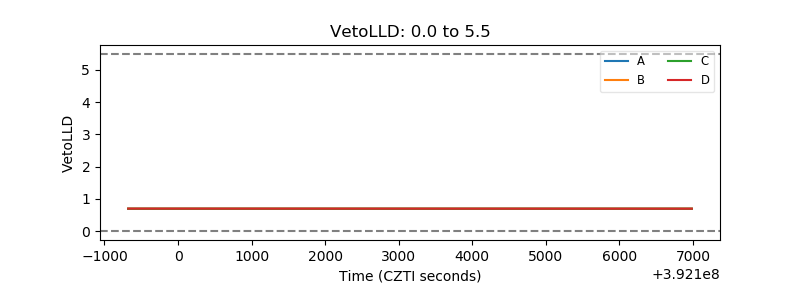 |
| Alpha Counter |  |
| _CPM_Rate | 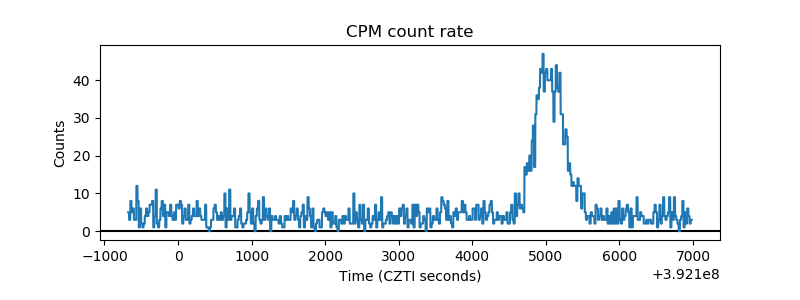 |
| CZT Counter | 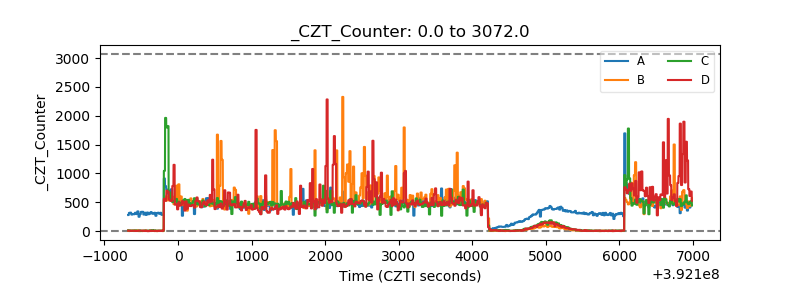 |
| +2.5 Volts monitor |  |
| +5 Volts monitor |  |
| _ROLL_ROT | 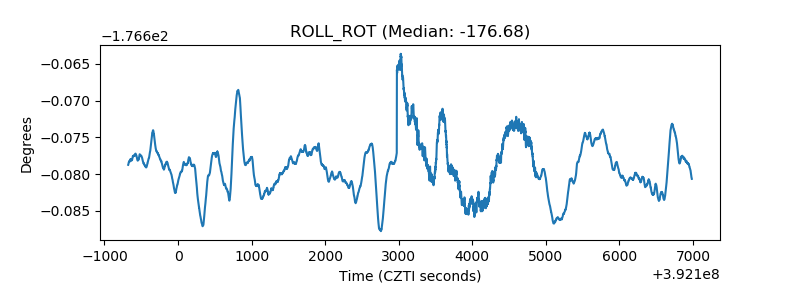 |
| _Roll_DEC | 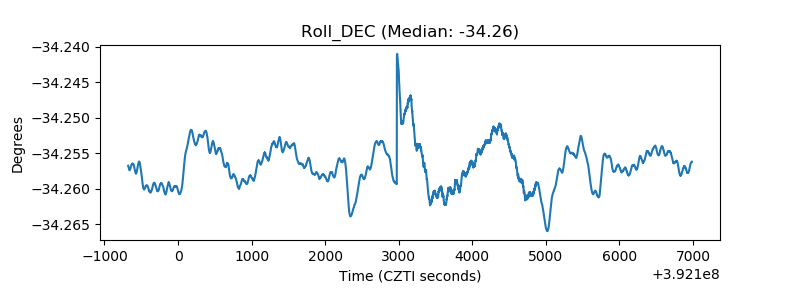 |
| _Roll_RA | 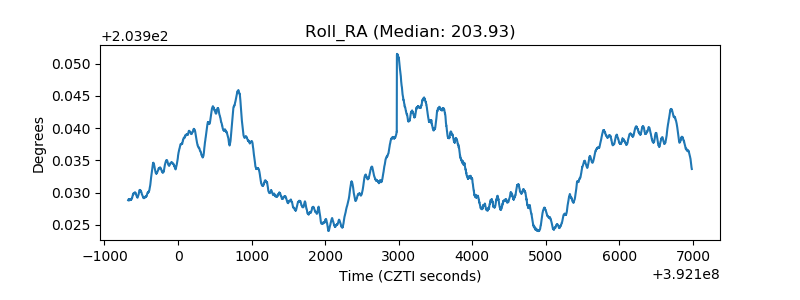 |
| Veto Counter | 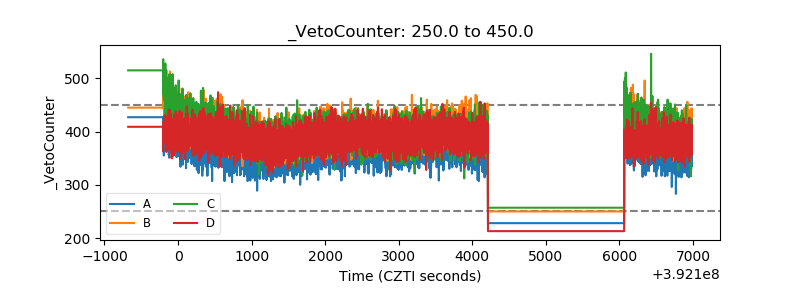 |