| Param | Original file | Final file |
|---|---|---|
| Filename | modeM0/AS1T05_009T03_9000005164cztM0_level2.fits | modeM0/AS1T05_009T03_9000005164cztM0_level2_quad_clean.evt |
| Size (bytes) | 35,153,280 | 33,649,920 |
| Size | 33.5 MB | 32.1 MB |
| Events in quadrant A | 214,018 | 195,940 |
| Events in quadrant B | 205,468 | 195,570 |
| Events in quadrant C | 212,238 | 195,732 |
| Events in quadrant D | 182,078 | 179,913 |
| Mode M9 | |||
|---|---|---|---|
| Quadrant | BADHDUFLAG | Total packets | Discarded packets |
| A | 0 | 20 | 0 |
| B | 0 | 20 | 0 |
| C | 0 | 20 | 0 |
| D | 0 | 20 | 0 |
| Mode M0 | |||
|---|---|---|---|
| Quadrant | BADHDUFLAG | Total packets | Discarded packets |
| A | 0 | 7317 | 0 |
| B | 0 | 9637 | 0 |
| C | 0 | 8503 | 0 |
| D | 0 | 8035 | 0 |
| Mode SS | |||
|---|---|---|---|
| Quadrant | BADHDUFLAG | Total packets | Discarded packets |
| A | 0 | 74 | 0 |
| B | 0 | 74 | 0 |
| C | 0 | 74 | 0 |
| D | 0 | 74 | 0 |
| Quadrant | Total seconds | Saturated seconds | Saturation percentage |
|---|---|---|---|
| A | 3540 | 3 | 0.084746% |
| B | 3540 | 141 | 3.983051% |
| C | 3540 | 57 | 1.610169% |
| D | 3540 | 47 | 1.327684% |
Noise dominated data is calculated using 1-second bins in cleaned event files. If a bin has >2000 counts, and if more than 50% of those come from <1% of pixels, then it is considered to be noise-dominated and hence unusable.
| Quadrant | # 1 sec bins | Bins with >0 counts | Bins with >2000 counts | High rate bins dominated by noise | Noise dominated (total time) | Noise dominated (detector-on time) | Marked lightcurve |
|---|---|---|---|---|---|---|---|
| A | 5633 | 3540 | 0 | 0 | 0.00% | 0.00% |  |
| B | 5633 | 3540 | 0 | 0 | 0.00% | 0.00% |  |
| C | 5633 | 3540 | 0 | 0 | 0.00% | 0.00% |  |
| D | 5633 | 3538 | 0 | 0 | 0.00% | 0.00% |  |
Top three noisy pixels from each quadrant. If the there are fewer than three noisy pixels in the level2.evt file, extra rows are filled as -1
| Pixel properties | Quadrant properties | ||||||
|---|---|---|---|---|---|---|---|
| Quadrant | DetID | PixID | Counts | Sigma | Mean | Median | Sigma |
| A | 7 | 110 | 188 | 8.73 | 55 | 53 | 15.5 |
| A | 9 | 19 | 180 | 8.21 | 55 | 53 | 15.5 |
| A | 14 | 79 | 169 | 7.5 | 55 | 53 | 15.5 |
| B | 2 | 9 | 192 | 10.91 | 54 | 52 | 12.8 |
| B | 2 | 8 | 171 | 9.27 | 54 | 52 | 12.8 |
| B | 5 | 128 | 160 | 8.41 | 54 | 52 | 12.8 |
| C | 1 | 81 | 170 | 7.32 | 56 | 53 | 16.0 |
| C | 15 | 65 | 168 | 7.2 | 56 | 53 | 16.0 |
| C | 3 | 202 | 165 | 7.01 | 56 | 53 | 16.0 |
| D | 7 | 3 | 163 | 7.58 | 51 | 47 | 15.3 |
| D | 10 | 189 | 149 | 6.66 | 51 | 47 | 15.3 |
| D | 1 | 3 | 146 | 6.47 | 51 | 47 | 15.3 |
Histogram calculated using DETX and DETY for each event in the final _common_clean file
| Quadrant A | 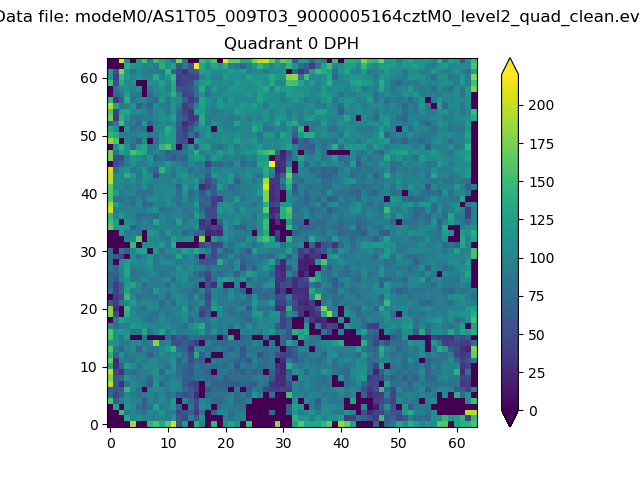 |
 |
Quadrant B |
|---|---|---|---|
| Quadrant D | 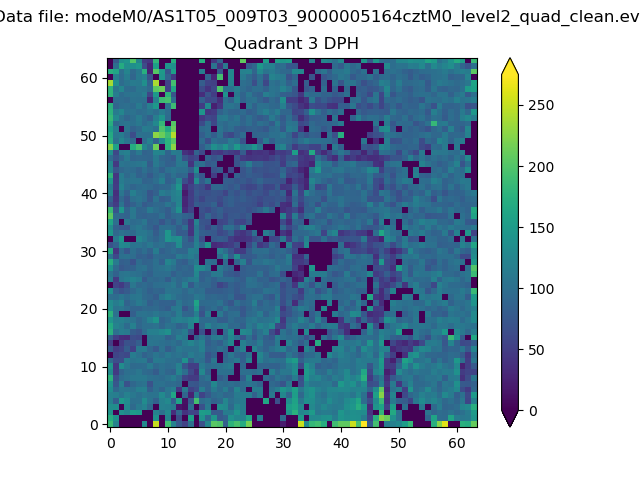 |
 |
Quadrant C |
| Plot type | Count rate plots | Images |
|---|---|---|
| Comparison with Poisson distribution Blue bars denote a histogram of data divided into 1 sec bins. Red curve is a Poisson curve with rate = median count rate of data. |
 |
 |
| Quadrant-wise count rates Data is divided into 100 sec bins |
 |
|
| Module-wise count rates for Quadrant A Data is divided into 100 sec bins |
 |
 |
| Module-wise count rates for Quadrant B Data is divided into 100 sec bins |
 |
 |
| Module-wise count rates for Quadrant C Data is divided into 100 sec bins |
 |
 |
| Module-wise count rates for Quadrant D Data is divided into 100 sec bins |
 |
 |
| Parameter | Plot |
|---|---|
| CZT HV Monitor |  |
| D_VDD |  |
| Temperature 1 |  |
| Veto HV Monitor |  |
| Veto LLD |  |
| Alpha Counter |  |
| _CPM_Rate |  |
| CZT Counter |  |
| +2.5 Volts monitor |  |
| +5 Volts monitor |  |
| _ROLL_ROT |  |
| _Roll_DEC |  |
| _Roll_RA |  |
| Veto Counter |  |