| Param | Original file | Final file |
|---|---|---|
| Filename | modeM0/AS1T05_009T05_9000005162cztM0_level2.fits | modeM0/AS1T05_009T05_9000005162cztM0_level2_quad_clean.evt |
| Size (bytes) | 59,935,680 | 52,035,840 |
| Size | 57.2 MB | 49.6 MB |
| Events in quadrant A | 367,938 | 297,161 |
| Events in quadrant B | 354,116 | 297,033 |
| Events in quadrant C | 365,098 | 286,869 |
| Events in quadrant D | 302,080 | 267,955 |
| Mode M9 | |||
|---|---|---|---|
| Quadrant | BADHDUFLAG | Total packets | Discarded packets |
| A | 0 | 20 | 0 |
| B | 0 | 20 | 0 |
| C | 0 | 20 | 0 |
| D | 0 | 20 | 0 |
| Mode SS | |||
|---|---|---|---|
| Quadrant | BADHDUFLAG | Total packets | Discarded packets |
| A | 0 | 124 | 0 |
| B | 0 | 124 | 0 |
| C | 0 | 124 | 0 |
| D | 0 | 124 | 0 |
| Mode M0 | |||
|---|---|---|---|
| Quadrant | BADHDUFLAG | Total packets | Discarded packets |
| A | 0 | 12467 | 0 |
| B | 0 | 15191 | 0 |
| C | 0 | 14688 | 0 |
| D | 0 | 17124 | 0 |
| Quadrant | Total seconds | Saturated seconds | Saturation percentage |
|---|---|---|---|
| A | 6100 | 8 | 0.131148% |
| B | 6100 | 162 | 2.655738% |
| C | 6100 | 173 | 2.836066% |
| D | 6100 | 398 | 6.524590% |
Noise dominated data is calculated using 1-second bins in cleaned event files. If a bin has >2000 counts, and if more than 50% of those come from <1% of pixels, then it is considered to be noise-dominated and hence unusable.
| Quadrant | # 1 sec bins | Bins with >0 counts | Bins with >2000 counts | High rate bins dominated by noise | Noise dominated (total time) | Noise dominated (detector-on time) | Marked lightcurve |
|---|---|---|---|---|---|---|---|
| A | 8103 | 6100 | 0 | 0 | 0.00% | 0.00% |  |
| B | 8103 | 6098 | 0 | 0 | 0.00% | 0.00% |  |
| C | 8103 | 6100 | 0 | 0 | 0.00% | 0.00% |  |
| D | 8103 | 6057 | 0 | 0 | 0.00% | 0.00% |  |
Top three noisy pixels from each quadrant. If the there are fewer than three noisy pixels in the level2.evt file, extra rows are filled as -1
| Pixel properties | Quadrant properties | ||||||
|---|---|---|---|---|---|---|---|
| Quadrant | DetID | PixID | Counts | Sigma | Mean | Median | Sigma |
| A | 0 | 29 | 290 | 7.79 | 96 | 91 | 25.5 |
| A | 14 | 95 | 282 | 7.48 | 96 | 91 | 25.5 |
| A | 7 | 110 | 281 | 7.44 | 96 | 91 | 25.5 |
| B | 2 | 9 | 294 | 10.09 | 93 | 90 | 20.2 |
| B | 3 | 80 | 284 | 9.6 | 93 | 90 | 20.2 |
| B | 5 | 128 | 262 | 8.51 | 93 | 90 | 20.2 |
| C | 1 | 81 | 367 | 10.36 | 96 | 91 | 26.6 |
| C | 1 | 80 | 340 | 9.35 | 96 | 91 | 26.6 |
| C | 3 | 203 | 339 | 9.31 | 96 | 91 | 26.6 |
| D | 10 | 189 | 235 | 6.33 | 86 | 79 | 24.6 |
| D | 7 | 3 | 230 | 6.13 | 86 | 79 | 24.6 |
| D | 6 | 83 | 230 | 6.13 | 86 | 79 | 24.6 |
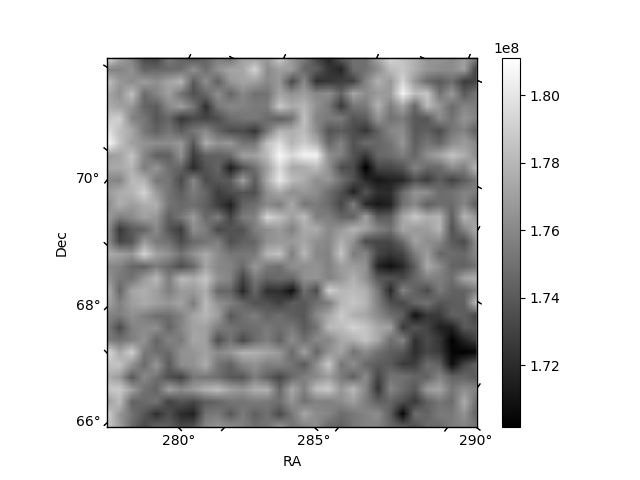
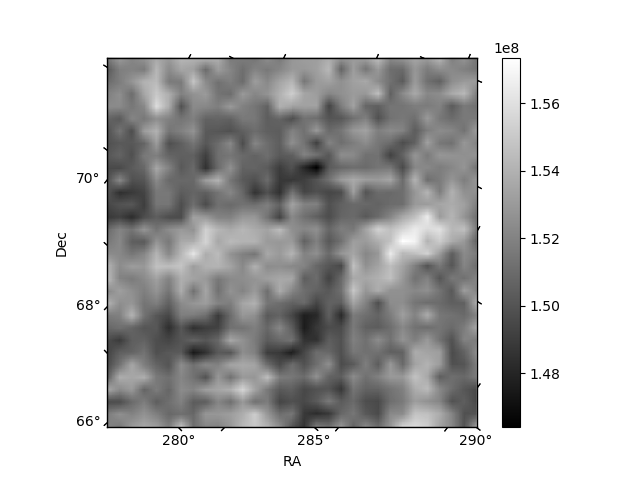
Histogram calculated using DETX and DETY for each event in the final _common_clean file
| Quadrant A | 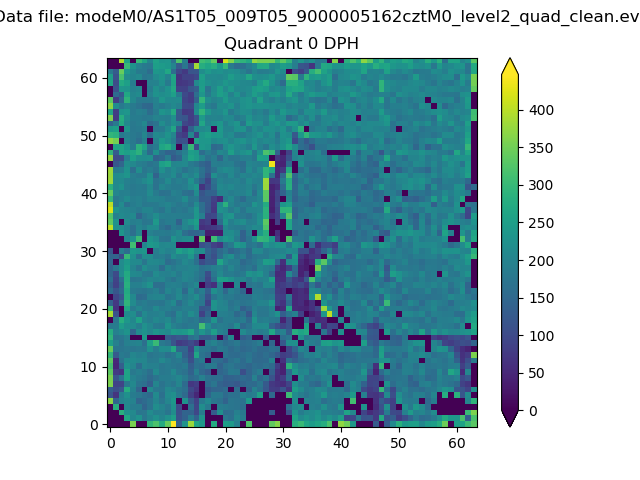 |
 |
Quadrant B |
|---|---|---|---|
| Quadrant D | 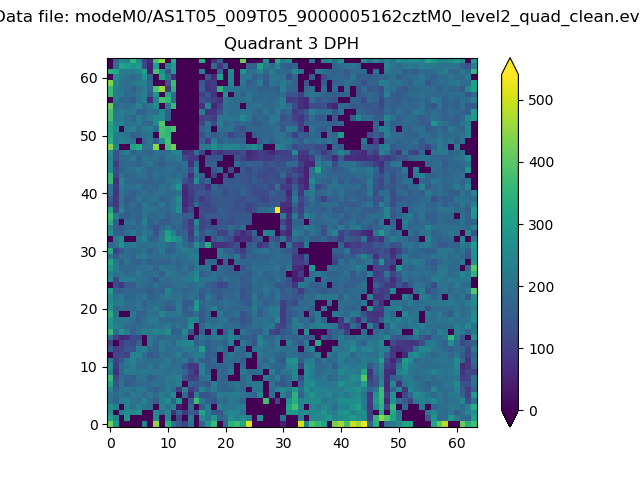 |
 |
Quadrant C |
| Plot type | Count rate plots | Images |
|---|---|---|
| Comparison with Poisson distribution Blue bars denote a histogram of data divided into 1 sec bins. Red curve is a Poisson curve with rate = median count rate of data. |
 |
 |
| Quadrant-wise count rates Data is divided into 100 sec bins |
 |
|
| Module-wise count rates for Quadrant A Data is divided into 100 sec bins |
 |
 |
| Module-wise count rates for Quadrant B Data is divided into 100 sec bins |
 |
 |
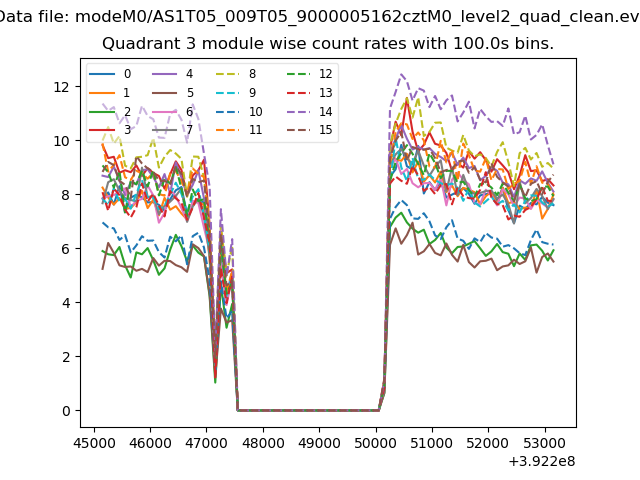
| Module-wise count rates for Quadrant C Data is divided into 100 sec bins |
 |
 |
| Module-wise count rates for Quadrant D Data is divided into 100 sec bins |
 |
 |
| Parameter | Plot |
|---|---|
| CZT HV Monitor |  |
| D_VDD |  |
| Temperature 1 |  |
| Veto HV Monitor | 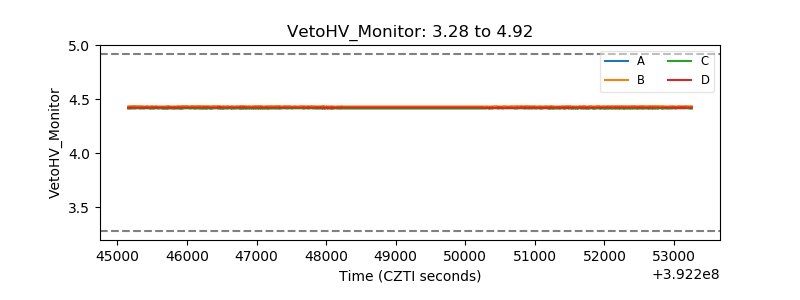 |
| Veto LLD | 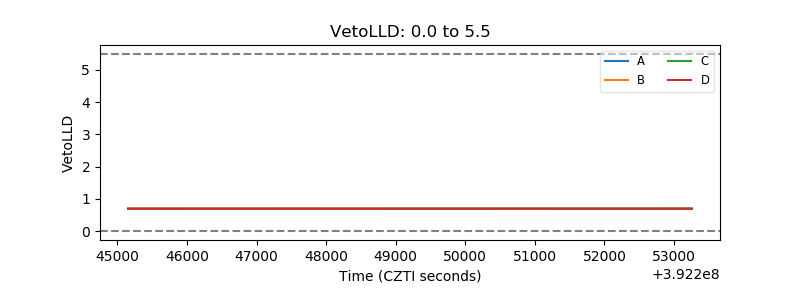 |
| Alpha Counter |  |
| _CPM_Rate |  |
| CZT Counter | 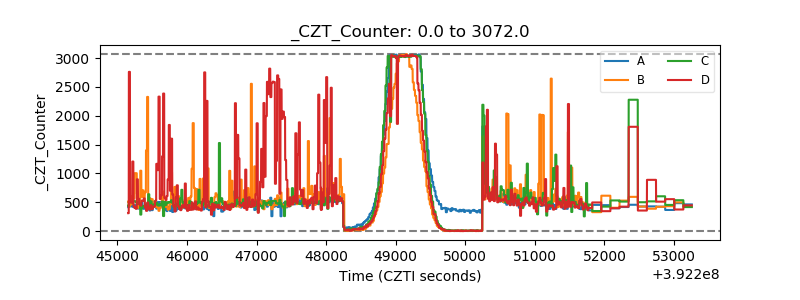 |
| +2.5 Volts monitor |  |
| +5 Volts monitor |  |
| _ROLL_ROT |  |
| _Roll_DEC |  |
| _Roll_RA |  |
| Veto Counter |  |