| Param | Original file | Final file |
|---|---|---|
| Filename | modeM0/AS1A11_097T17_9000005170cztM0_level2.fits | modeM0/AS1A11_097T17_9000005170cztM0_level2_quad_clean.evt |
| Size (bytes) | 520,793,280 | 520,130,880 |
| Size | 496.7 MB | 496.0 MB |
| Events in quadrant A | 3,213,922 | 3,250,932 |
| Events in quadrant B | 3,090,810 | 3,242,617 |
| Events in quadrant C | 2,913,784 | 2,709,710 |
| Events in quadrant D | 2,644,126 | 2,643,509 |
| Mode SS | |||
|---|---|---|---|
| Quadrant | BADHDUFLAG | Total packets | Discarded packets |
| A | 0 | 1168 | 0 |
| B | 0 | 1168 | 0 |
| C | 0 | 1168 | 0 |
| D | 0 | 1168 | 0 |
| Mode M0 | |||
|---|---|---|---|
| Quadrant | BADHDUFLAG | Total packets | Discarded packets |
| A | 0 | 119064 | 0 |
| B | 0 | 126043 | 0 |
| C | 0 | 188385 | 0 |
| D | 0 | 170157 | 0 |
| Mode M9 | |||
|---|---|---|---|
| Quadrant | BADHDUFLAG | Total packets | Discarded packets |
| A | 0 | 220 | 0 |
| B | 0 | 220 | 0 |
| C | 0 | 220 | 0 |
| D | 0 | 220 | 0 |
| Quadrant | Total seconds | Saturated seconds | Saturation percentage |
|---|---|---|---|
| A | 56903 | 131 | 0.230216% |
| B | 56903 | 707 | 1.242465% |
| C | 56903 | 7655 | 13.452718% |
| D | 56903 | 4270 | 7.503998% |
Noise dominated data is calculated using 1-second bins in cleaned event files. If a bin has >2000 counts, and if more than 50% of those come from <1% of pixels, then it is considered to be noise-dominated and hence unusable.
| Quadrant | # 1 sec bins | Bins with >0 counts | Bins with >2000 counts | High rate bins dominated by noise | Noise dominated (total time) | Noise dominated (detector-on time) | Marked lightcurve |
|---|---|---|---|---|---|---|---|
| A | 79070 | 56904 | 0 | 0 | 0.00% | 0.00% | 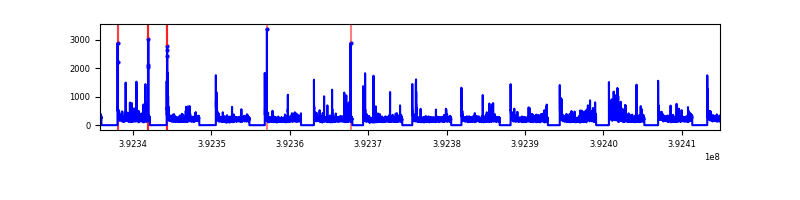 |
| B | 79070 | 56902 | 0 | 0 | 0.00% | 0.00% |  |
| C | 79070 | 56525 | 0 | 0 | 0.00% | 0.00% |  |
| D | 79070 | 56861 | 0 | 0 | 0.00% | 0.00% |  |
Top three noisy pixels from each quadrant. If the there are fewer than three noisy pixels in the level2.evt file, extra rows are filled as -1
| Pixel properties | Quadrant properties | ||||||
|---|---|---|---|---|---|---|---|
| Quadrant | DetID | PixID | Counts | Sigma | Mean | Median | Sigma |
| A | 9 | 19 | 2653 | 8.9 | 839 | 787 | 209.5 |
| A | 0 | 29 | 2635 | 8.82 | 839 | 787 | 209.5 |
| A | 7 | 110 | 2606 | 8.68 | 839 | 787 | 209.5 |
| B | 2 | 9 | 2649 | 11.51 | 818 | 781 | 162.4 |
| B | 3 | 80 | 2341 | 9.61 | 818 | 781 | 162.4 |
| B | 2 | 8 | 2219 | 8.86 | 818 | 781 | 162.4 |
| C | 1 | 81 | 2452 | 8.59 | 772 | 723 | 201.3 |
| C | 1 | 80 | 2373 | 8.2 | 772 | 723 | 201.3 |
| C | 3 | 187 | 1986 | 6.28 | 772 | 723 | 201.3 |
| D | 7 | 3 | 1944 | 6.24 | 756 | 687 | 201.6 |
| D | 6 | 67 | 1942 | 6.23 | 756 | 687 | 201.6 |
| D | 10 | 113 | 1939 | 6.21 | 756 | 687 | 201.6 |
Histogram calculated using DETX and DETY for each event in the final _common_clean file
| Quadrant A |  |
 |
Quadrant B |
|---|---|---|---|
| Quadrant D | 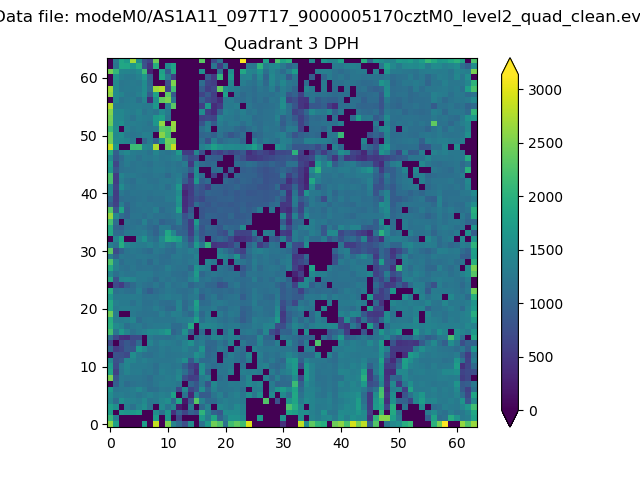 |
 |
Quadrant C |
| Plot type | Count rate plots | Images |
|---|---|---|
| Comparison with Poisson distribution Blue bars denote a histogram of data divided into 1 sec bins. Red curve is a Poisson curve with rate = median count rate of data. |
 |
 |
| Quadrant-wise count rates Data is divided into 100 sec bins |
 |
|
| Module-wise count rates for Quadrant A Data is divided into 100 sec bins |
 |
 |
| Module-wise count rates for Quadrant B Data is divided into 100 sec bins |
 |
 |
| Module-wise count rates for Quadrant C Data is divided into 100 sec bins |
 |
 |
| Module-wise count rates for Quadrant D Data is divided into 100 sec bins |
 |
 |
| Parameter | Plot |
|---|---|
| CZT HV Monitor | 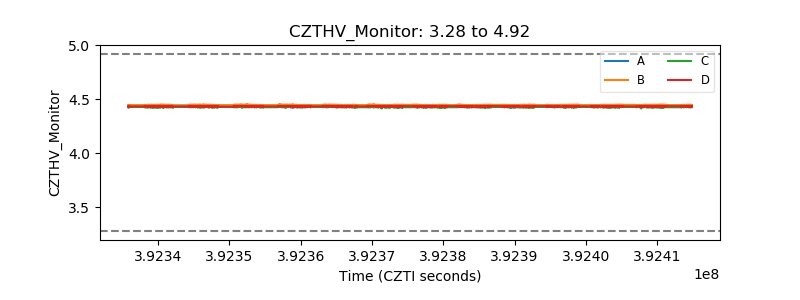 |
| D_VDD |  |
| Temperature 1 |  |
| Veto HV Monitor |  |
| Veto LLD |  |
| Alpha Counter |  |
| _CPM_Rate |  |
| CZT Counter |  |
| +2.5 Volts monitor |  |
| +5 Volts monitor |  |
| _ROLL_ROT |  |
| _Roll_DEC |  |
| _Roll_RA | 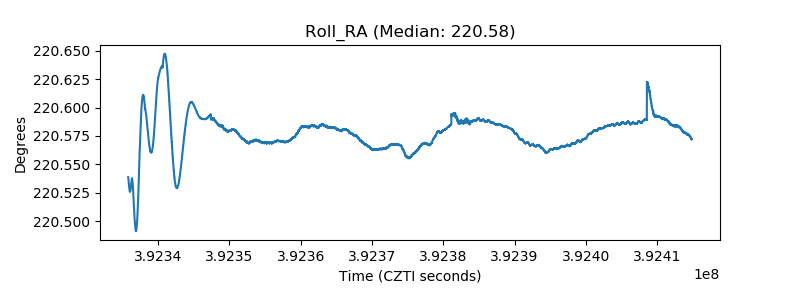 |
| Veto Counter |  |