| Param | Original file | Final file |
|---|---|---|
| Filename | modeM0/AS1A11_097T17_9000005170_36190cztM0_level2.evt | modeM0/AS1A11_097T17_9000005170_36190cztM0_level2_quad_clean.evt |
| Size (bytes) | 367,626,240 | 57,473,280 |
| Size | 350.6 MB | 54.8 MB |
| Events in quadrant A | 2,454,637 | 352,039 |
| Events in quadrant B | 2,709,956 | 361,486 |
| Events in quadrant C | 2,811,490 | 350,923 |
| Events in quadrant D | 2,824,920 | 332,666 |
| Mode SS | |||
|---|---|---|---|
| Quadrant | BADHDUFLAG | Total packets | Discarded packets |
| A | 0 | 100 | 0 |
| B | 0 | 100 | 0 |
| C | 0 | 100 | 0 |
| D | 0 | 100 | 0 |
| Mode M0 | |||
|---|---|---|---|
| Quadrant | BADHDUFLAG | Total packets | Discarded packets |
| A | 0 | 10295 | 3 |
| B | 0 | 11171 | 2 |
| C | 0 | 11184 | 2 |
| D | 0 | 11748 | 2 |
| Mode M9 | |||
|---|---|---|---|
| Quadrant | BADHDUFLAG | Total packets | Discarded packets |
| A | 0 | 35 | 0 |
| B | 0 | 35 | 0 |
| C | 0 | 35 | 0 |
| D | 0 | 36 | 0 |
| Quadrant | Total seconds | Saturated seconds | Saturation percentage |
|---|---|---|---|
| A | 4887 | 19 | 0.388787% |
| B | 4887 | 55 | 1.125435% |
| C | 4887 | 73 | 1.493759% |
| D | 4887 | 114 | 2.332719% |
Noise dominated data is calculated using 1-second bins in cleaned event files. If a bin has >2000 counts, and if more than 50% of those come from <1% of pixels, then it is considered to be noise-dominated and hence unusable.
| Quadrant | # 1 sec bins | Bins with >0 counts | Bins with >2000 counts | High rate bins dominated by noise | Noise dominated (total time) | Noise dominated (detector-on time) | Marked lightcurve |
|---|---|---|---|---|---|---|---|
| A | 7009 | 4888 | 11 | 11 | 0.16% | 0.23% | 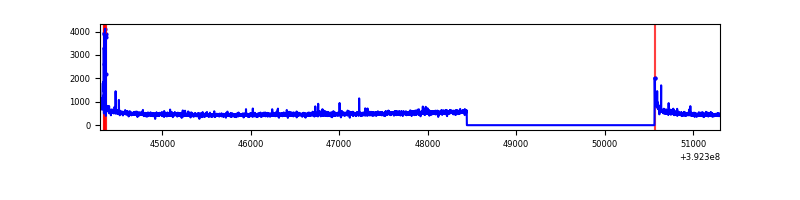 |
| B | 7009 | 4888 | 31 | 31 | 0.44% | 0.63% | 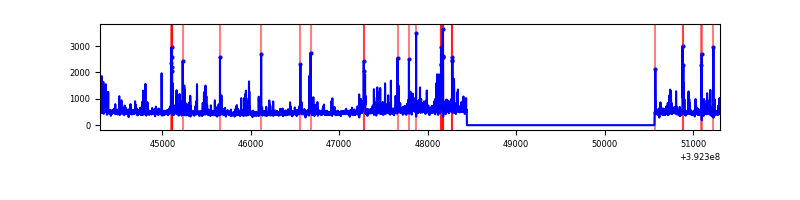 |
| C | 7009 | 4888 | 66 | 66 | 0.94% | 1.35% | 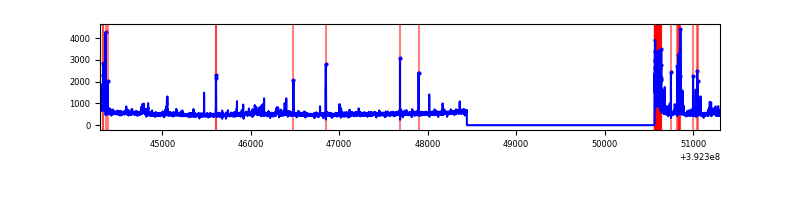 |
| D | 7009 | 4888 | 94 | 94 | 1.34% | 1.92% | 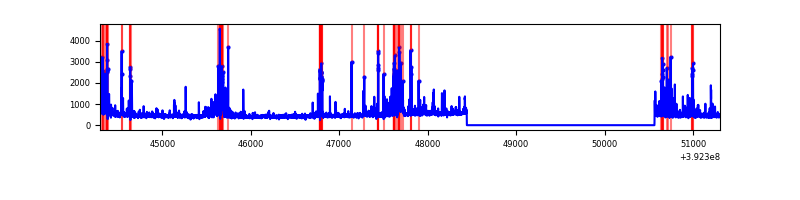 |
Top three noisy pixels from each quadrant. If the there are fewer than three noisy pixels in the level2.evt file, extra rows are filled as -1
| Pixel properties | Quadrant properties | ||||||
|---|---|---|---|---|---|---|---|
| Quadrant | DetID | PixID | Counts | Sigma | Mean | Median | Sigma |
| A | 10 | 83 | 161465 | 1399.24 | 570 | 560 | 115.0 |
| A | 9 | 143 | 56959 | 490.45 | 570 | 560 | 115.0 |
| A | 8 | 144 | 21880 | 185.4 | 570 | 560 | 115.0 |
| B | 5 | 172 | 297838 | 2731.24 | 570 | 554 | 108.8 |
| B | 5 | 236 | 86919 | 793.46 | 570 | 554 | 108.8 |
| B | 0 | 213 | 64827 | 590.5 | 570 | 554 | 108.8 |
| C | 15 | 214 | 223183 | 1731.5 | 556 | 559 | 128.6 |
| C | 0 | 10 | 170729 | 1323.53 | 556 | 559 | 128.6 |
| C | 4 | 254 | 109423 | 846.71 | 556 | 559 | 128.6 |
| D | 13 | 249 | 260770 | 1944.33 | 547 | 532 | 133.8 |
| D | 2 | 250 | 184347 | 1373.34 | 547 | 532 | 133.8 |
| D | 13 | 171 | 71061 | 526.95 | 547 | 532 | 133.8 |
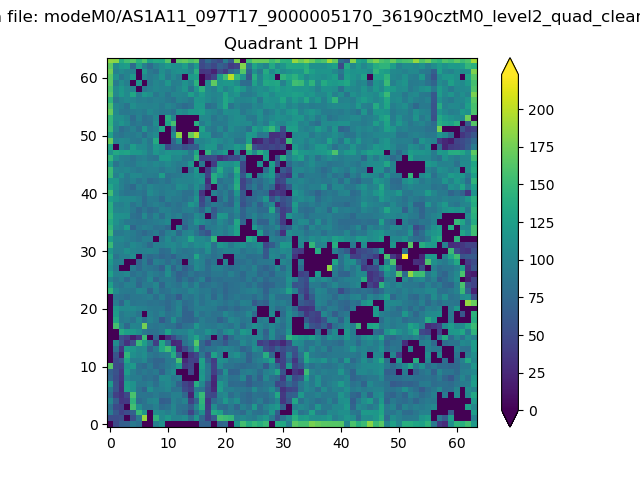
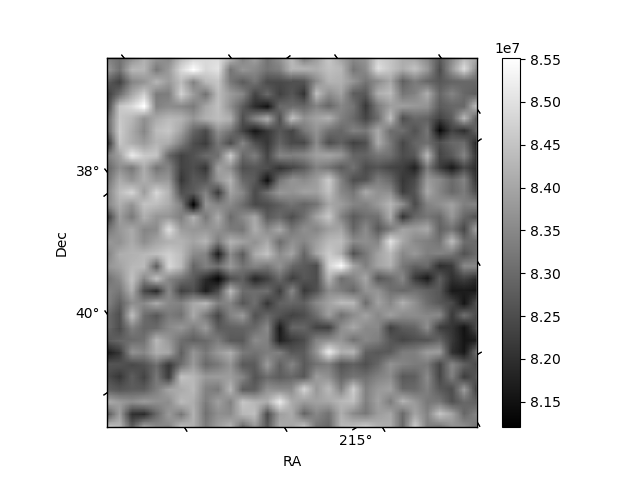
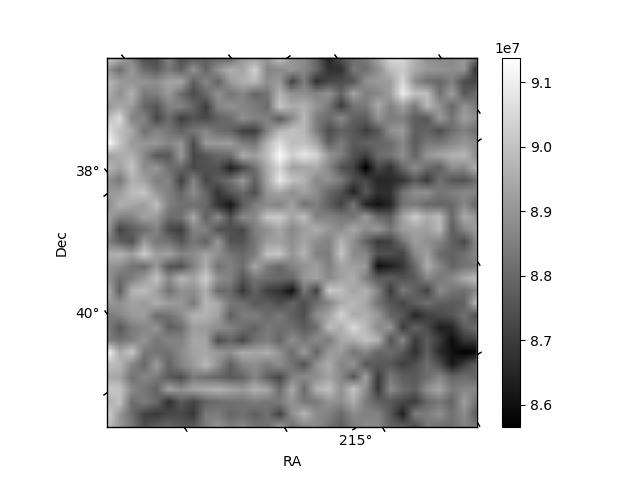
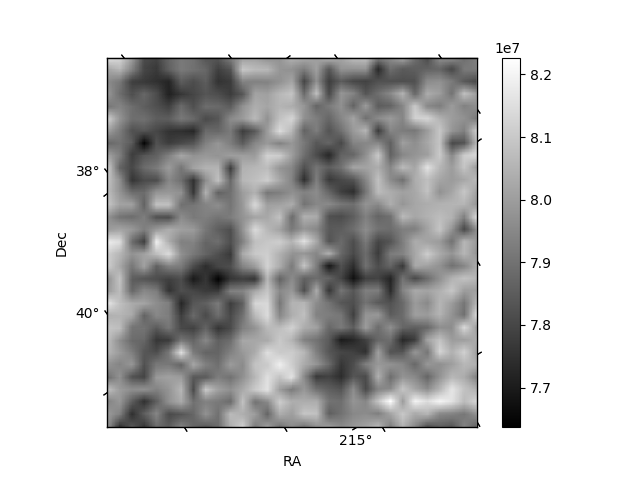
Histogram calculated using DETX and DETY for each event in the final _common_clean file
| Quadrant A |  |
 |
Quadrant B |
|---|---|---|---|
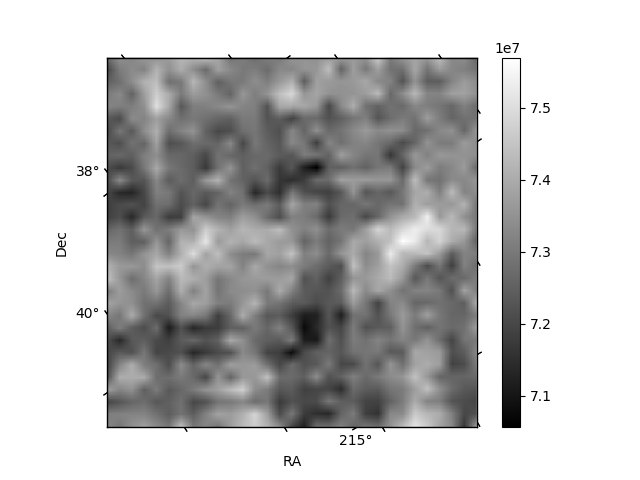
| Quadrant D | 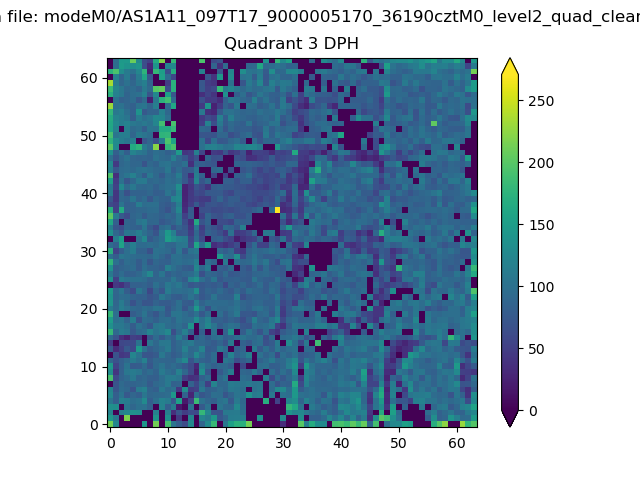 |
 |
Quadrant C |
| Plot type | Count rate plots | Images |
|---|---|---|
| Comparison with Poisson distribution Blue bars denote a histogram of data divided into 1 sec bins. Red curve is a Poisson curve with rate = median count rate of data. |
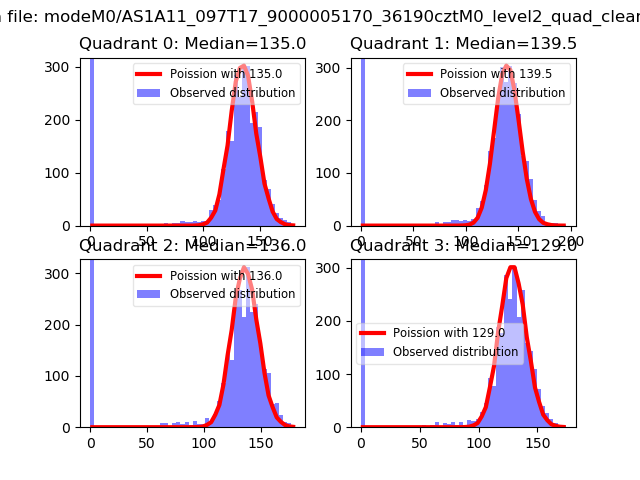 |
 |
| Quadrant-wise count rates Data is divided into 100 sec bins |
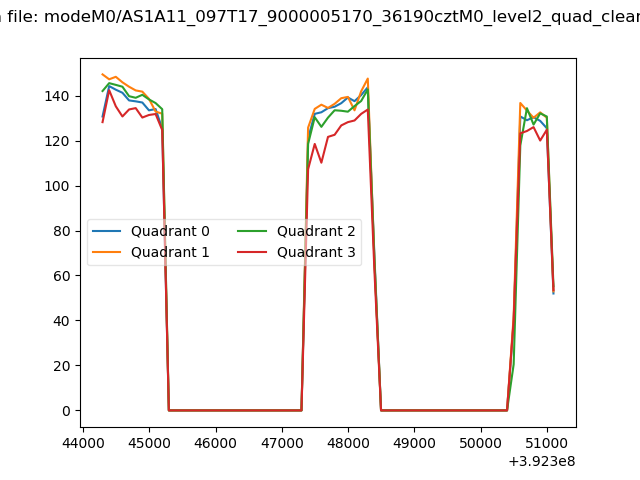 |
|
| Module-wise count rates for Quadrant A Data is divided into 100 sec bins |
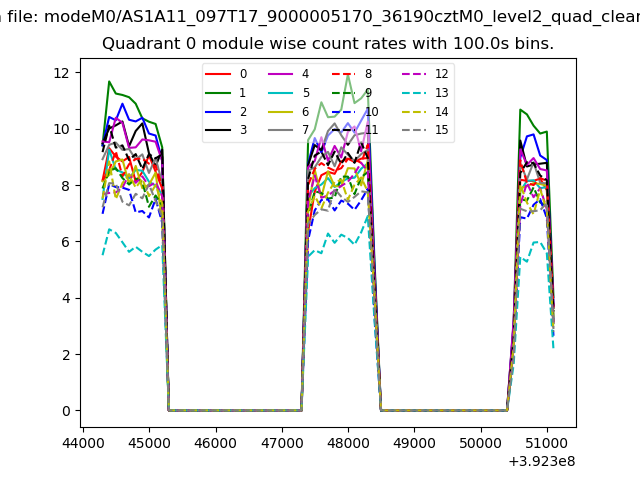 |
 |
| Module-wise count rates for Quadrant B Data is divided into 100 sec bins |
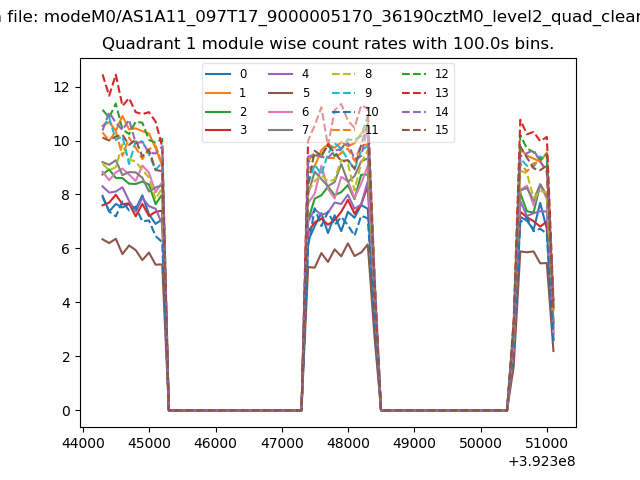 |
 |
| Module-wise count rates for Quadrant C Data is divided into 100 sec bins |
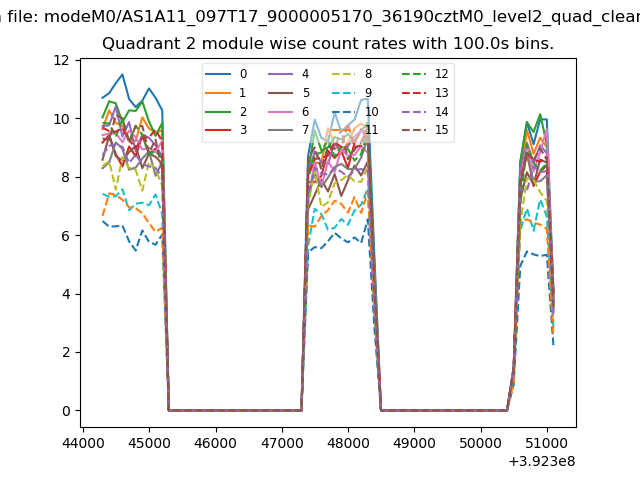 |
 |
| Module-wise count rates for Quadrant D Data is divided into 100 sec bins |
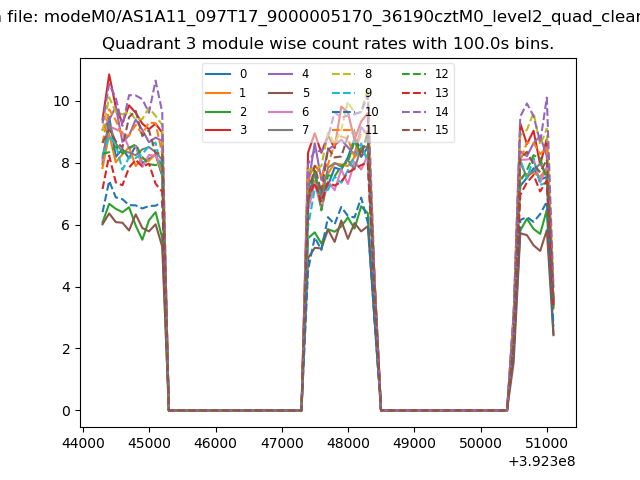 |
 |
| Parameter | Plot |
|---|---|
| CZT HV Monitor | 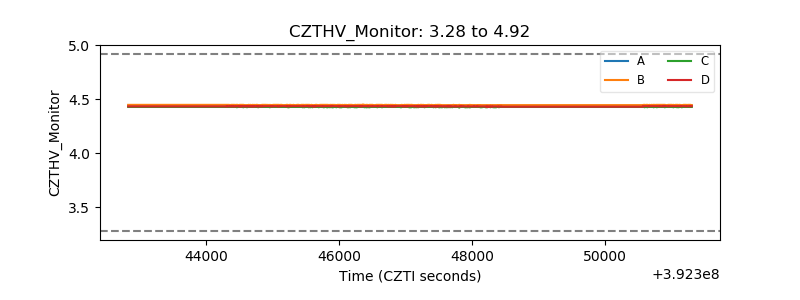 |
| D_VDD | 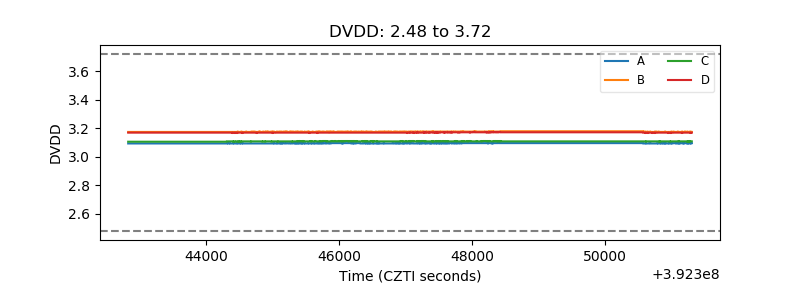 |
| Temperature 1 | 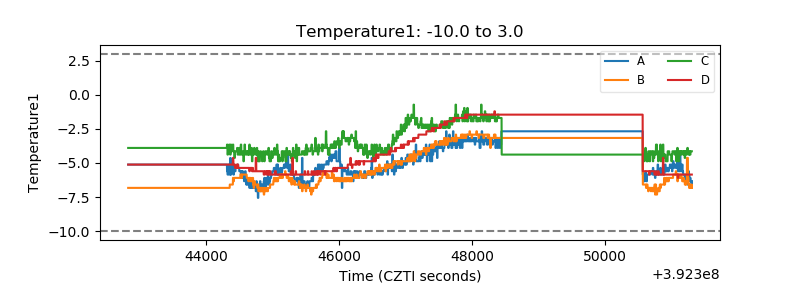 |
| Veto HV Monitor |  |
| Veto LLD | 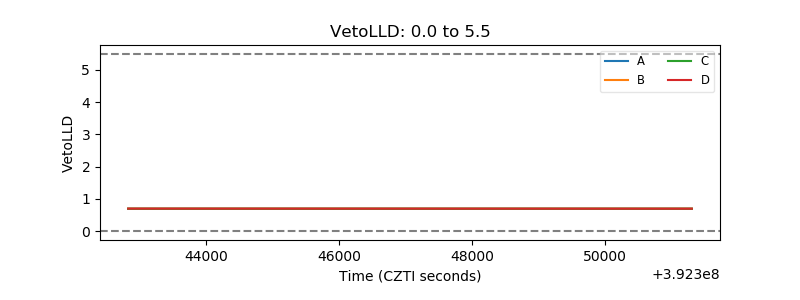 |
| Alpha Counter | 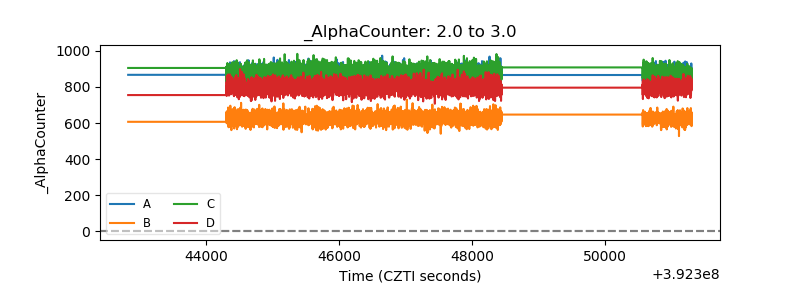 |
| _CPM_Rate | 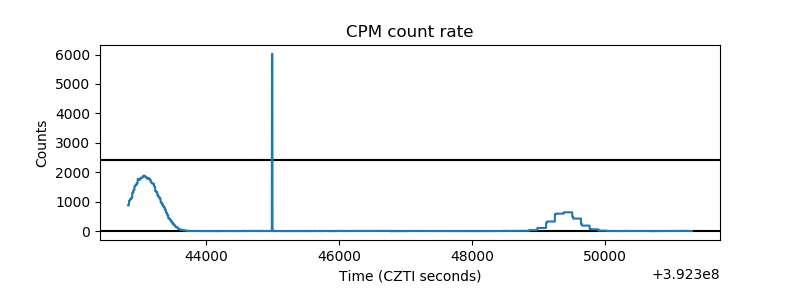 |
| CZT Counter | 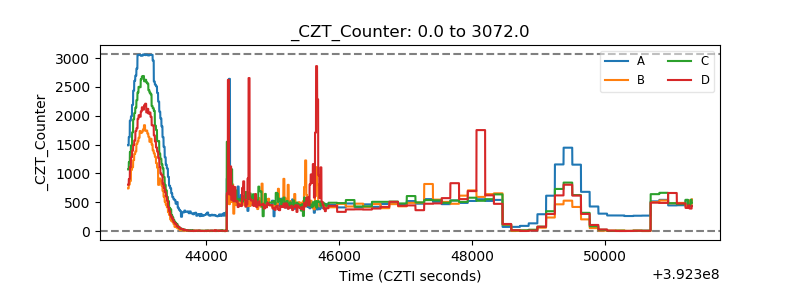 |
| +2.5 Volts monitor |  |
| +5 Volts monitor |  |
| _ROLL_ROT | 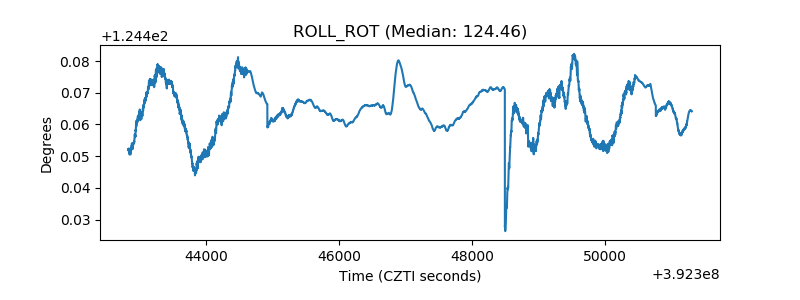 |
| _Roll_DEC | 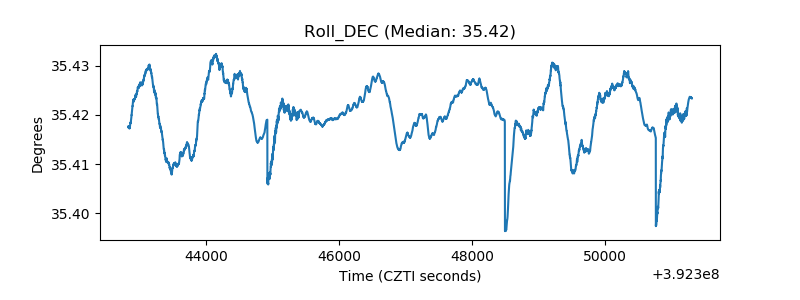 |
| _Roll_RA |  |
| Veto Counter | 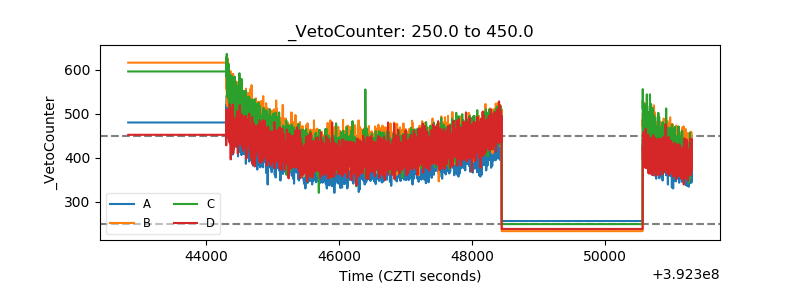 |