| Param | Original file | Final file |
|---|---|---|
| Filename | modeM0/AS1T05_009T02_9000005172cztM0_level2.fits | modeM0/AS1T05_009T02_9000005172cztM0_level2_quad_clean.evt |
| Size (bytes) | 51,756,480 | 43,873,920 |
| Size | 49.4 MB | 41.8 MB |
| Events in quadrant A | 318,744 | 252,841 |
| Events in quadrant B | 308,150 | 256,814 |
| Events in quadrant C | 314,534 | 243,810 |
| Events in quadrant D | 262,076 | 210,244 |
| Mode M0 | |||
|---|---|---|---|
| Quadrant | BADHDUFLAG | Total packets | Discarded packets |
| A | 0 | 11650 | 0 |
| B | 0 | 11611 | 0 |
| C | 0 | 12873 | 0 |
| D | 0 | 15227 | 0 |
| Mode SS | |||
|---|---|---|---|
| Quadrant | BADHDUFLAG | Total packets | Discarded packets |
| A | 0 | 106 | 0 |
| B | 0 | 106 | 0 |
| C | 0 | 106 | 0 |
| D | 0 | 106 | 0 |
| Mode M9 | |||
|---|---|---|---|
| Quadrant | BADHDUFLAG | Total packets | Discarded packets |
| A | 0 | 20 | 0 |
| B | 0 | 20 | 0 |
| C | 0 | 20 | 0 |
| D | 0 | 20 | 0 |
| Quadrant | Total seconds | Saturated seconds | Saturation percentage |
|---|---|---|---|
| A | 5195 | 20 | 0.384986% |
| B | 5195 | 55 | 1.058710% |
| C | 5195 | 145 | 2.791145% |
| D | 5195 | 383 | 7.372474% |
Noise dominated data is calculated using 1-second bins in cleaned event files. If a bin has >2000 counts, and if more than 50% of those come from <1% of pixels, then it is considered to be noise-dominated and hence unusable.
| Quadrant | # 1 sec bins | Bins with >0 counts | Bins with >2000 counts | High rate bins dominated by noise | Noise dominated (total time) | Noise dominated (detector-on time) | Marked lightcurve |
|---|---|---|---|---|---|---|---|
| A | 7228 | 5195 | 0 | 0 | 0.00% | 0.00% |  |
| B | 7228 | 5195 | 0 | 0 | 0.00% | 0.00% |  |
| C | 7228 | 5189 | 0 | 0 | 0.00% | 0.00% |  |
| D | 7228 | 5187 | 0 | 0 | 0.00% | 0.00% |  |
Top three noisy pixels from each quadrant. If the there are fewer than three noisy pixels in the level2.evt file, extra rows are filled as -1
| Pixel properties | Quadrant properties | ||||||
|---|---|---|---|---|---|---|---|
| Quadrant | DetID | PixID | Counts | Sigma | Mean | Median | Sigma |
| A | 9 | 19 | 269 | 8.51 | 83 | 79 | 22.3 |
| A | 14 | 95 | 261 | 8.15 | 83 | 79 | 22.3 |
| A | 7 | 110 | 245 | 7.43 | 83 | 79 | 22.3 |
| B | 3 | 80 | 258 | 9.92 | 81 | 78 | 18.1 |
| B | 2 | 9 | 248 | 9.37 | 81 | 78 | 18.1 |
| B | 2 | 8 | 221 | 7.88 | 81 | 78 | 18.1 |
| C | 12 | 242 | 229 | 6.48 | 83 | 79 | 23.2 |
| C | 3 | 187 | 223 | 6.22 | 83 | 79 | 23.2 |
| C | 3 | 202 | 214 | 5.83 | 83 | 79 | 23.2 |
| D | 6 | 83 | 205 | 6.23 | 75 | 68 | 22.0 |
| D | 10 | 189 | 202 | 6.09 | 75 | 68 | 22.0 |
| D | 10 | 63 | 194 | 5.73 | 75 | 68 | 22.0 |
Histogram calculated using DETX and DETY for each event in the final _common_clean file
| Quadrant A |  |
 |
Quadrant B |
|---|---|---|---|
| Quadrant D |  |
 |
Quadrant C |
| Plot type | Count rate plots | Images |
|---|---|---|
| Comparison with Poisson distribution Blue bars denote a histogram of data divided into 1 sec bins. Red curve is a Poisson curve with rate = median count rate of data. |
 |
 |
| Quadrant-wise count rates Data is divided into 100 sec bins |
 |
|
| Module-wise count rates for Quadrant A Data is divided into 100 sec bins |
 |
 |
| Module-wise count rates for Quadrant B Data is divided into 100 sec bins |
 |
 |
| Module-wise count rates for Quadrant C Data is divided into 100 sec bins |
 |
 |
| Module-wise count rates for Quadrant D Data is divided into 100 sec bins |
 |
 |
| Parameter | Plot |
|---|---|
| CZT HV Monitor |  |
| D_VDD |  |
| Temperature 1 |  |
| Veto HV Monitor |  |
| Veto LLD |  |
| Alpha Counter |  |
| _CPM_Rate |  |
| CZT Counter |  |
| +2.5 Volts monitor |  |
| +5 Volts monitor |  |
| _ROLL_ROT | 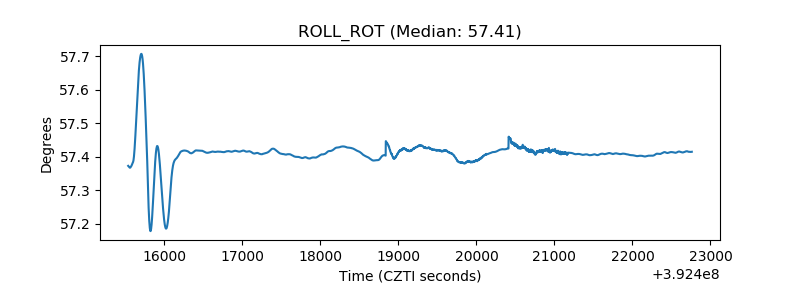 |
| _Roll_DEC |  |
| _Roll_RA |  |
| Veto Counter |  |