| Param | Original file | Final file |
|---|---|---|
| Filename | modeM0/AS1T05_009T04_9000005174cztM0_level2.fits | modeM0/AS1T05_009T04_9000005174cztM0_level2_quad_clean.evt |
| Size (bytes) | 34,830,720 | 34,387,200 |
| Size | 33.2 MB | 32.8 MB |
| Events in quadrant A | 211,770 | 201,759 |
| Events in quadrant B | 208,066 | 206,478 |
| Events in quadrant C | 209,748 | 202,702 |
| Events in quadrant D | 177,658 | 181,951 |
| Mode SS | |||
|---|---|---|---|
| Quadrant | BADHDUFLAG | Total packets | Discarded packets |
| A | 0 | 72 | 0 |
| B | 0 | 72 | 0 |
| C | 0 | 72 | 0 |
| D | 0 | 72 | 0 |
| Mode M9 | |||
|---|---|---|---|
| Quadrant | BADHDUFLAG | Total packets | Discarded packets |
| A | 0 | 21 | 0 |
| B | 0 | 21 | 0 |
| C | 0 | 21 | 0 |
| D | 0 | 21 | 0 |
| Mode M0 | |||
|---|---|---|---|
| Quadrant | BADHDUFLAG | Total packets | Discarded packets |
| A | 0 | 7374 | 0 |
| B | 0 | 8091 | 0 |
| C | 0 | 8291 | 0 |
| D | 0 | 9793 | 0 |
| Quadrant | Total seconds | Saturated seconds | Saturation percentage |
|---|---|---|---|
| A | 3496 | 8 | 0.228833% |
| B | 3496 | 55 | 1.573227% |
| C | 3496 | 30 | 0.858124% |
| D | 3496 | 156 | 4.462243% |
Noise dominated data is calculated using 1-second bins in cleaned event files. If a bin has >2000 counts, and if more than 50% of those come from <1% of pixels, then it is considered to be noise-dominated and hence unusable.
| Quadrant | # 1 sec bins | Bins with >0 counts | Bins with >2000 counts | High rate bins dominated by noise | Noise dominated (total time) | Noise dominated (detector-on time) | Marked lightcurve |
|---|---|---|---|---|---|---|---|
| A | 5589 | 3496 | 0 | 0 | 0.00% | 0.00% | 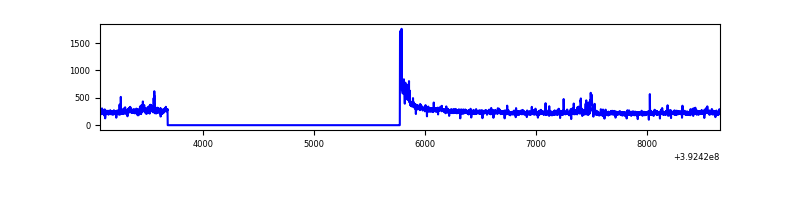 |
| B | 5589 | 3496 | 0 | 0 | 0.00% | 0.00% | 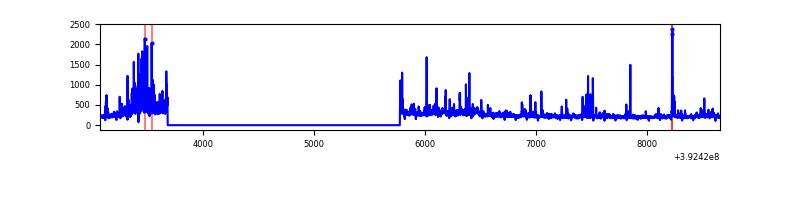 |
| C | 5589 | 3496 | 0 | 0 | 0.00% | 0.00% | 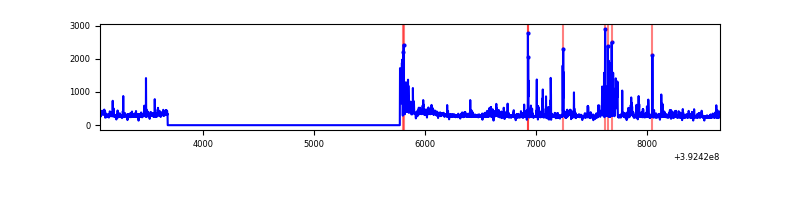 |
| D | 5589 | 3495 | 0 | 0 | 0.00% | 0.00% | 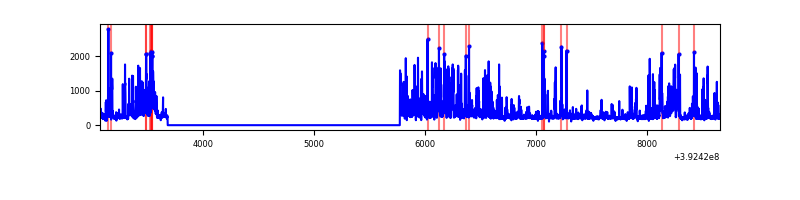 |
Top three noisy pixels from each quadrant. If the there are fewer than three noisy pixels in the level2.evt file, extra rows are filled as -1
| Pixel properties | Quadrant properties | ||||||
|---|---|---|---|---|---|---|---|
| Quadrant | DetID | PixID | Counts | Sigma | Mean | Median | Sigma |
| A | 7 | 110 | 175 | 8.14 | 55 | 52 | 15.1 |
| A | 0 | 29 | 160 | 7.15 | 55 | 52 | 15.1 |
| A | 9 | 19 | 158 | 7.02 | 55 | 52 | 15.1 |
| B | 2 | 9 | 176 | 9.57 | 55 | 52 | 13.0 |
| B | 3 | 80 | 155 | 7.95 | 55 | 52 | 13.0 |
| B | 5 | 128 | 150 | 7.56 | 55 | 52 | 13.0 |
| C | 3 | 202 | 181 | 7.91 | 55 | 53 | 16.2 |
| C | 3 | 203 | 176 | 7.6 | 55 | 53 | 16.2 |
| C | 9 | 233 | 158 | 6.49 | 55 | 53 | 16.2 |
| D | 6 | 83 | 144 | 6.56 | 50 | 46 | 14.9 |
| D | 6 | 231 | 143 | 6.49 | 50 | 46 | 14.9 |
| D | 10 | 189 | 138 | 6.16 | 50 | 46 | 14.9 |
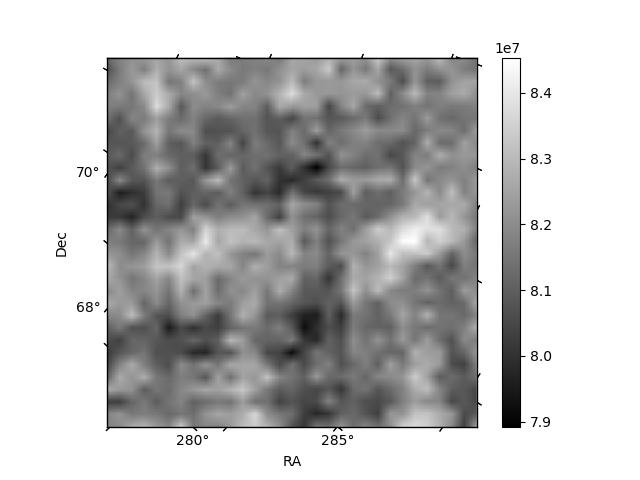
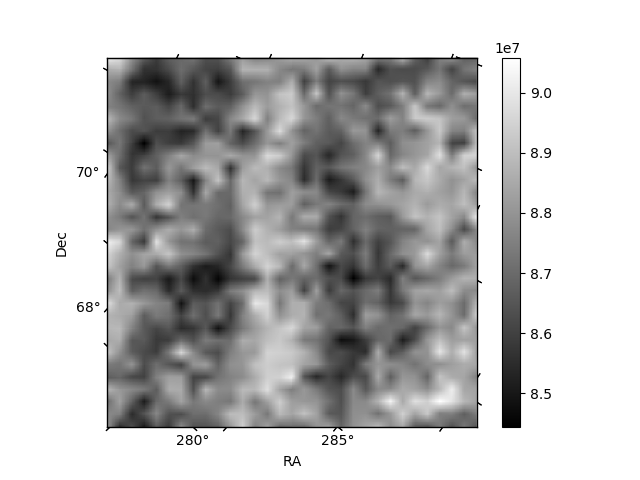
Histogram calculated using DETX and DETY for each event in the final _common_clean file
| Quadrant A | 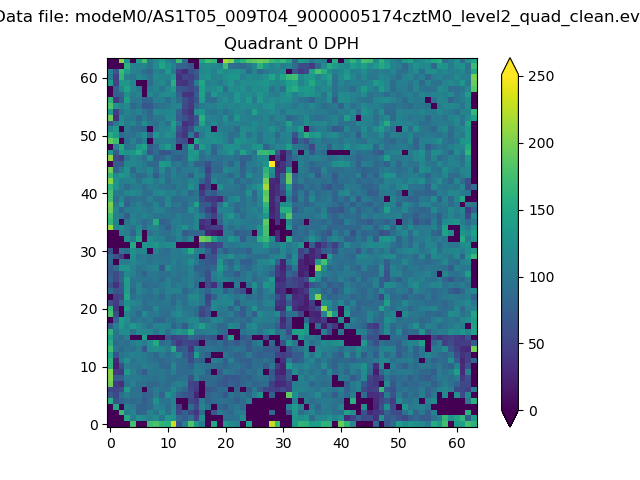 |
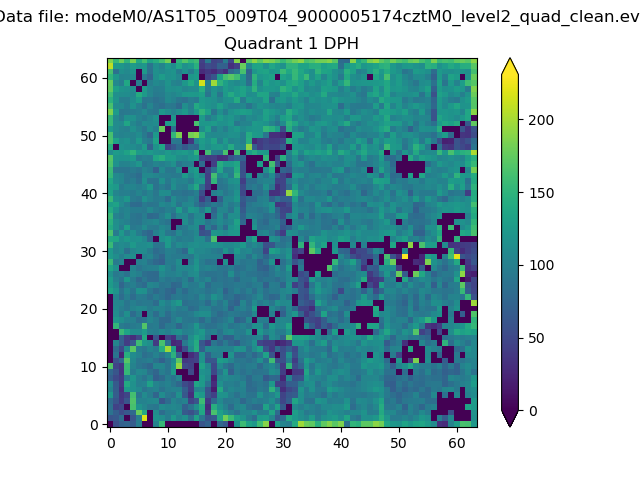 |
Quadrant B |
|---|---|---|---|
| Quadrant D |  |
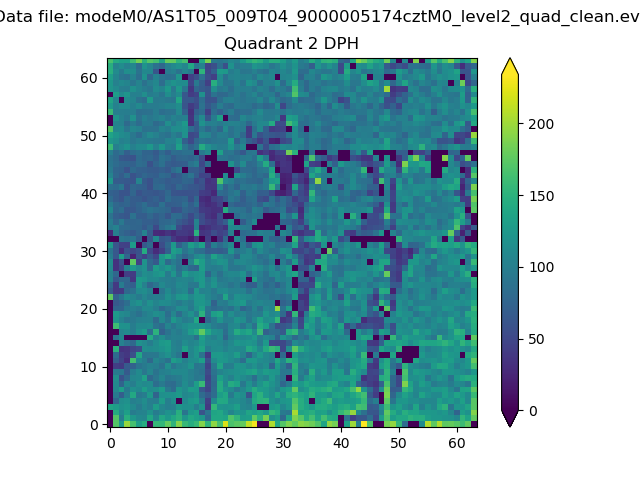 |
Quadrant C |
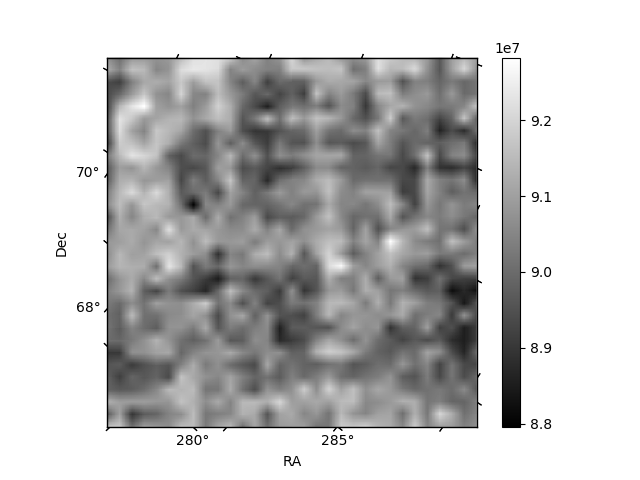
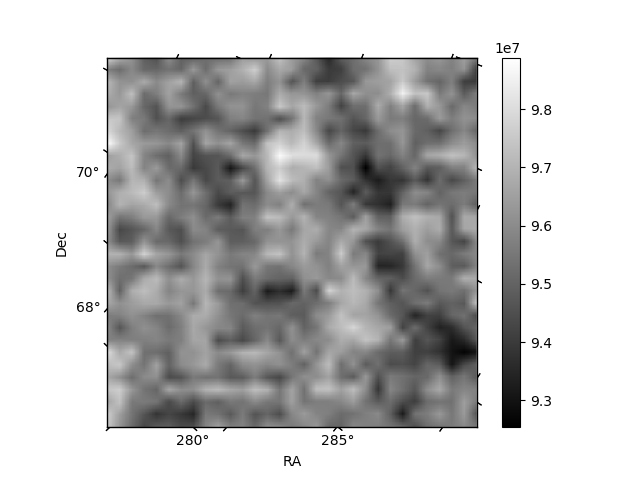
| Plot type | Count rate plots | Images |
|---|---|---|
| Comparison with Poisson distribution Blue bars denote a histogram of data divided into 1 sec bins. Red curve is a Poisson curve with rate = median count rate of data. |
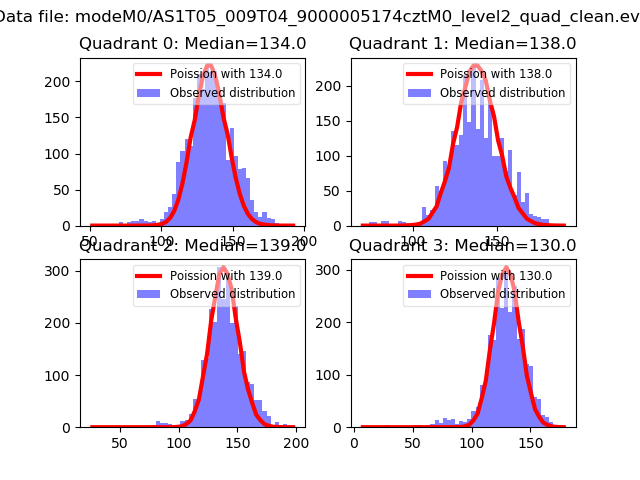 |
 |
| Quadrant-wise count rates Data is divided into 100 sec bins |
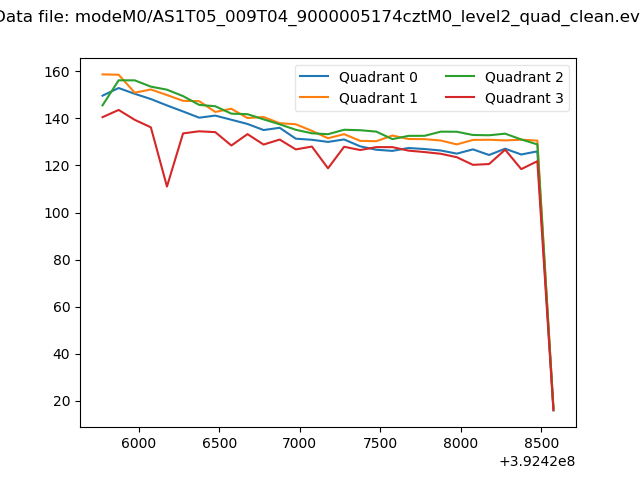 |
|
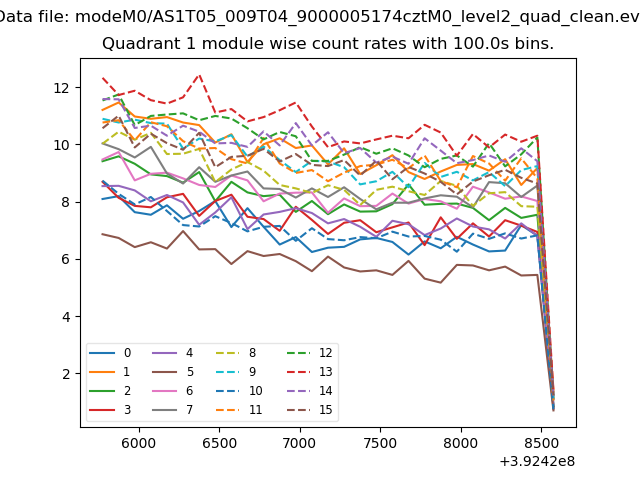
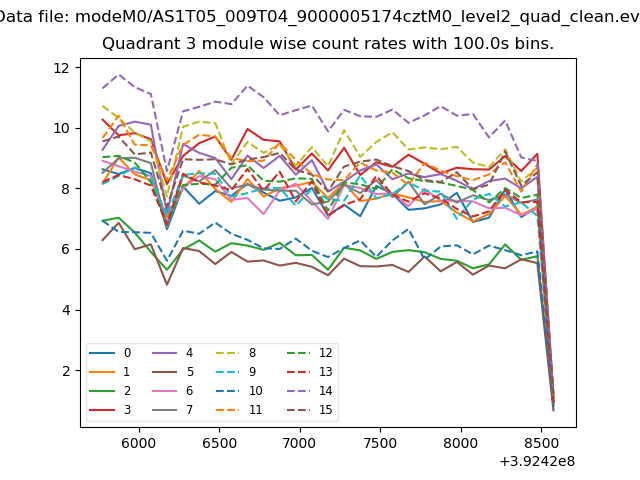
| Module-wise count rates for Quadrant A Data is divided into 100 sec bins |
 |
 |
| Module-wise count rates for Quadrant B Data is divided into 100 sec bins |
 |
 |
| Module-wise count rates for Quadrant C Data is divided into 100 sec bins |
 |
 |
| Module-wise count rates for Quadrant D Data is divided into 100 sec bins |
 |
 |
| Parameter | Plot |
|---|---|
| CZT HV Monitor | 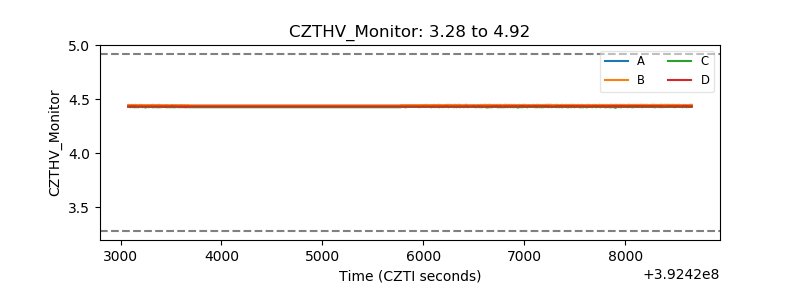 |
| D_VDD | 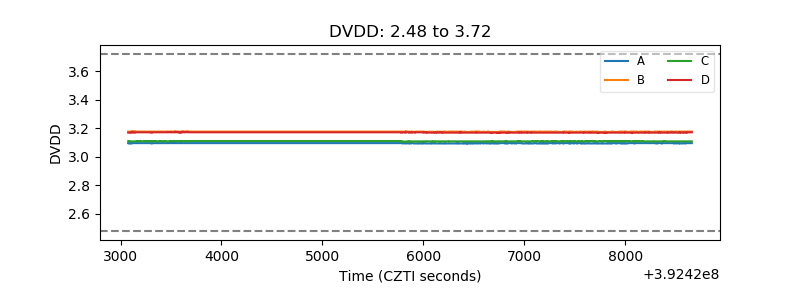 |
| Temperature 1 | 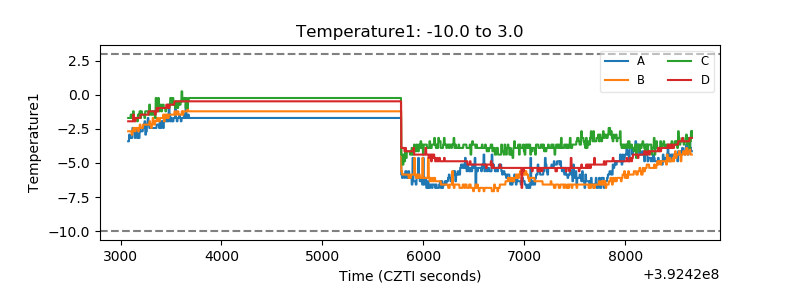 |
| Veto HV Monitor | 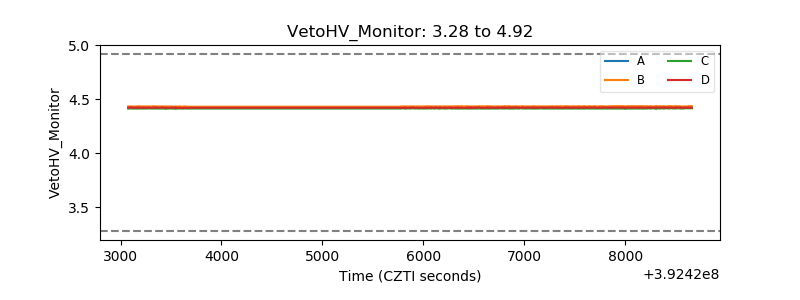 |
| Veto LLD | 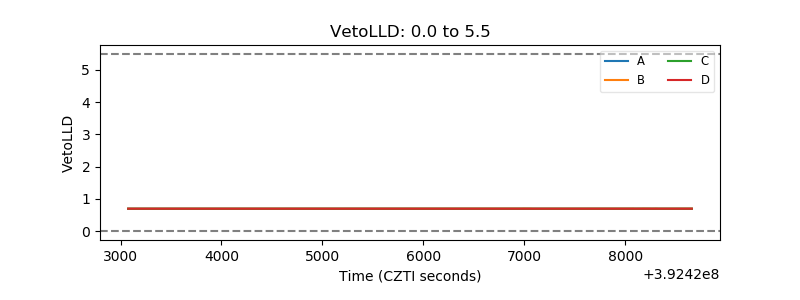 |
| Alpha Counter | 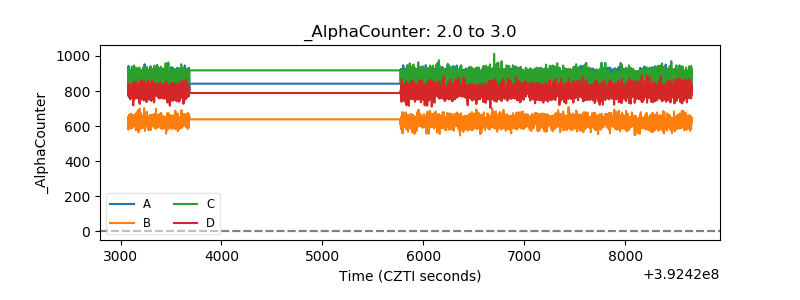 |
| _CPM_Rate |  |
| CZT Counter | 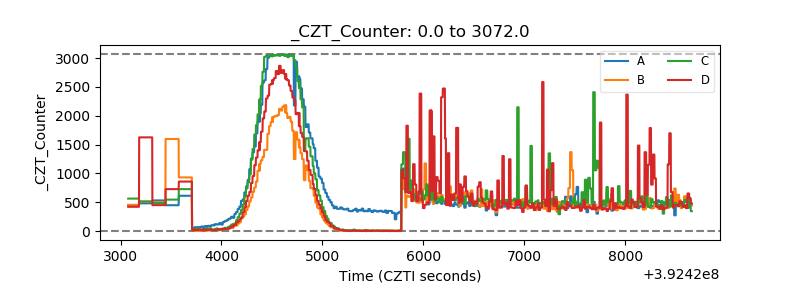 |
| +2.5 Volts monitor | 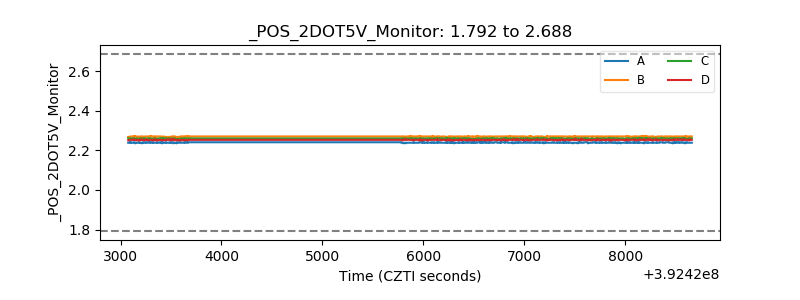 |
| +5 Volts monitor | 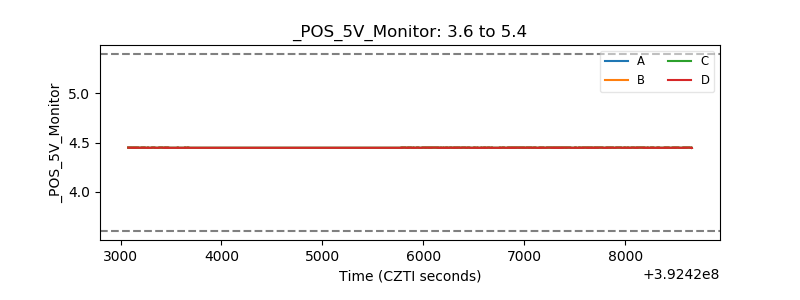 |
| _ROLL_ROT |  |
| _Roll_DEC | 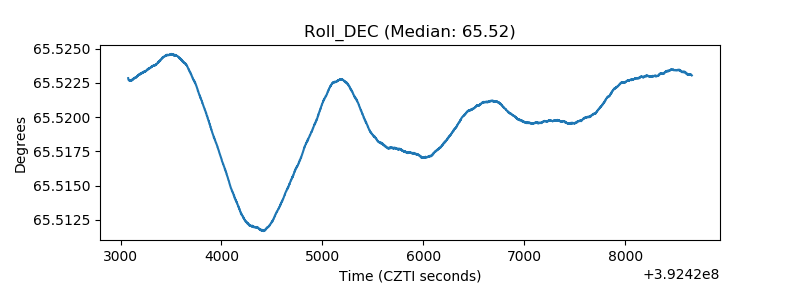 |
| _Roll_RA | 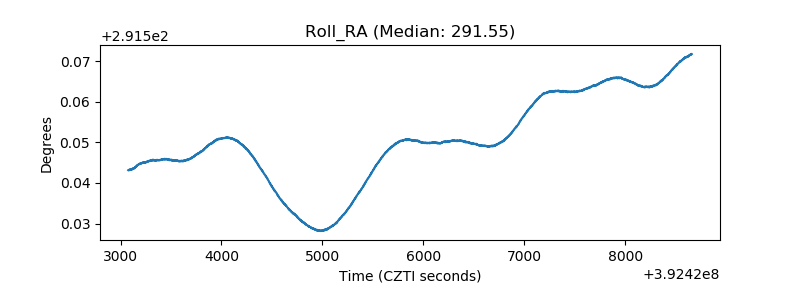 |
| Veto Counter | 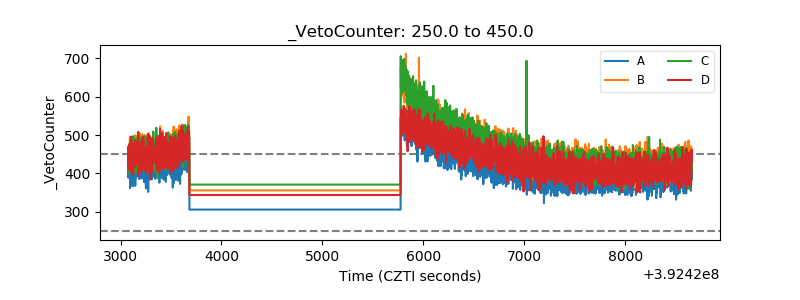 |