| Param | Original file | Final file |
|---|---|---|
| Filename | modeM0/AS1A11_080T02_9000005176cztM0_level2.fits | modeM0/AS1A11_080T02_9000005176cztM0_level2_quad_clean.evt |
| Size (bytes) | 1,224,100,800 | 1,071,892,800 |
| Size | 1.1 GB | 1022.2 MB |
| Events in quadrant A | 7,672,916 | 6,642,037 |
| Events in quadrant B | 7,206,198 | 6,358,023 |
| Events in quadrant C | 7,091,110 | 5,504,796 |
| Events in quadrant D | 5,795,624 | 4,668,714 |
| Mode M9 | |||
|---|---|---|---|
| Quadrant | BADHDUFLAG | Total packets | Discarded packets |
| A | 0 | 524 | 0 |
| B | 0 | 524 | 0 |
| C | 0 | 524 | 0 |
| D | 0 | 524 | 0 |
| Mode M0 | |||
|---|---|---|---|
| Quadrant | BADHDUFLAG | Total packets | Discarded packets |
| A | 0 | 297570 | 0 |
| B | 0 | 366248 | 0 |
| C | 0 | 404959 | 0 |
| D | 0 | 558823 | 0 |
| Mode SS | |||
|---|---|---|---|
| Quadrant | BADHDUFLAG | Total packets | Discarded packets |
| A | 0 | 2772 | 0 |
| B | 0 | 2772 | 0 |
| C | 0 | 2772 | 0 |
| D | 0 | 2772 | 0 |
| Quadrant | Total seconds | Saturated seconds | Saturation percentage |
|---|---|---|---|
| A | 135503 | 464 | 0.342428% |
| B | 135503 | 7057 | 5.208003% |
| C | 135503 | 14498 | 10.699394% |
| D | 135503 | 26642 | 19.661557% |
Noise dominated data is calculated using 1-second bins in cleaned event files. If a bin has >2000 counts, and if more than 50% of those come from <1% of pixels, then it is considered to be noise-dominated and hence unusable.
| Quadrant | # 1 sec bins | Bins with >0 counts | Bins with >2000 counts | High rate bins dominated by noise | Noise dominated (total time) | Noise dominated (detector-on time) | Marked lightcurve |
|---|---|---|---|---|---|---|---|
| A | 187973 | 135503 | 0 | 0 | 0.00% | 0.00% |  |
| B | 187973 | 135412 | 0 | 0 | 0.00% | 0.00% | 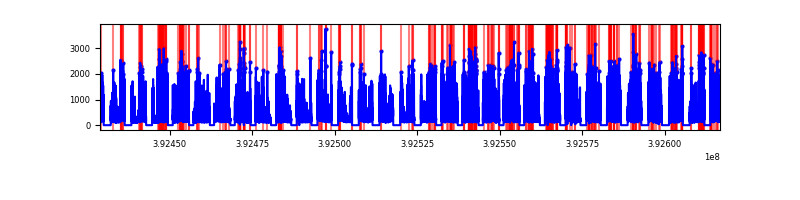 |
| C | 187973 | 135130 | 0 | 0 | 0.00% | 0.00% | 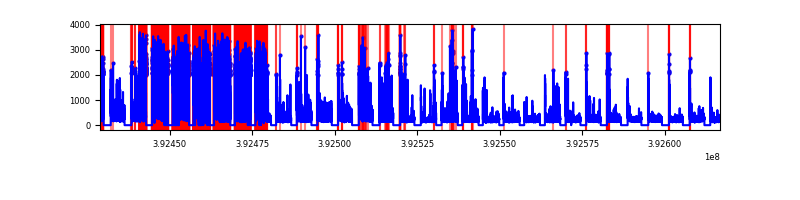 |
| D | 187973 | 135122 | 0 | 0 | 0.00% | 0.00% | 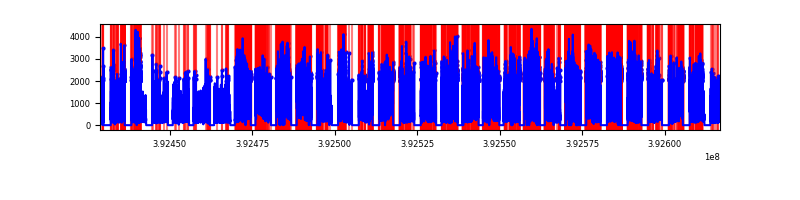 |
Top three noisy pixels from each quadrant. If the there are fewer than three noisy pixels in the level2.evt file, extra rows are filled as -1
| Pixel properties | Quadrant properties | ||||||
|---|---|---|---|---|---|---|---|
| Quadrant | DetID | PixID | Counts | Sigma | Mean | Median | Sigma |
| A | 7 | 110 | 6361 | 9.15 | 2005 | 1885 | 489.0 |
| A | 9 | 19 | 6264 | 8.95 | 2005 | 1885 | 489.0 |
| A | 0 | 29 | 6053 | 8.52 | 2005 | 1885 | 489.0 |
| B | 2 | 9 | 6280 | 12.16 | 1913 | 1827 | 366.2 |
| B | 3 | 80 | 5590 | 10.28 | 1913 | 1827 | 366.2 |
| B | 2 | 8 | 5068 | 8.85 | 1913 | 1827 | 366.2 |
| C | 1 | 81 | 5956 | 8.73 | 1876 | 1755 | 481.3 |
| C | 1 | 80 | 5945 | 8.71 | 1876 | 1755 | 481.3 |
| C | 3 | 203 | 5552 | 7.89 | 1876 | 1755 | 481.3 |
| D | 7 | 3 | 4334 | 6.4 | 1661 | 1514 | 440.7 |
| D | 4 | 160 | 4275 | 6.26 | 1661 | 1514 | 440.7 |
| D | 10 | 113 | 4181 | 6.05 | 1661 | 1514 | 440.7 |
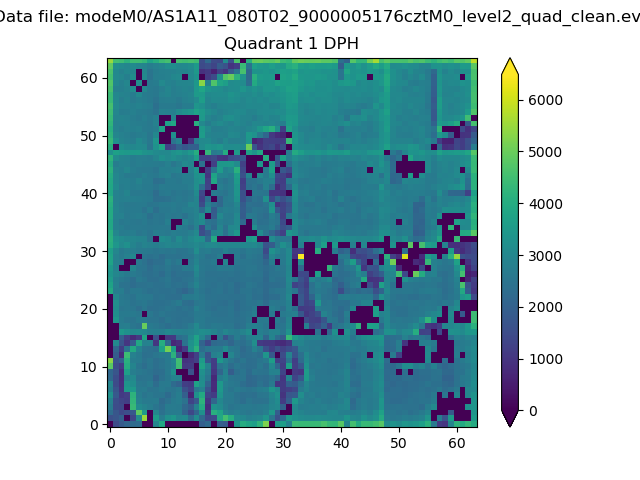
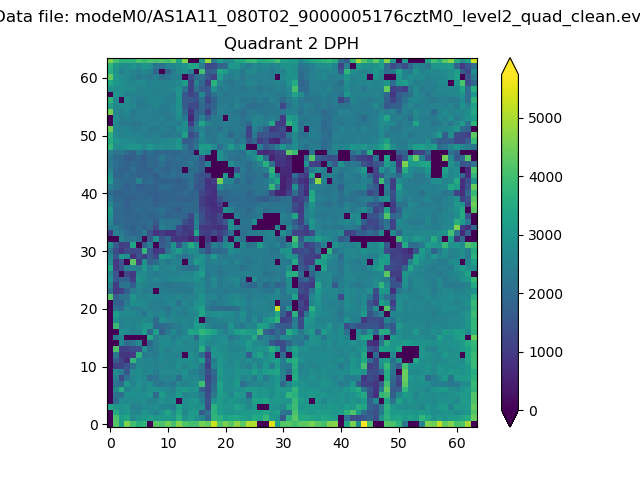
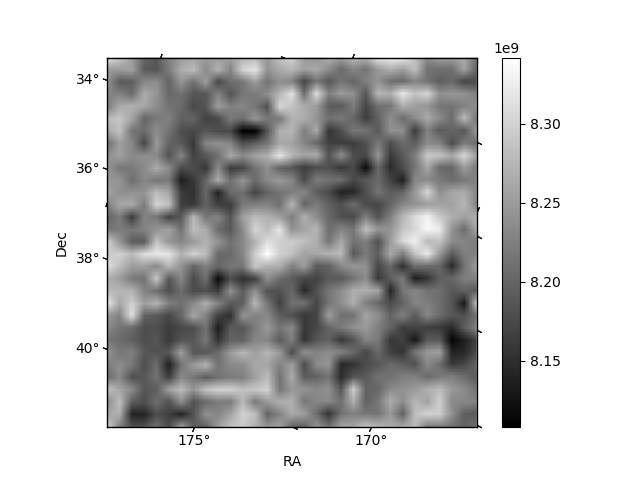
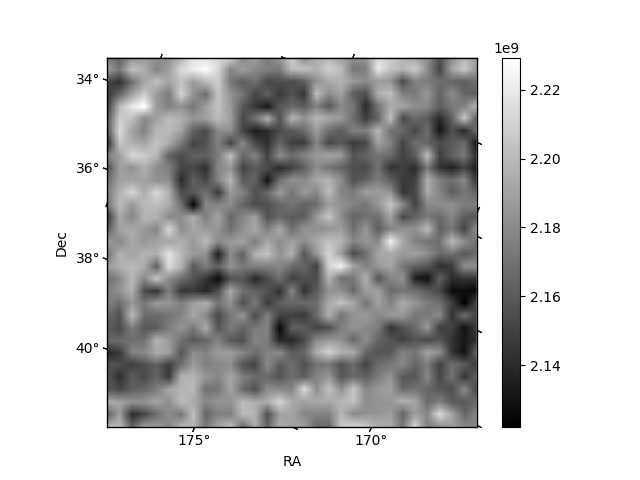
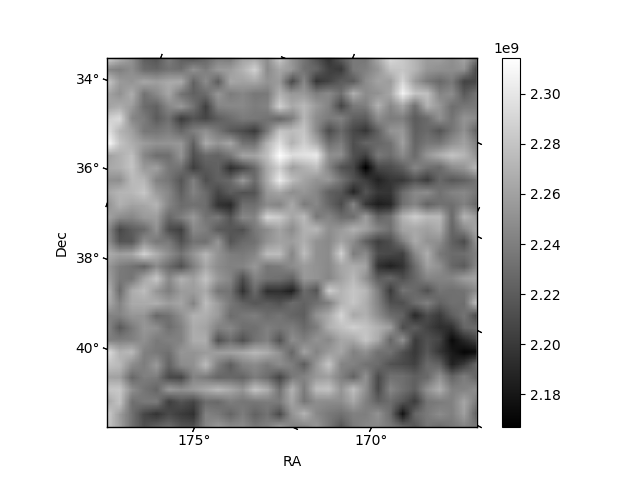
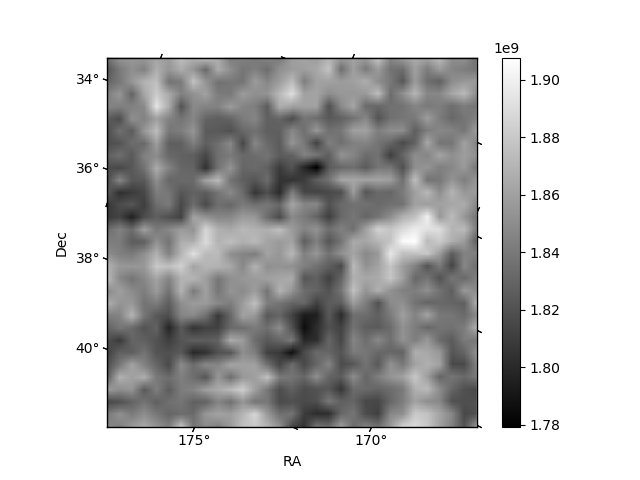
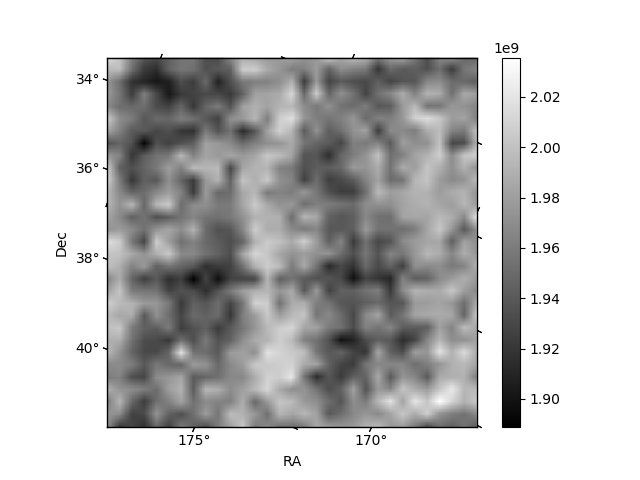
Histogram calculated using DETX and DETY for each event in the final _common_clean file
| Quadrant A | 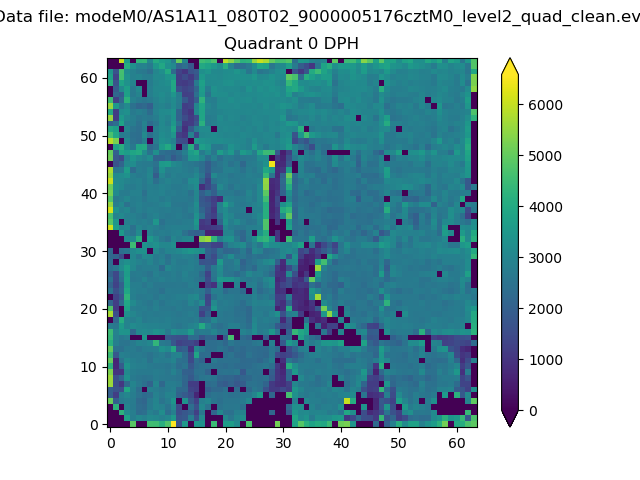 |
 |
Quadrant B |
|---|---|---|---|
| Quadrant D | 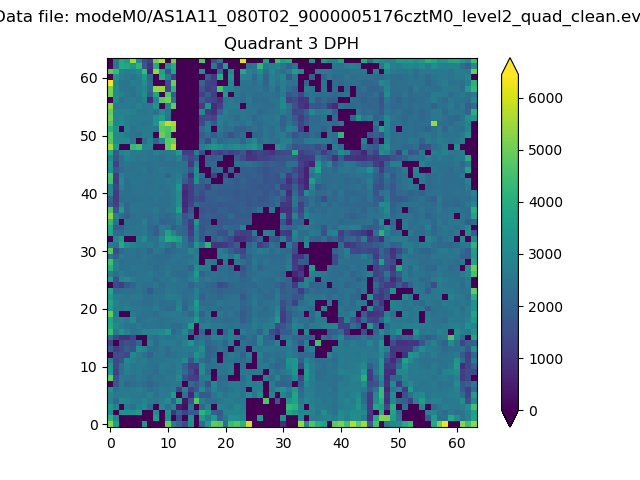 |
 |
Quadrant C |
| Plot type | Count rate plots | Images |
|---|---|---|
| Comparison with Poisson distribution Blue bars denote a histogram of data divided into 1 sec bins. Red curve is a Poisson curve with rate = median count rate of data. |
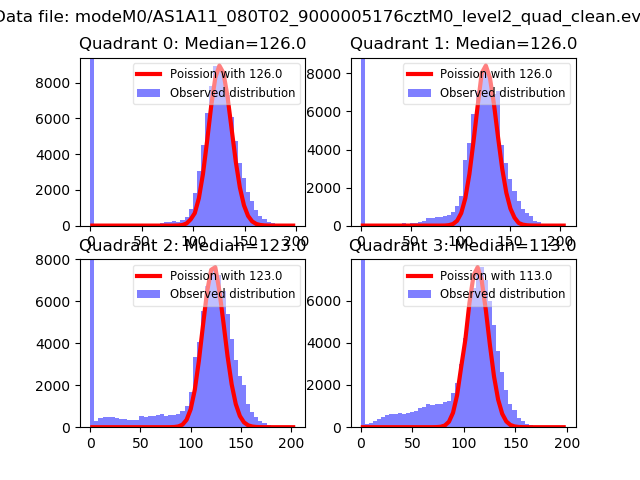 |
 |
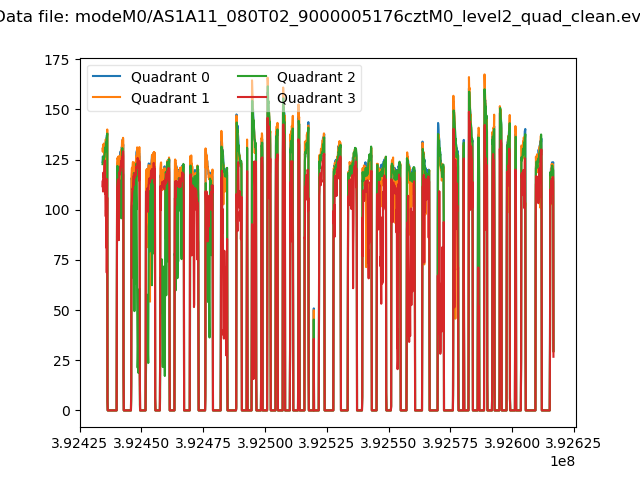
| Quadrant-wise count rates Data is divided into 100 sec bins |
 |
|
| Module-wise count rates for Quadrant A Data is divided into 100 sec bins |
 |
 |
| Module-wise count rates for Quadrant B Data is divided into 100 sec bins |
 |
 |
| Module-wise count rates for Quadrant C Data is divided into 100 sec bins |
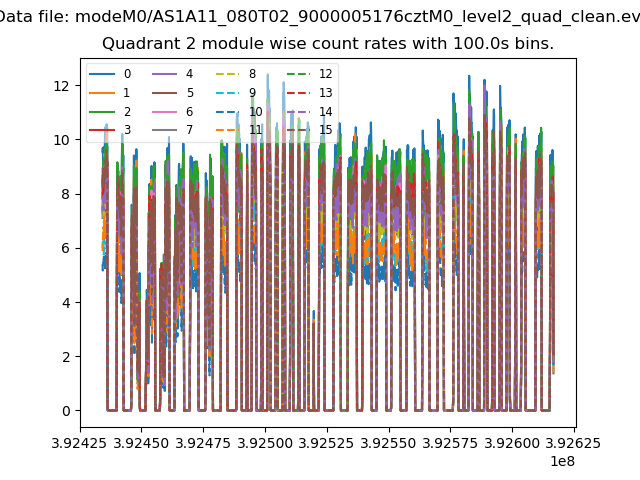 |
 |
| Module-wise count rates for Quadrant D Data is divided into 100 sec bins |
 |
 |
| Parameter | Plot |
|---|---|
| CZT HV Monitor | 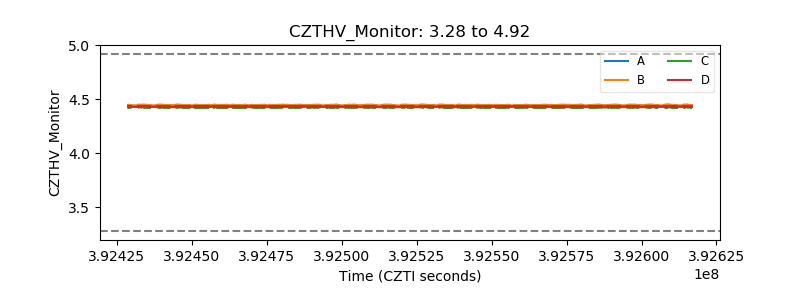 |
| D_VDD | 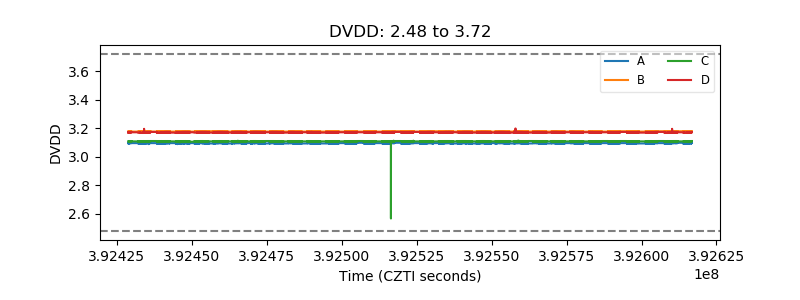 |
| Temperature 1 | 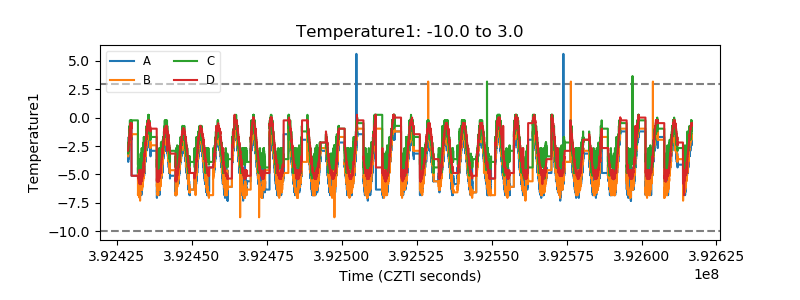 |
| Veto HV Monitor | 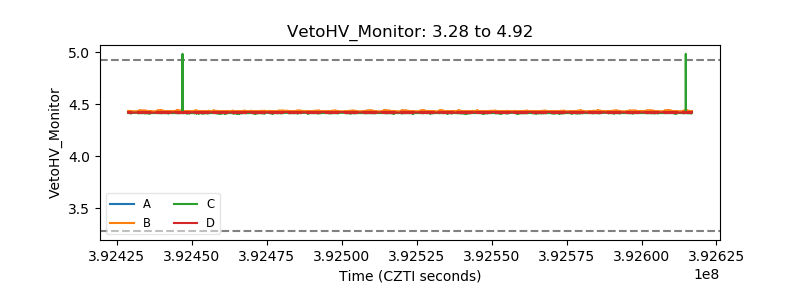 |
| Veto LLD | 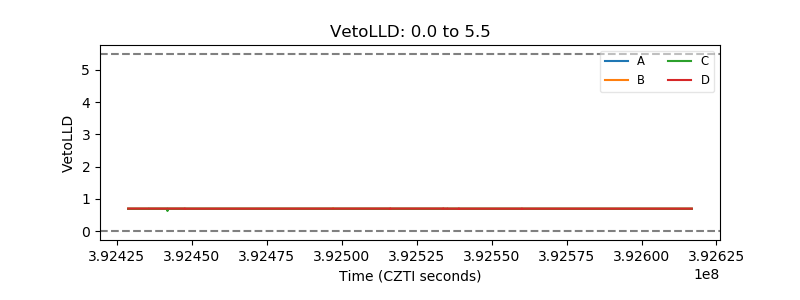 |
| Alpha Counter | 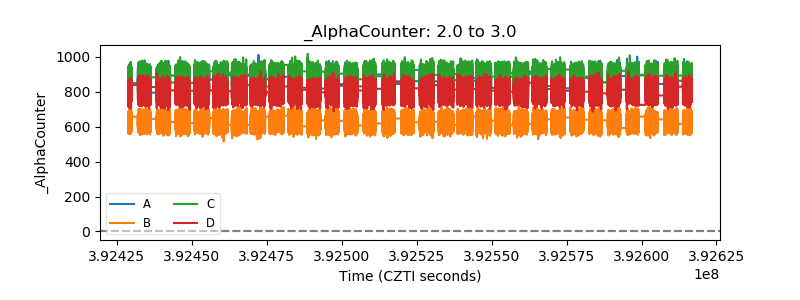 |
| _CPM_Rate | 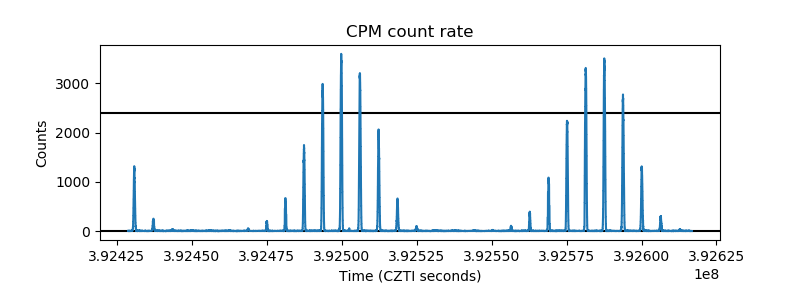 |
| CZT Counter | 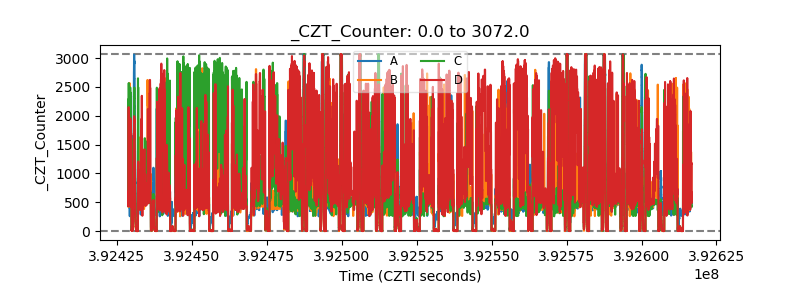 |
| +2.5 Volts monitor |  |
| +5 Volts monitor | 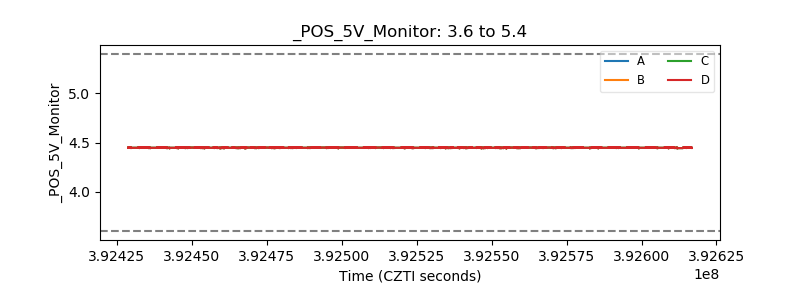 |
| _ROLL_ROT | 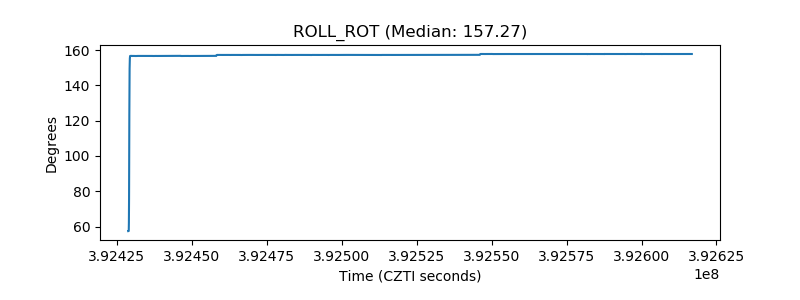 |
| _Roll_DEC | 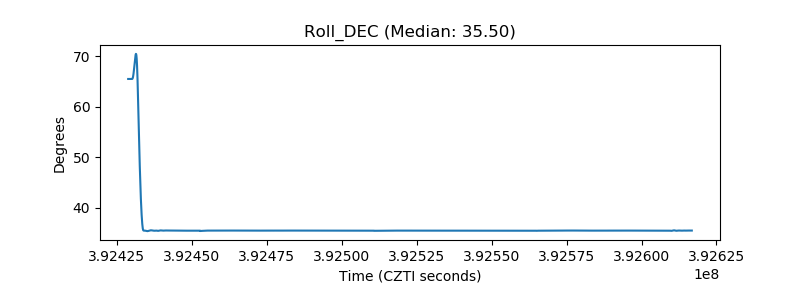 |
| _Roll_RA | 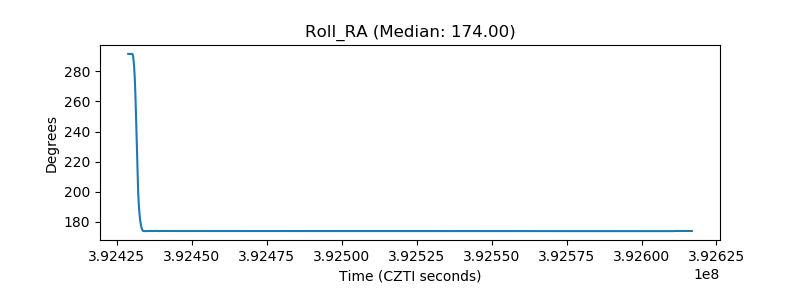 |
| Veto Counter |  |