| Param | Original file | Final file |
|---|---|---|
| Filename | modeM0/AS1A10_071T34_9000005178cztM0_level2.fits | modeM0/AS1A10_071T34_9000005178cztM0_level2_quad_clean.evt |
| Size (bytes) | 371,695,680 | 361,097,280 |
| Size | 354.5 MB | 344.4 MB |
| Events in quadrant A | 2,269,408 | 2,182,124 |
| Events in quadrant B | 2,143,620 | 2,153,607 |
| Events in quadrant C | 2,238,200 | 2,074,888 |
| Events in quadrant D | 1,848,828 | 1,769,340 |
| Mode SS | |||
|---|---|---|---|
| Quadrant | BADHDUFLAG | Total packets | Discarded packets |
| A | 0 | 822 | 0 |
| B | 0 | 822 | 0 |
| C | 0 | 822 | 0 |
| D | 0 | 822 | 0 |
| Mode M9 | |||
|---|---|---|---|
| Quadrant | BADHDUFLAG | Total packets | Discarded packets |
| A | 0 | 139 | 0 |
| B | 0 | 139 | 0 |
| C | 0 | 139 | 0 |
| D | 0 | 139 | 0 |
| Mode M0 | |||
|---|---|---|---|
| Quadrant | BADHDUFLAG | Total packets | Discarded packets |
| A | 0 | 83156 | 0 |
| B | 0 | 97465 | 0 |
| C | 0 | 86096 | 0 |
| D | 0 | 125878 | 0 |
| Quadrant | Total seconds | Saturated seconds | Saturation percentage |
|---|---|---|---|
| A | 40121 | 88 | 0.219337% |
| B | 40121 | 1445 | 3.601605% |
| C | 40121 | 259 | 0.645547% |
| D | 40121 | 3304 | 8.235089% |
Noise dominated data is calculated using 1-second bins in cleaned event files. If a bin has >2000 counts, and if more than 50% of those come from <1% of pixels, then it is considered to be noise-dominated and hence unusable.
| Quadrant | # 1 sec bins | Bins with >0 counts | Bins with >2000 counts | High rate bins dominated by noise | Noise dominated (total time) | Noise dominated (detector-on time) | Marked lightcurve |
|---|---|---|---|---|---|---|---|
| A | 54095 | 40121 | 0 | 0 | 0.00% | 0.00% | 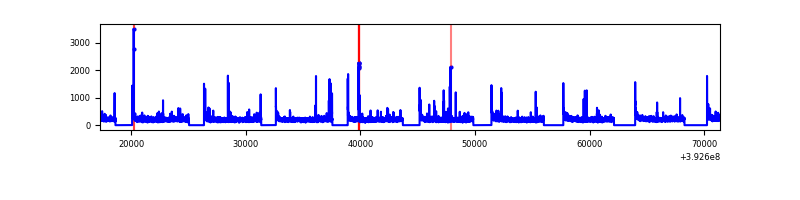 |
| B | 54095 | 40104 | 0 | 0 | 0.00% | 0.00% | 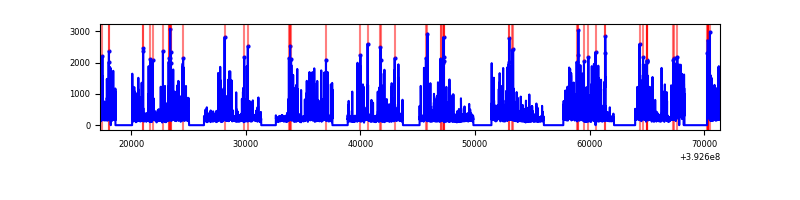 |
| C | 54095 | 40120 | 0 | 0 | 0.00% | 0.00% |  |
| D | 54095 | 40090 | 0 | 0 | 0.00% | 0.00% |  |
Top three noisy pixels from each quadrant. If the there are fewer than three noisy pixels in the level2.evt file, extra rows are filled as -1
| Pixel properties | Quadrant properties | ||||||
|---|---|---|---|---|---|---|---|
| Quadrant | DetID | PixID | Counts | Sigma | Mean | Median | Sigma |
| A | 7 | 110 | 1940 | 9.37 | 593 | 556 | 147.8 |
| A | 0 | 29 | 1816 | 8.53 | 593 | 556 | 147.8 |
| A | 9 | 19 | 1791 | 8.36 | 593 | 556 | 147.8 |
| B | 2 | 9 | 1878 | 11.71 | 568 | 539 | 114.3 |
| B | 3 | 80 | 1640 | 9.63 | 568 | 539 | 114.3 |
| B | 2 | 8 | 1600 | 9.28 | 568 | 539 | 114.3 |
| C | 1 | 81 | 1846 | 8.45 | 591 | 553 | 153.1 |
| C | 1 | 80 | 1841 | 8.41 | 591 | 553 | 153.1 |
| C | 3 | 202 | 1667 | 7.28 | 591 | 553 | 153.1 |
| D | 10 | 113 | 1393 | 6.42 | 530 | 483 | 141.7 |
| D | 10 | 189 | 1364 | 6.22 | 530 | 483 | 141.7 |
| D | 6 | 38 | 1348 | 6.11 | 530 | 483 | 141.7 |
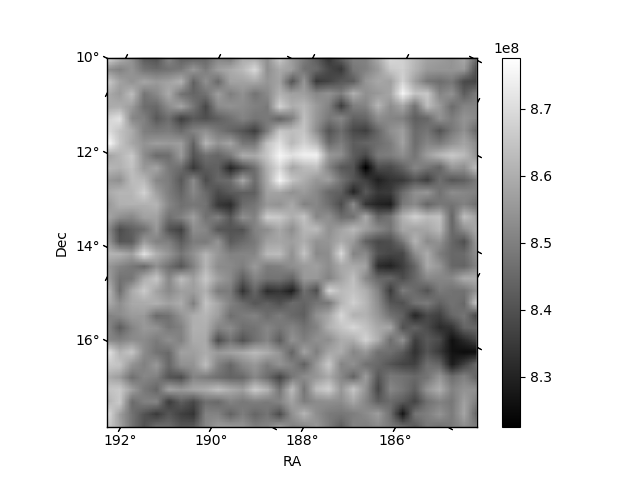
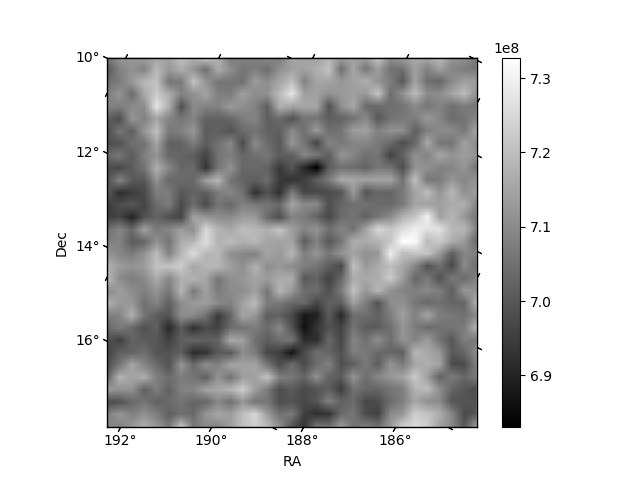
Histogram calculated using DETX and DETY for each event in the final _common_clean file
| Quadrant A | 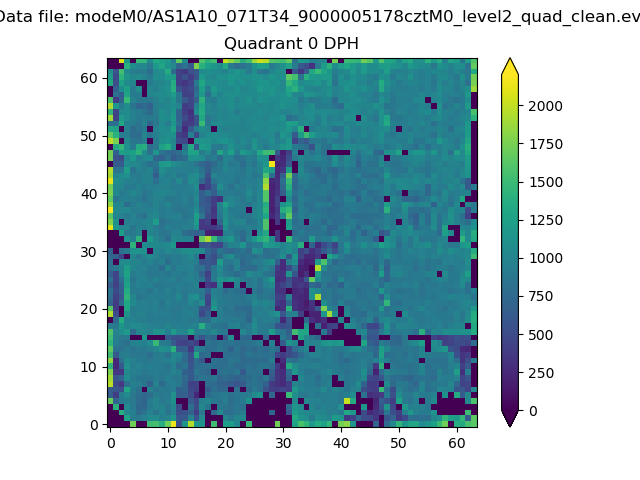 |
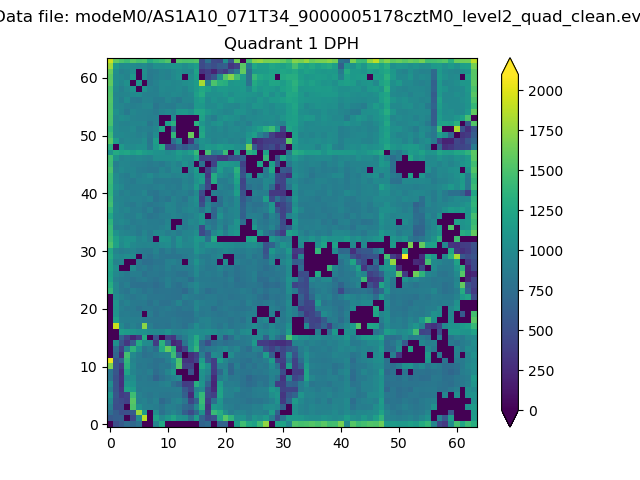 |
Quadrant B |
|---|---|---|---|
| Quadrant D | 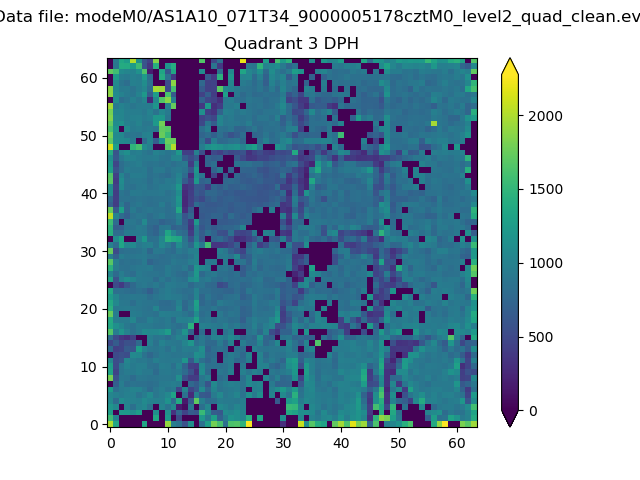 |
 |
Quadrant C |
| Plot type | Count rate plots | Images |
|---|---|---|
| Comparison with Poisson distribution Blue bars denote a histogram of data divided into 1 sec bins. Red curve is a Poisson curve with rate = median count rate of data. |
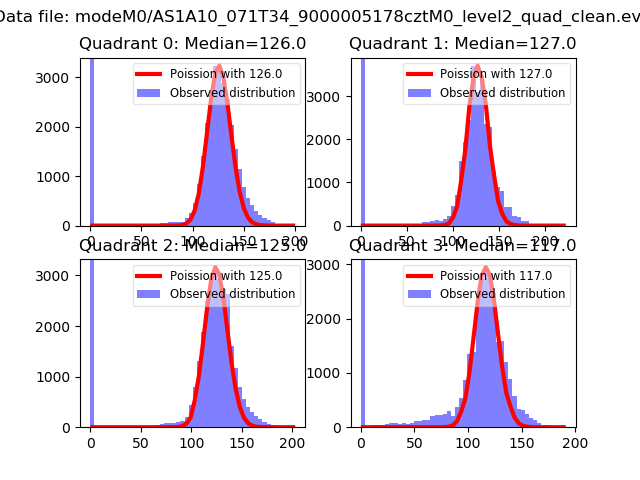 |
 |
| Quadrant-wise count rates Data is divided into 100 sec bins |
 |
|
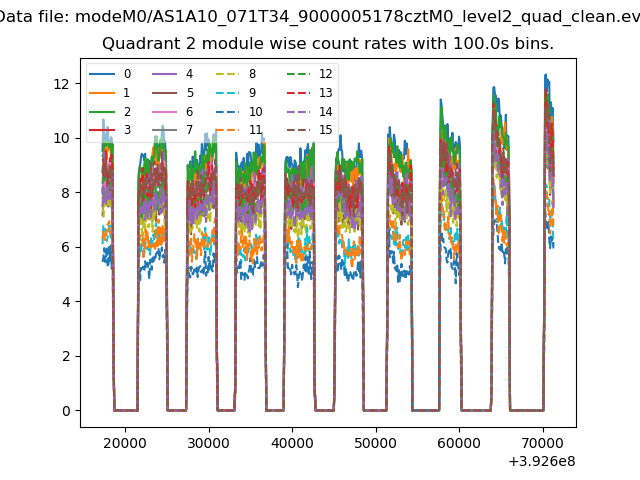
| Module-wise count rates for Quadrant A Data is divided into 100 sec bins |
 |
 |
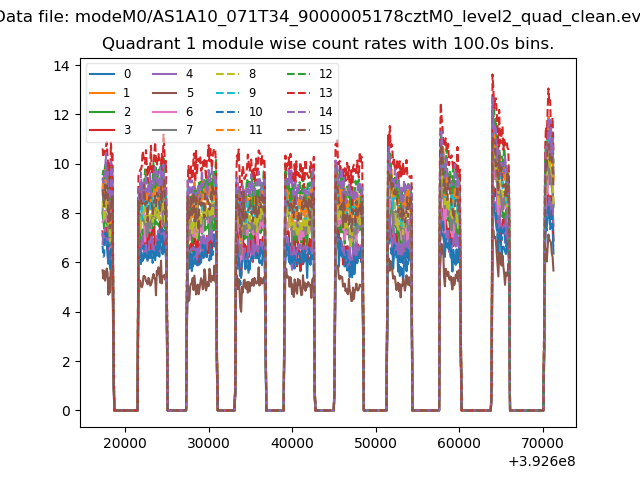
| Module-wise count rates for Quadrant B Data is divided into 100 sec bins |
 |
 |
| Module-wise count rates for Quadrant C Data is divided into 100 sec bins |
 |
 |
| Module-wise count rates for Quadrant D Data is divided into 100 sec bins |
 |
 |
| Parameter | Plot |
|---|---|
| CZT HV Monitor | 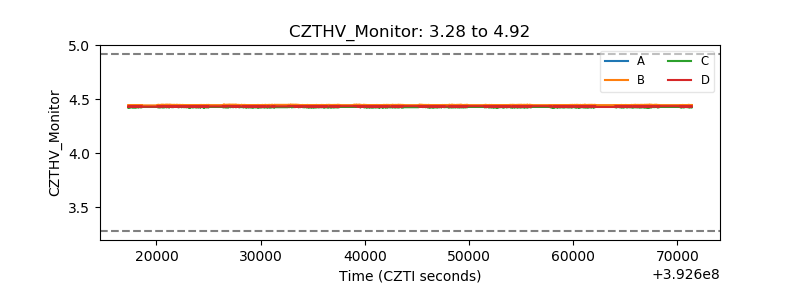 |
| D_VDD | 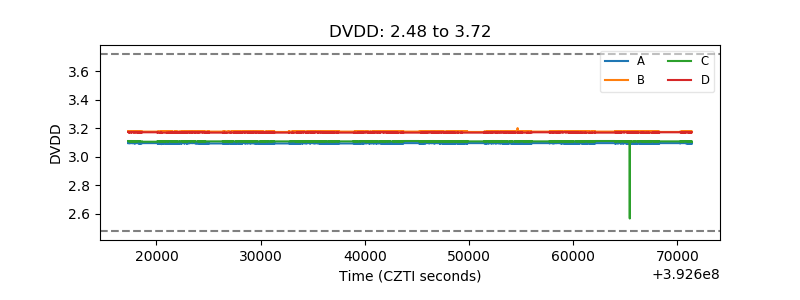 |
| Temperature 1 | 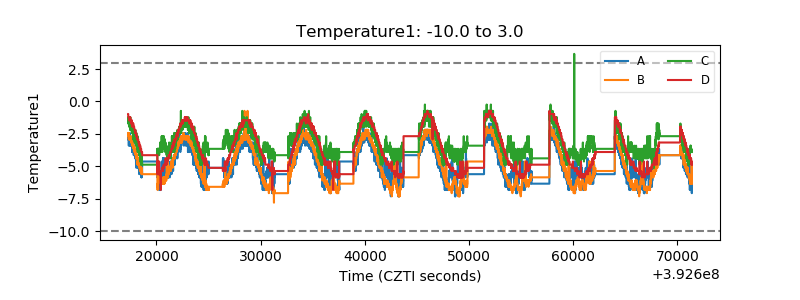 |
| Veto HV Monitor |  |
| Veto LLD |  |
| Alpha Counter | 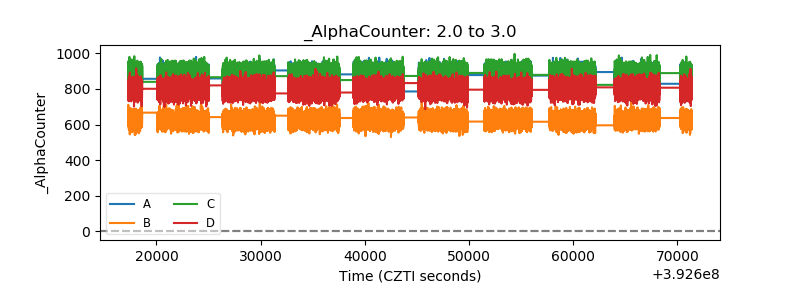 |
| _CPM_Rate |  |
| CZT Counter |  |
| +2.5 Volts monitor |  |
| +5 Volts monitor |  |
| _ROLL_ROT | 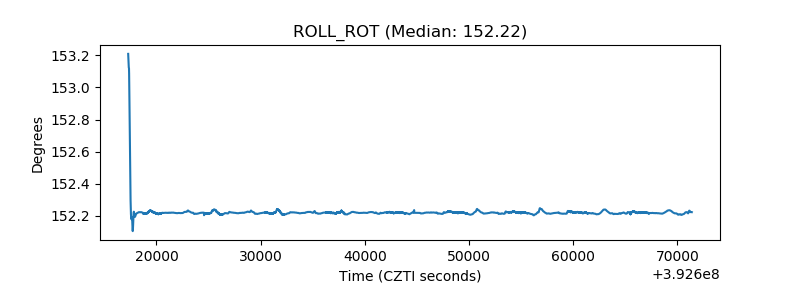 |
| _Roll_DEC | 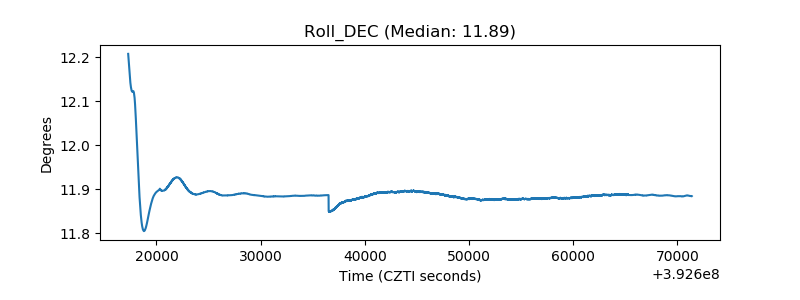 |
| _Roll_RA | 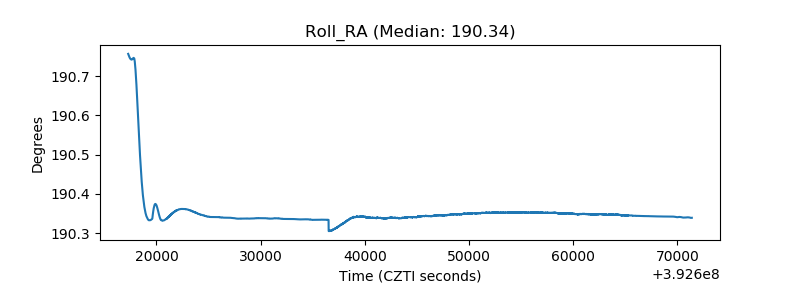 |
| Veto Counter |  |