| Param | Original file | Final file |
|---|---|---|
| Filename | modeM0/AS1A10_071T37_9000005180cztM0_level2.fits | modeM0/AS1A10_071T37_9000005180cztM0_level2_quad_clean.evt |
| Size (bytes) | 517,783,680 | 487,995,840 |
| Size | 493.8 MB | 465.4 MB |
| Events in quadrant A | 3,220,278 | 2,981,653 |
| Events in quadrant B | 2,936,432 | 2,730,406 |
| Events in quadrant C | 3,098,742 | 2,803,480 |
| Events in quadrant D | 2,607,168 | 2,447,111 |
| Mode SS | |||
|---|---|---|---|
| Quadrant | BADHDUFLAG | Total packets | Discarded packets |
| A | 0 | 1138 | 0 |
| B | 0 | 1138 | 0 |
| C | 0 | 1138 | 0 |
| D | 0 | 1138 | 0 |
| Mode M9 | |||
|---|---|---|---|
| Quadrant | BADHDUFLAG | Total packets | Discarded packets |
| A | 0 | 202 | 0 |
| B | 0 | 202 | 0 |
| C | 0 | 202 | 0 |
| D | 0 | 202 | 0 |
| Mode M0 | |||
|---|---|---|---|
| Quadrant | BADHDUFLAG | Total packets | Discarded packets |
| A | 0 | 114659 | 0 |
| B | 0 | 162906 | 0 |
| C | 0 | 126729 | 0 |
| D | 0 | 161261 | 0 |
| Quadrant | Total seconds | Saturated seconds | Saturation percentage |
|---|---|---|---|
| A | 55607 | 99 | 0.178035% |
| B | 55607 | 4676 | 8.409013% |
| C | 55607 | 958 | 1.722805% |
| D | 55607 | 3556 | 6.394878% |
Noise dominated data is calculated using 1-second bins in cleaned event files. If a bin has >2000 counts, and if more than 50% of those come from <1% of pixels, then it is considered to be noise-dominated and hence unusable.
| Quadrant | # 1 sec bins | Bins with >0 counts | Bins with >2000 counts | High rate bins dominated by noise | Noise dominated (total time) | Noise dominated (detector-on time) | Marked lightcurve |
|---|---|---|---|---|---|---|---|
| A | 75980 | 55606 | 0 | 0 | 0.00% | 0.00% |  |
| B | 75980 | 55542 | 0 | 0 | 0.00% | 0.00% |  |
| C | 75980 | 55596 | 0 | 0 | 0.00% | 0.00% |  |
| D | 75980 | 55567 | 0 | 0 | 0.00% | 0.00% |  |
Top three noisy pixels from each quadrant. If the there are fewer than three noisy pixels in the level2.evt file, extra rows are filled as -1
| Pixel properties | Quadrant properties | ||||||
|---|---|---|---|---|---|---|---|
| Quadrant | DetID | PixID | Counts | Sigma | Mean | Median | Sigma |
| A | 7 | 110 | 2589 | 8.55 | 838 | 785 | 210.9 |
| A | 9 | 19 | 2534 | 8.29 | 838 | 785 | 210.9 |
| A | 0 | 29 | 2518 | 8.22 | 838 | 785 | 210.9 |
| B | 2 | 9 | 2511 | 11.62 | 776 | 740 | 152.4 |
| B | 3 | 80 | 2269 | 10.04 | 776 | 740 | 152.4 |
| B | 2 | 8 | 2067 | 8.71 | 776 | 740 | 152.4 |
| C | 1 | 81 | 2523 | 8.34 | 818 | 766 | 210.7 |
| C | 1 | 80 | 2487 | 8.17 | 818 | 766 | 210.7 |
| C | 3 | 203 | 2422 | 7.86 | 818 | 766 | 210.7 |
| D | 6 | 38 | 1891 | 6.11 | 747 | 682 | 197.8 |
| D | 10 | 189 | 1865 | 5.98 | 747 | 682 | 197.8 |
| D | 10 | 113 | 1860 | 5.96 | 747 | 682 | 197.8 |
Histogram calculated using DETX and DETY for each event in the final _common_clean file
| Quadrant A | 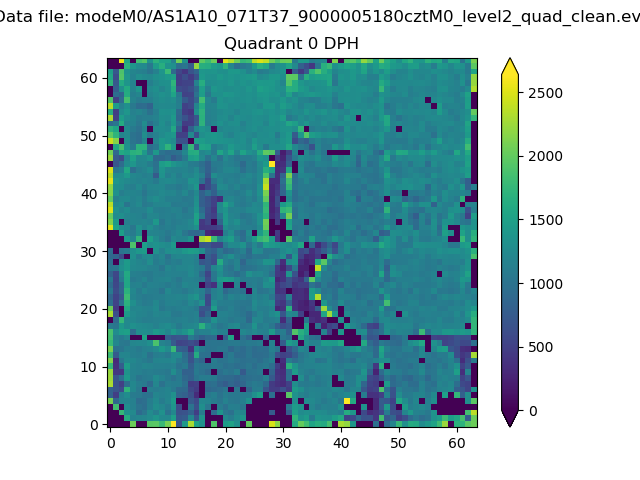 |
 |
Quadrant B |
|---|---|---|---|
| Quadrant D | 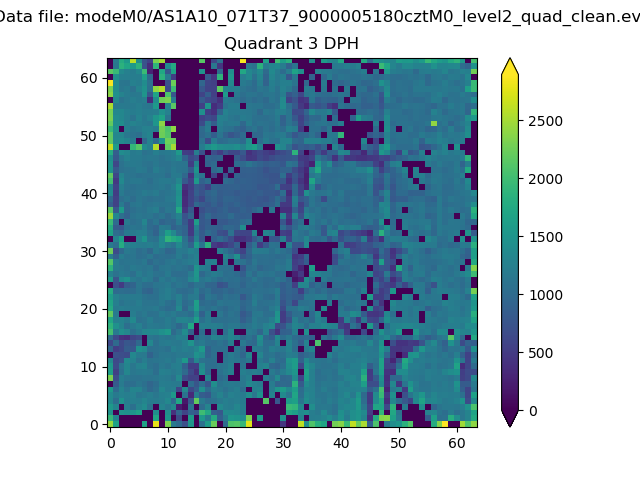 |
 |
Quadrant C |
| Plot type | Count rate plots | Images |
|---|---|---|
| Comparison with Poisson distribution Blue bars denote a histogram of data divided into 1 sec bins. Red curve is a Poisson curve with rate = median count rate of data. |
 |
 |
| Quadrant-wise count rates Data is divided into 100 sec bins |
 |
|
| Module-wise count rates for Quadrant A Data is divided into 100 sec bins |
 |
 |
| Module-wise count rates for Quadrant B Data is divided into 100 sec bins |
 |
 |
| Module-wise count rates for Quadrant C Data is divided into 100 sec bins |
 |
 |
| Module-wise count rates for Quadrant D Data is divided into 100 sec bins |
 |
 |
| Parameter | Plot |
|---|---|
| CZT HV Monitor |  |
| D_VDD |  |
| Temperature 1 |  |
| Veto HV Monitor |  |
| Veto LLD |  |
| Alpha Counter |  |
| _CPM_Rate |  |
| CZT Counter |  |
| +2.5 Volts monitor |  |
| +5 Volts monitor | 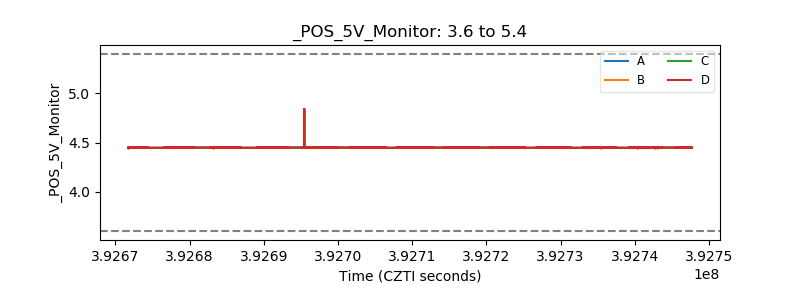 |
| _ROLL_ROT | 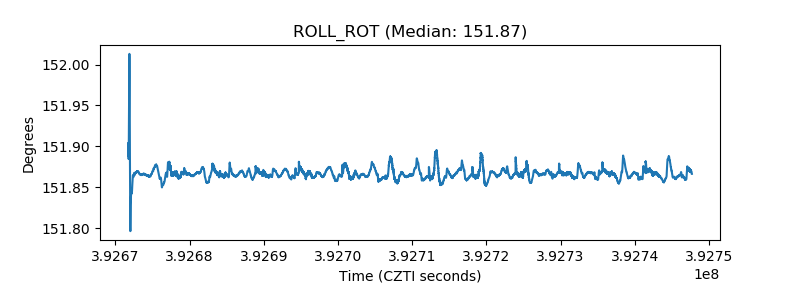 |
| _Roll_DEC |  |
| _Roll_RA |  |
| Veto Counter |  |