| Param | Original file | Final file |
|---|---|---|
| Filename | modeM0/AS1A10_071T37_9000005180_36252cztM0_level2.evt | modeM0/AS1A10_071T37_9000005180_36252cztM0_level2_quad_clean.evt |
| Size (bytes) | 511,329,600 | 82,667,520 |
| Size | 487.6 MB | 78.8 MB |
| Events in quadrant A | 3,163,381 | 523,134 |
| Events in quadrant B | 4,280,868 | 514,318 |
| Events in quadrant C | 3,482,709 | 518,172 |
| Events in quadrant D | 4,113,490 | 490,080 |
| Mode SS | |||
|---|---|---|---|
| Quadrant | BADHDUFLAG | Total packets | Discarded packets |
| A | 0 | 136 | 0 |
| B | 0 | 136 | 0 |
| C | 0 | 136 | 0 |
| D | 0 | 136 | 0 |
| Mode M9 | |||
|---|---|---|---|
| Quadrant | BADHDUFLAG | Total packets | Discarded packets |
| A | 0 | 27 | 0 |
| B | 0 | 27 | 0 |
| C | 0 | 27 | 0 |
| D | 0 | 27 | 0 |
| Mode M0 | |||
|---|---|---|---|
| Quadrant | BADHDUFLAG | Total packets | Discarded packets |
| A | 0 | 13421 | 3 |
| B | 0 | 16854 | 2 |
| C | 0 | 14105 | 2 |
| D | 0 | 16582 | 2 |
| Quadrant | Total seconds | Saturated seconds | Saturation percentage |
|---|---|---|---|
| A | 6557 | 8 | 0.122007% |
| B | 6557 | 345 | 5.261553% |
| C | 6557 | 87 | 1.326826% |
| D | 6557 | 184 | 2.806161% |
Noise dominated data is calculated using 1-second bins in cleaned event files. If a bin has >2000 counts, and if more than 50% of those come from <1% of pixels, then it is considered to be noise-dominated and hence unusable.
| Quadrant | # 1 sec bins | Bins with >0 counts | Bins with >2000 counts | High rate bins dominated by noise | Noise dominated (total time) | Noise dominated (detector-on time) | Marked lightcurve |
|---|---|---|---|---|---|---|---|
| A | 9242 | 6559 | 0 | 0 | 0.00% | 0.00% | 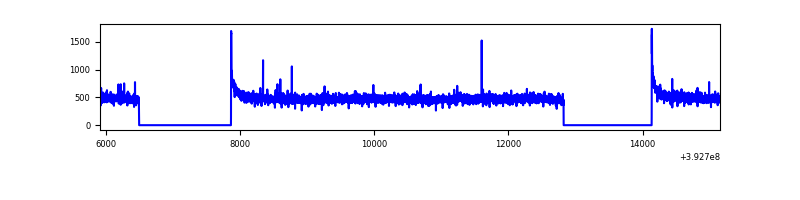 |
| B | 9242 | 6559 | 254 | 254 | 2.75% | 3.87% | 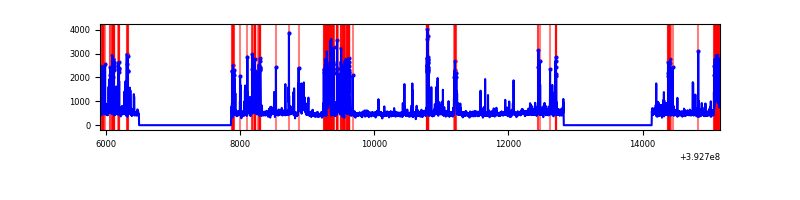 |
| C | 9242 | 6559 | 69 | 69 | 0.75% | 1.05% | 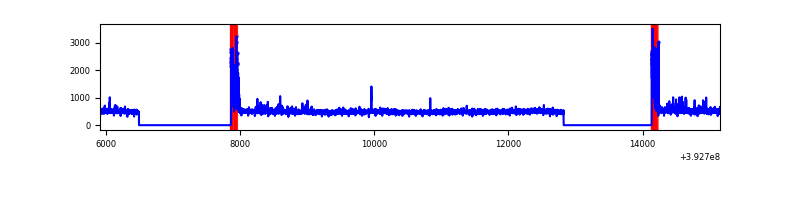 |
| D | 9242 | 6559 | 166 | 166 | 1.80% | 2.53% | 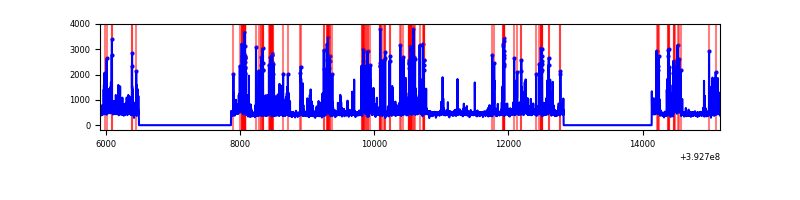 |
Top three noisy pixels from each quadrant. If the there are fewer than three noisy pixels in the level2.evt file, extra rows are filled as -1
| Pixel properties | Quadrant properties | ||||||
|---|---|---|---|---|---|---|---|
| Quadrant | DetID | PixID | Counts | Sigma | Mean | Median | Sigma |
| A | 10 | 83 | 194511 | 1257.82 | 762 | 747 | 154.0 |
| A | 9 | 143 | 13076 | 80.03 | 762 | 747 | 154.0 |
| A | 13 | 254 | 11386 | 69.06 | 762 | 747 | 154.0 |
| B | 5 | 172 | 1007372 | 6986.19 | 743 | 722 | 144.1 |
| B | 5 | 236 | 201735 | 1395.04 | 743 | 722 | 144.1 |
| B | 0 | 189 | 38224 | 260.27 | 743 | 722 | 144.1 |
| C | 0 | 10 | 312648 | 1792.23 | 739 | 744 | 174.0 |
| C | 15 | 214 | 273672 | 1568.27 | 739 | 744 | 174.0 |
| C | 0 | 207 | 11295 | 60.63 | 739 | 744 | 174.0 |
| D | 12 | 6 | 514794 | 2843.37 | 731 | 709 | 180.8 |
| D | 13 | 171 | 224023 | 1235.14 | 731 | 709 | 180.8 |
| D | 2 | 153 | 159817 | 880.02 | 731 | 709 | 180.8 |
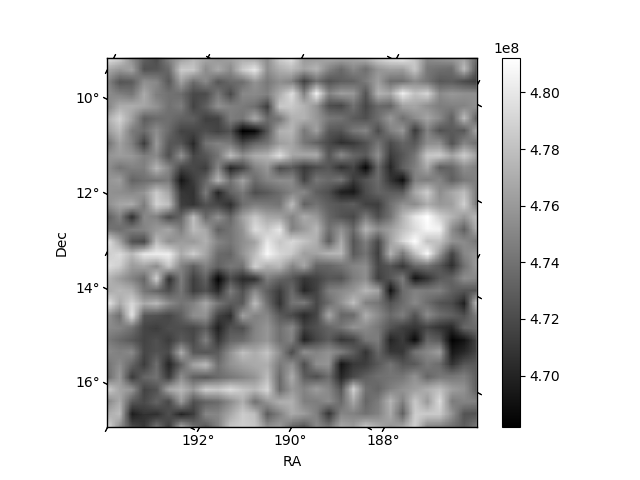
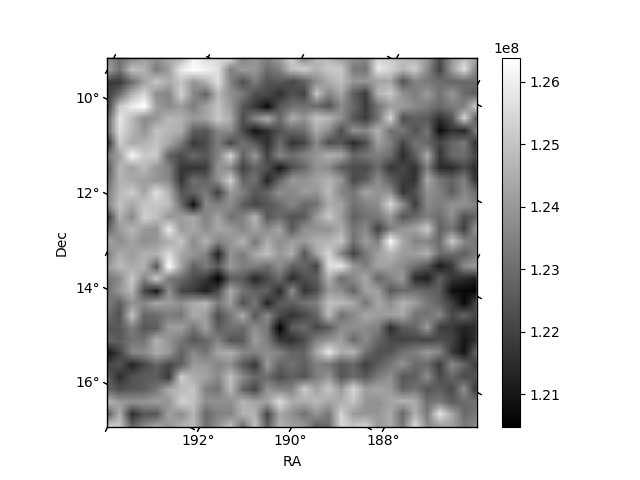
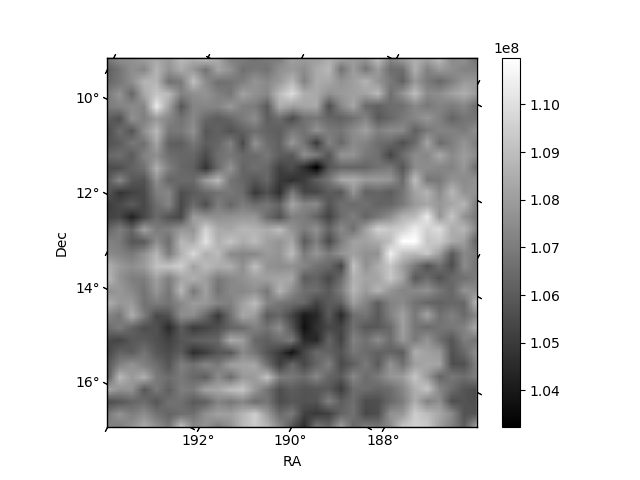
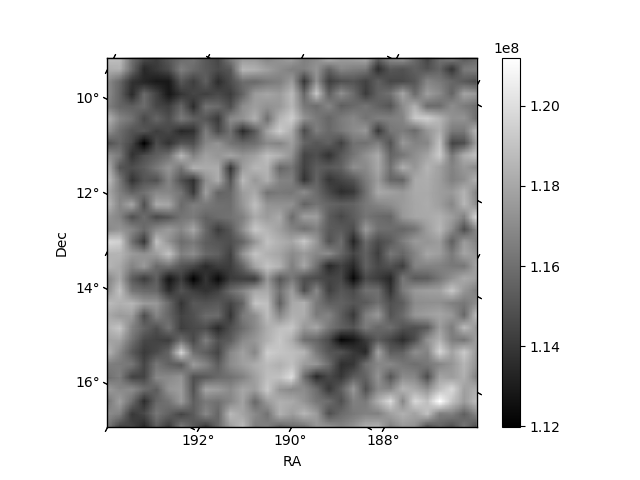
Histogram calculated using DETX and DETY for each event in the final _common_clean file
| Quadrant A | 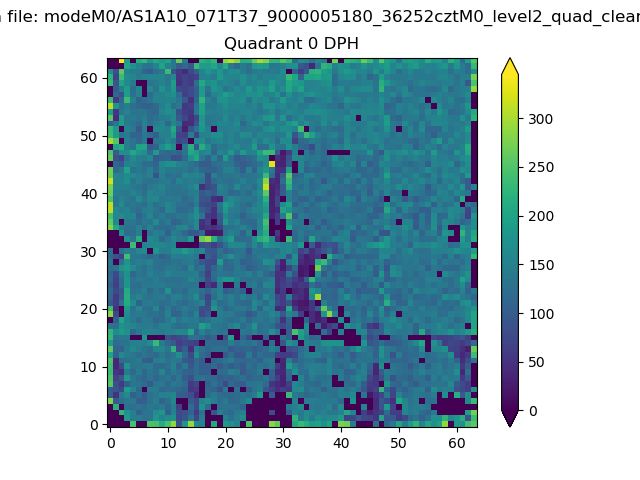 |
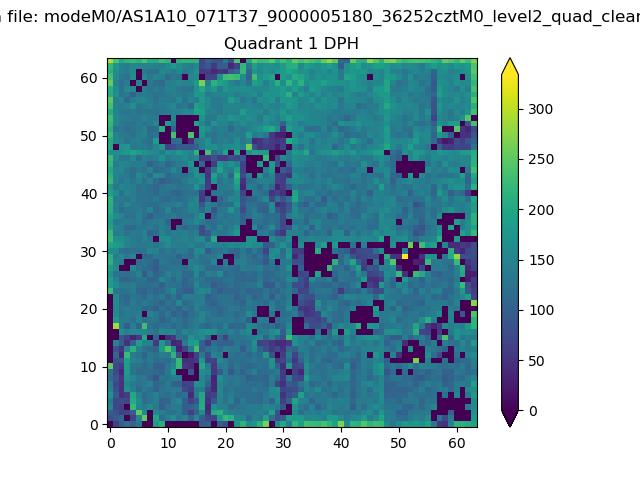 |
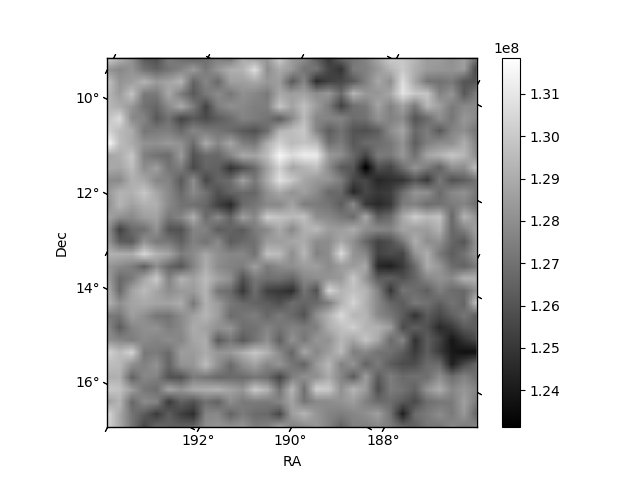
Quadrant B |
|---|---|---|---|
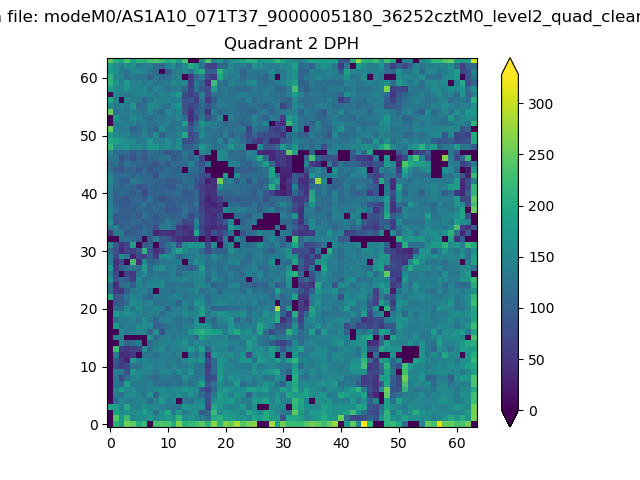
| Quadrant D | 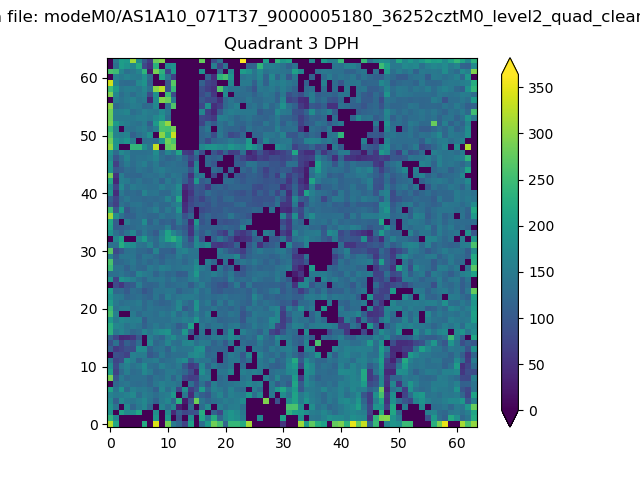 |
 |
Quadrant C |
| Plot type | Count rate plots | Images |
|---|---|---|
| Comparison with Poisson distribution Blue bars denote a histogram of data divided into 1 sec bins. Red curve is a Poisson curve with rate = median count rate of data. |
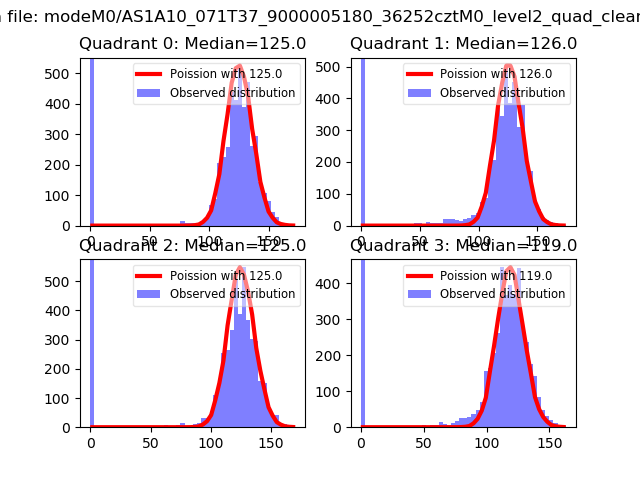 |
 |
| Quadrant-wise count rates Data is divided into 100 sec bins |
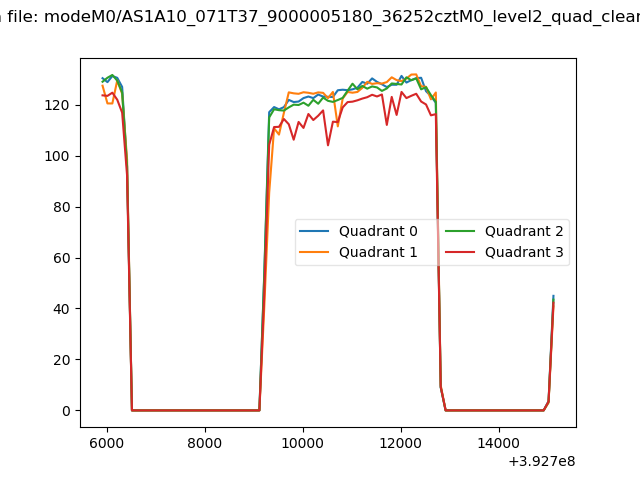 |
|
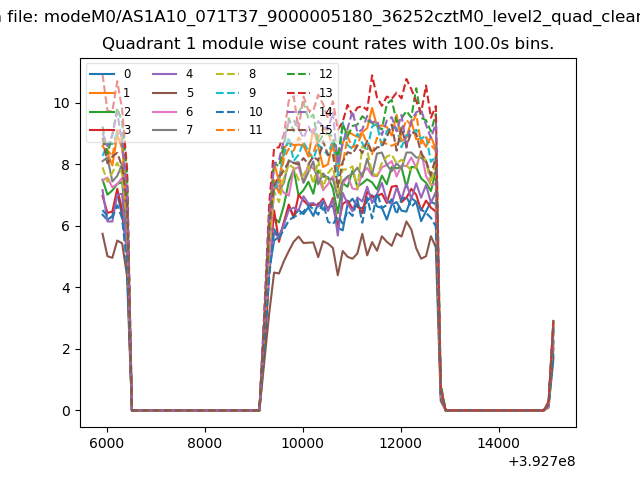
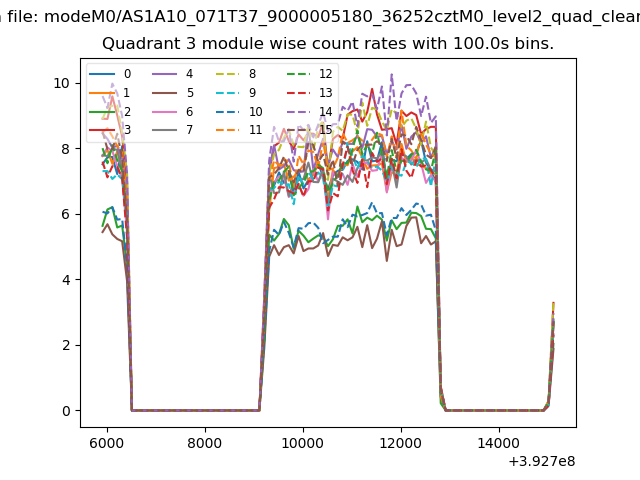
| Module-wise count rates for Quadrant A Data is divided into 100 sec bins |
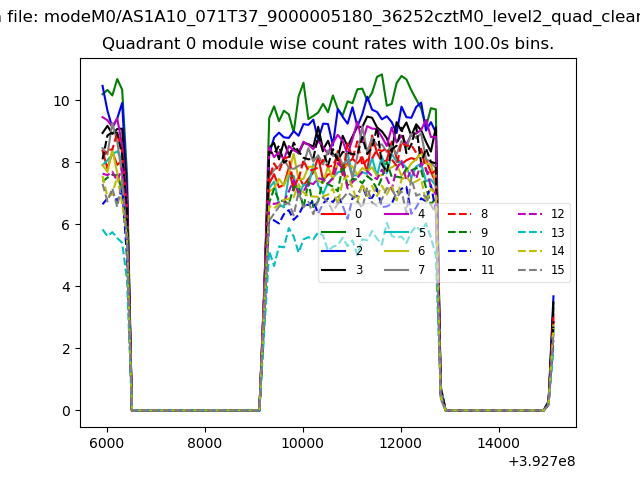 |
 |
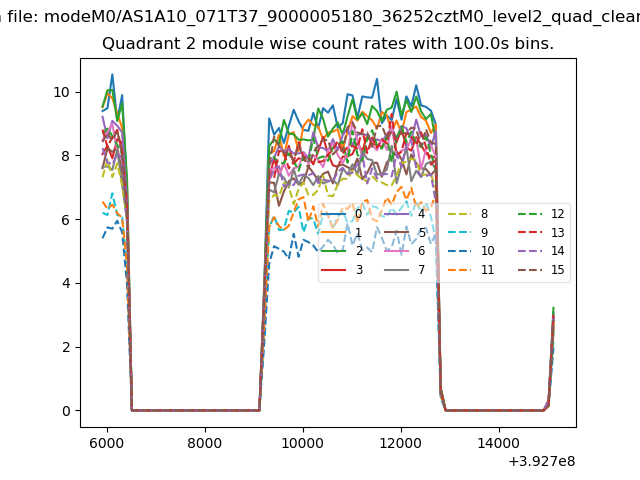
| Module-wise count rates for Quadrant B Data is divided into 100 sec bins |
 |
 |
| Module-wise count rates for Quadrant C Data is divided into 100 sec bins |
 |
 |
| Module-wise count rates for Quadrant D Data is divided into 100 sec bins |
 |
 |
| Parameter | Plot |
|---|---|
| CZT HV Monitor | 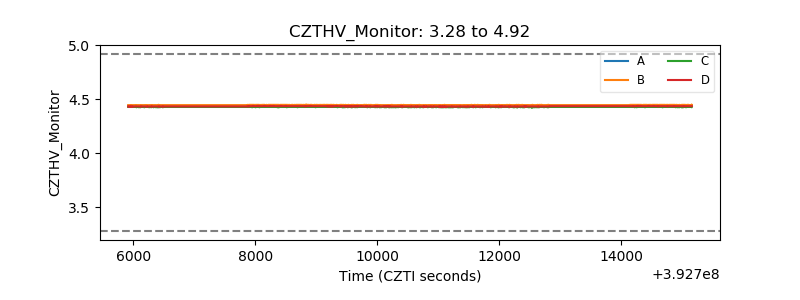 |
| D_VDD | 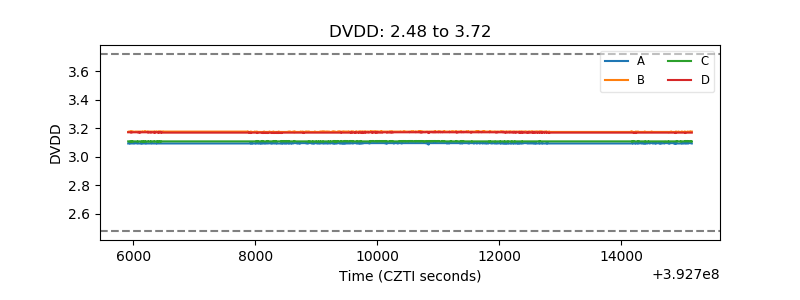 |
| Temperature 1 | 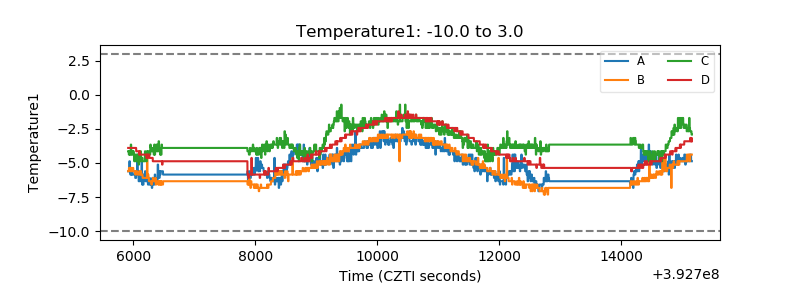 |
| Veto HV Monitor | 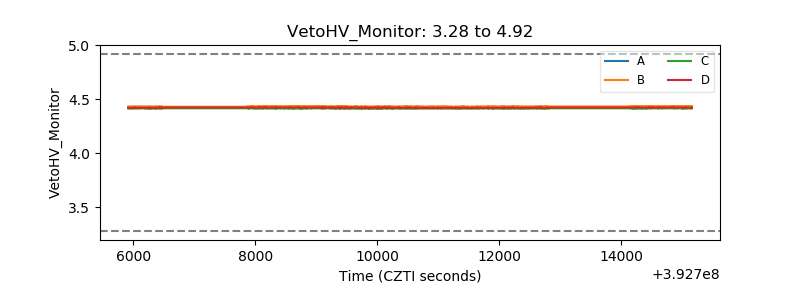 |
| Veto LLD | 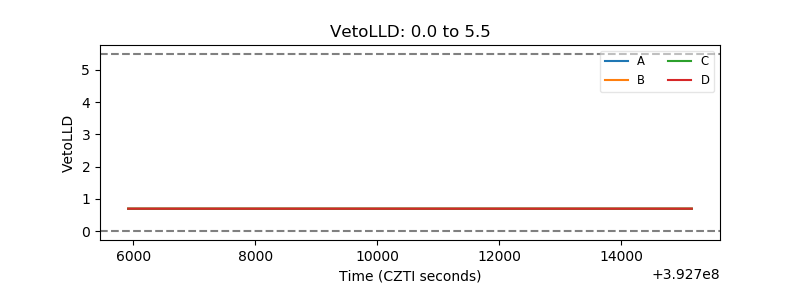 |
| Alpha Counter | 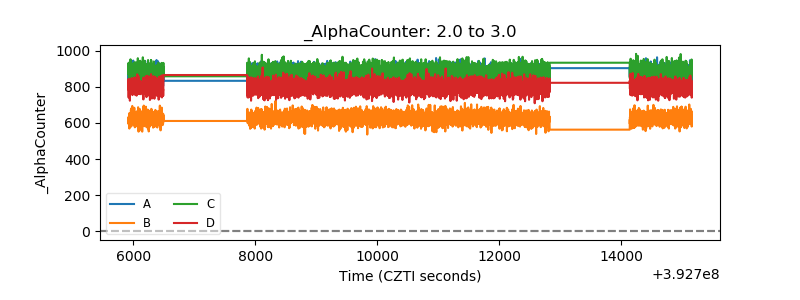 |
| _CPM_Rate | 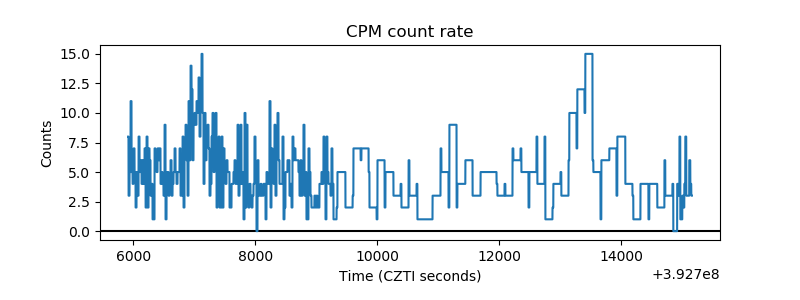 |
| CZT Counter | 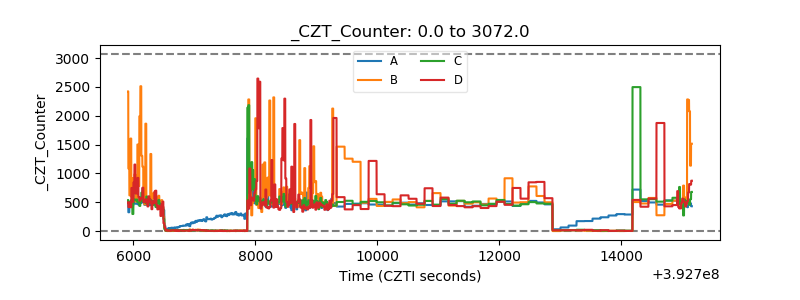 |
| +2.5 Volts monitor |  |
| +5 Volts monitor |  |
| _ROLL_ROT | 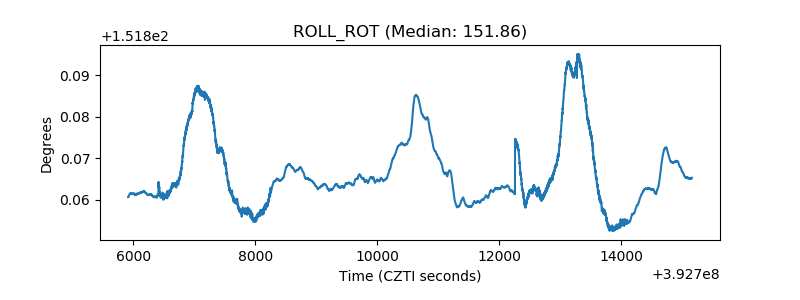 |
| _Roll_DEC | 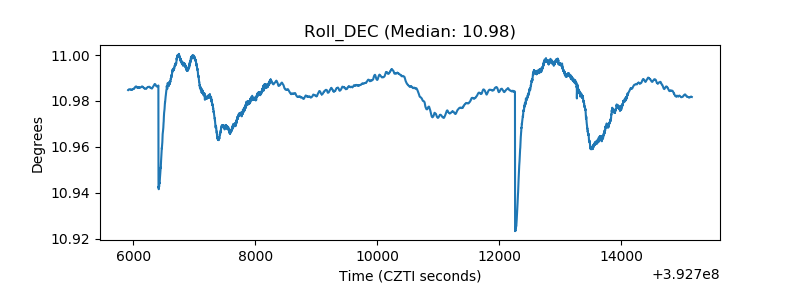 |
| _Roll_RA | 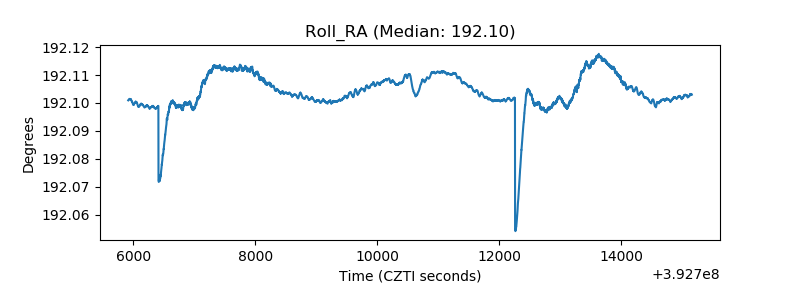 |
| Veto Counter | 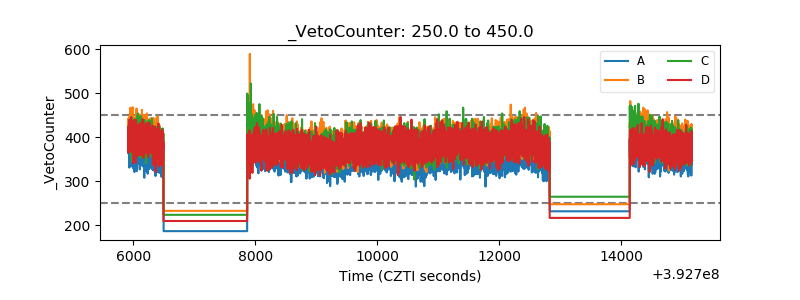 |