| Param | Original file | Final file |
|---|---|---|
| Filename | modeM0/AS1A10_071T36_9000005182cztM0_level2.fits | modeM0/AS1A10_071T36_9000005182cztM0_level2_quad_clean.evt |
| Size (bytes) | 546,376,320 | 479,384,640 |
| Size | 521.1 MB | 457.2 MB |
| Events in quadrant A | 3,376,674 | 2,837,529 |
| Events in quadrant B | 3,125,198 | 2,659,910 |
| Events in quadrant C | 3,284,364 | 2,673,497 |
| Events in quadrant D | 2,767,418 | 2,354,466 |
| Mode SS | |||
|---|---|---|---|
| Quadrant | BADHDUFLAG | Total packets | Discarded packets |
| A | 0 | 1188 | 0 |
| B | 0 | 1188 | 0 |
| C | 0 | 1188 | 0 |
| D | 0 | 1188 | 0 |
| Mode M9 | |||
|---|---|---|---|
| Quadrant | BADHDUFLAG | Total packets | Discarded packets |
| A | 0 | 224 | 0 |
| B | 0 | 224 | 0 |
| C | 0 | 224 | 0 |
| D | 0 | 224 | 0 |
| Mode M0 | |||
|---|---|---|---|
| Quadrant | BADHDUFLAG | Total packets | Discarded packets |
| A | 0 | 120480 | 0 |
| B | 0 | 164468 | 0 |
| C | 0 | 127203 | 0 |
| D | 0 | 162790 | 0 |
| Quadrant | Total seconds | Saturated seconds | Saturation percentage |
|---|---|---|---|
| A | 58188 | 125 | 0.214821% |
| B | 58188 | 4076 | 7.004881% |
| C | 58188 | 508 | 0.873032% |
| D | 58188 | 2570 | 4.416718% |
Noise dominated data is calculated using 1-second bins in cleaned event files. If a bin has >2000 counts, and if more than 50% of those come from <1% of pixels, then it is considered to be noise-dominated and hence unusable.
| Quadrant | # 1 sec bins | Bins with >0 counts | Bins with >2000 counts | High rate bins dominated by noise | Noise dominated (total time) | Noise dominated (detector-on time) | Marked lightcurve |
|---|---|---|---|---|---|---|---|
| A | 80417 | 58184 | 0 | 0 | 0.00% | 0.00% |  |
| B | 80417 | 58151 | 0 | 0 | 0.00% | 0.00% |  |
| C | 80417 | 58187 | 0 | 0 | 0.00% | 0.00% |  |
| D | 80417 | 58143 | 0 | 0 | 0.00% | 0.00% | 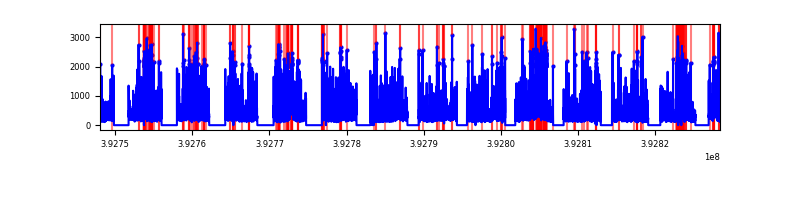 |
Top three noisy pixels from each quadrant. If the there are fewer than three noisy pixels in the level2.evt file, extra rows are filled as -1
| Pixel properties | Quadrant properties | ||||||
|---|---|---|---|---|---|---|---|
| Quadrant | DetID | PixID | Counts | Sigma | Mean | Median | Sigma |
| A | 7 | 110 | 2825 | 9.15 | 880 | 826 | 218.4 |
| A | 0 | 29 | 2757 | 8.84 | 880 | 826 | 218.4 |
| A | 9 | 19 | 2746 | 8.79 | 880 | 826 | 218.4 |
| B | 2 | 9 | 2701 | 11.7 | 827 | 787 | 163.5 |
| B | 3 | 80 | 2481 | 10.36 | 827 | 787 | 163.5 |
| B | 2 | 8 | 2217 | 8.74 | 827 | 787 | 163.5 |
| C | 1 | 81 | 2693 | 8.41 | 867 | 812 | 223.6 |
| C | 1 | 80 | 2614 | 8.06 | 867 | 812 | 223.6 |
| C | 3 | 202 | 2517 | 7.62 | 867 | 812 | 223.6 |
| D | 7 | 3 | 2100 | 6.58 | 792 | 724 | 209.1 |
| D | 10 | 189 | 2081 | 6.49 | 792 | 724 | 209.1 |
| D | 4 | 160 | 2045 | 6.32 | 792 | 724 | 209.1 |
Histogram calculated using DETX and DETY for each event in the final _common_clean file
| Quadrant A |  |
 |
Quadrant B |
|---|---|---|---|
| Quadrant D | 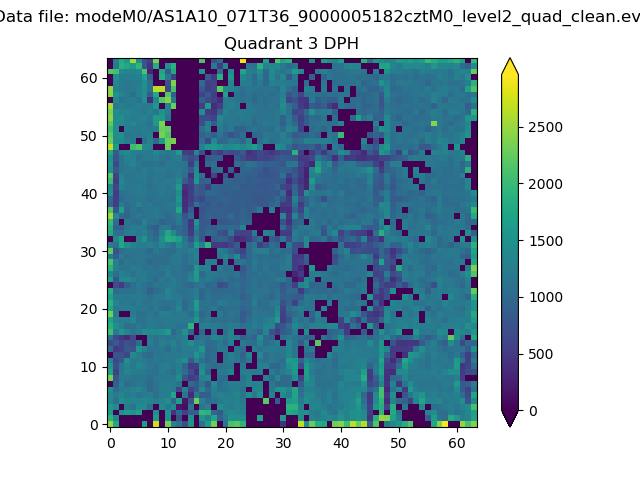 |
 |
Quadrant C |
| Plot type | Count rate plots | Images |
|---|---|---|
| Comparison with Poisson distribution Blue bars denote a histogram of data divided into 1 sec bins. Red curve is a Poisson curve with rate = median count rate of data. |
 |
 |
| Quadrant-wise count rates Data is divided into 100 sec bins |
 |
|
| Module-wise count rates for Quadrant A Data is divided into 100 sec bins |
 |
 |
| Module-wise count rates for Quadrant B Data is divided into 100 sec bins |
 |
 |
| Module-wise count rates for Quadrant C Data is divided into 100 sec bins |
 |
 |
| Module-wise count rates for Quadrant D Data is divided into 100 sec bins |
 |
 |
| Parameter | Plot |
|---|---|
| CZT HV Monitor |  |
| D_VDD | 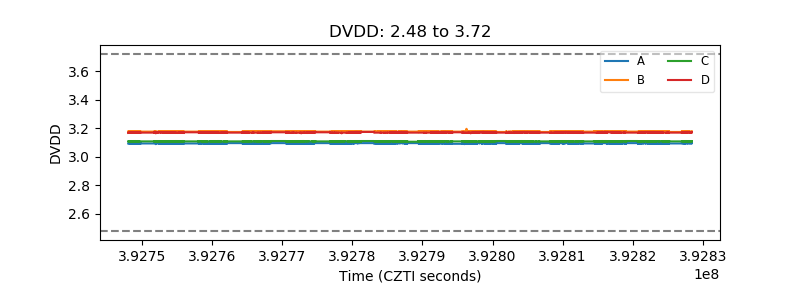 |
| Temperature 1 |  |
| Veto HV Monitor | 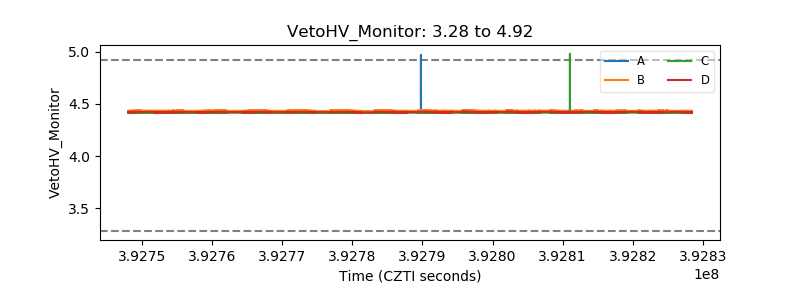 |
| Veto LLD |  |
| Alpha Counter | 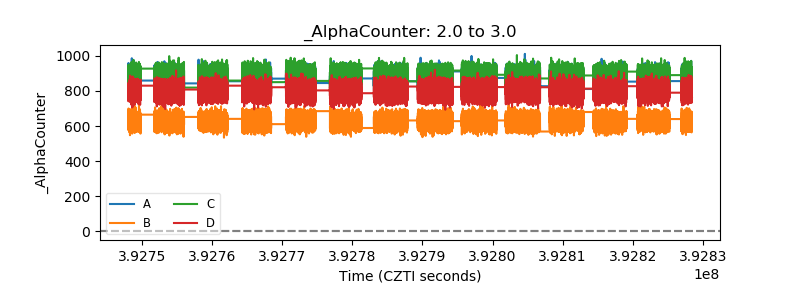 |
| _CPM_Rate | 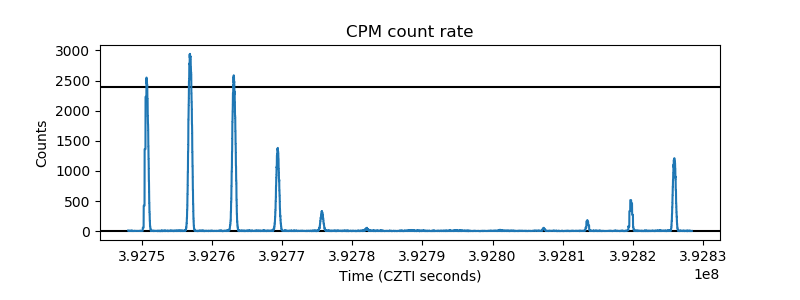 |
| CZT Counter | 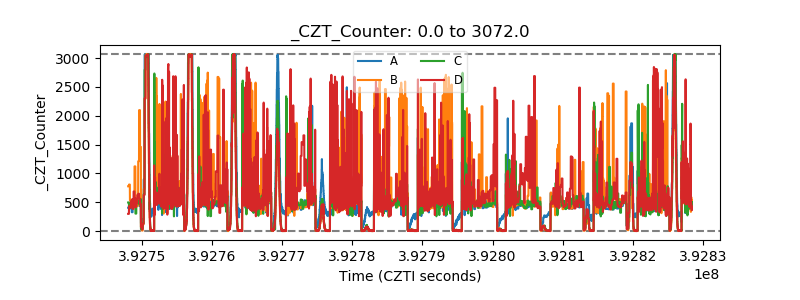 |
| +2.5 Volts monitor |  |
| +5 Volts monitor |  |
| _ROLL_ROT |  |
| _Roll_DEC |  |
| _Roll_RA |  |
| Veto Counter |  |