| Param | Original file | Final file |
|---|---|---|
| Filename | modeM0/AS1A10_071T35_9000005184_36273cztM0_level2.evt | modeM0/AS1A10_071T35_9000005184_36273cztM0_level2_quad_clean.evt |
| Size (bytes) | 274,993,920 | 41,595,840 |
| Size | 262.3 MB | 39.7 MB |
| Events in quadrant A | 1,732,115 | 257,867 |
| Events in quadrant B | 2,273,011 | 256,517 |
| Events in quadrant C | 1,876,473 | 254,378 |
| Events in quadrant D | 2,207,274 | 242,176 |
| Mode M0 | |||
|---|---|---|---|
| Quadrant | BADHDUFLAG | Total packets | Discarded packets |
| A | 0 | 7364 | 2 |
| B | 0 | 9013 | 1 |
| C | 0 | 7648 | 1 |
| D | 0 | 8834 | 1 |
| Mode SS | |||
|---|---|---|---|
| Quadrant | BADHDUFLAG | Total packets | Discarded packets |
| A | 0 | 72 | 0 |
| B | 0 | 72 | 0 |
| C | 0 | 72 | 0 |
| D | 0 | 72 | 0 |
| Mode M9 | |||
|---|---|---|---|
| Quadrant | BADHDUFLAG | Total packets | Discarded packets |
| A | 0 | 19 | 0 |
| B | 0 | 19 | 0 |
| C | 0 | 19 | 0 |
| D | 0 | 19 | 0 |
| Quadrant | Total seconds | Saturated seconds | Saturation percentage |
|---|---|---|---|
| A | 3504 | 6 | 0.171233% |
| B | 3504 | 124 | 3.538813% |
| C | 3504 | 36 | 1.027397% |
| D | 3504 | 29 | 0.827626% |
Noise dominated data is calculated using 1-second bins in cleaned event files. If a bin has >2000 counts, and if more than 50% of those come from <1% of pixels, then it is considered to be noise-dominated and hence unusable.
| Quadrant | # 1 sec bins | Bins with >0 counts | Bins with >2000 counts | High rate bins dominated by noise | Noise dominated (total time) | Noise dominated (detector-on time) | Marked lightcurve |
|---|---|---|---|---|---|---|---|
| A | 5358 | 3505 | 0 | 0 | 0.00% | 0.00% | 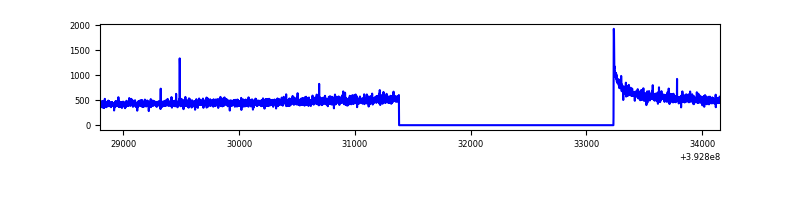 |
| B | 5358 | 3505 | 90 | 90 | 1.68% | 2.57% | 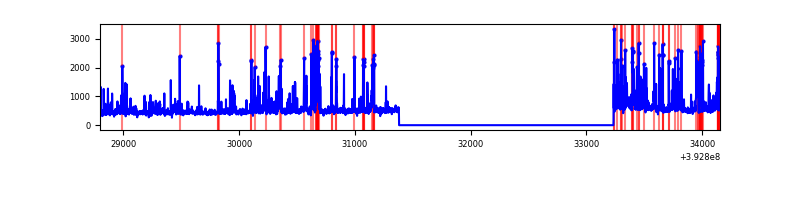 |
| C | 5358 | 3505 | 28 | 28 | 0.52% | 0.80% | 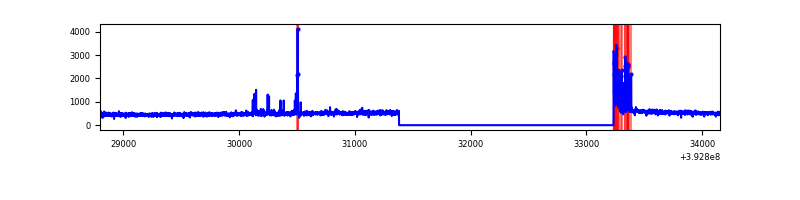 |
| D | 5358 | 3505 | 26 | 26 | 0.49% | 0.74% | 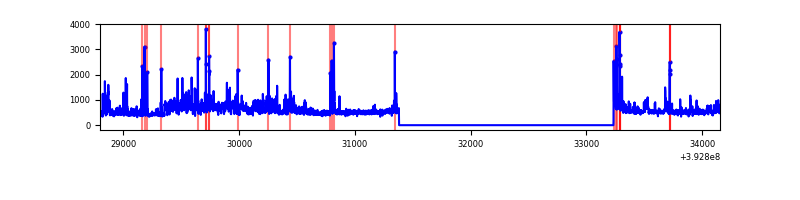 |
Top three noisy pixels from each quadrant. If the there are fewer than three noisy pixels in the level2.evt file, extra rows are filled as -1
| Pixel properties | Quadrant properties | ||||||
|---|---|---|---|---|---|---|---|
| Quadrant | DetID | PixID | Counts | Sigma | Mean | Median | Sigma |
| A | 10 | 83 | 105728 | 1232.35 | 417 | 408 | 85.5 |
| A | 13 | 6 | 6331 | 69.3 | 417 | 408 | 85.5 |
| A | 13 | 254 | 5939 | 64.71 | 417 | 408 | 85.5 |
| B | 5 | 172 | 419857 | 5219.58 | 412 | 401 | 80.4 |
| B | 5 | 236 | 160394 | 1990.9 | 412 | 401 | 80.4 |
| B | 0 | 190 | 30761 | 377.79 | 412 | 401 | 80.4 |
| C | 15 | 214 | 144244 | 1507.56 | 406 | 408 | 95.4 |
| C | 0 | 10 | 106720 | 1114.27 | 406 | 408 | 95.4 |
| C | 0 | 207 | 42493 | 441.1 | 406 | 408 | 95.4 |
| D | 12 | 6 | 381092 | 3796.77 | 403 | 392 | 100.3 |
| D | 2 | 153 | 101084 | 1004.21 | 403 | 392 | 100.3 |
| D | 13 | 249 | 59187 | 586.37 | 403 | 392 | 100.3 |
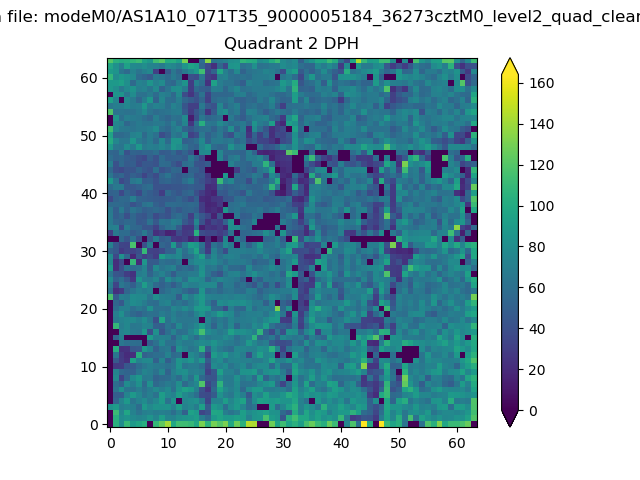
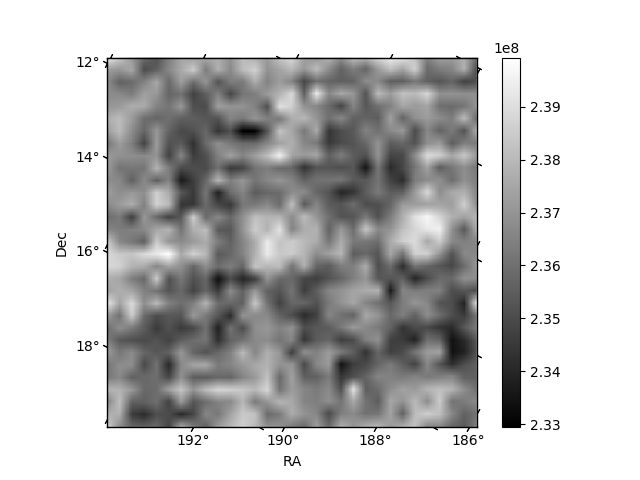
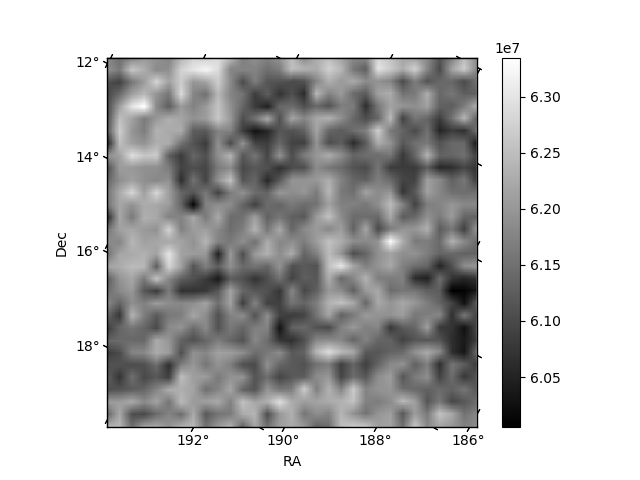
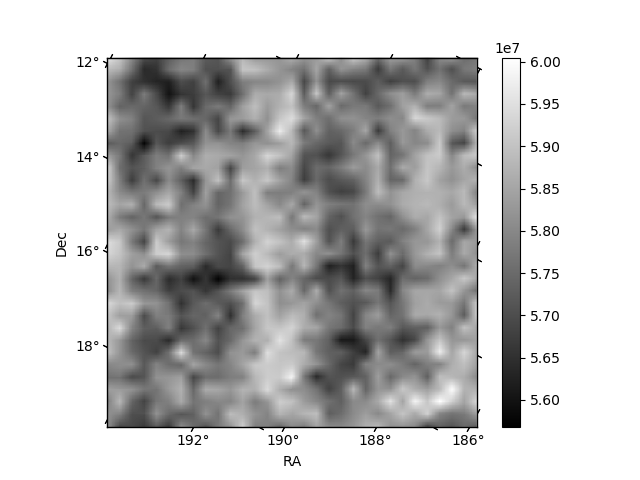
Histogram calculated using DETX and DETY for each event in the final _common_clean file
| Quadrant A | 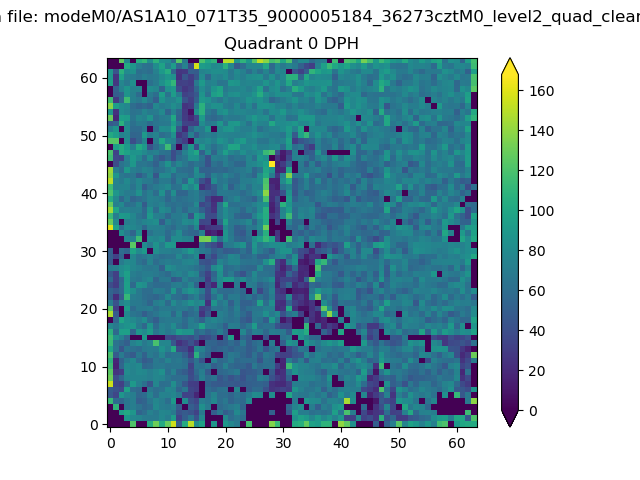 |
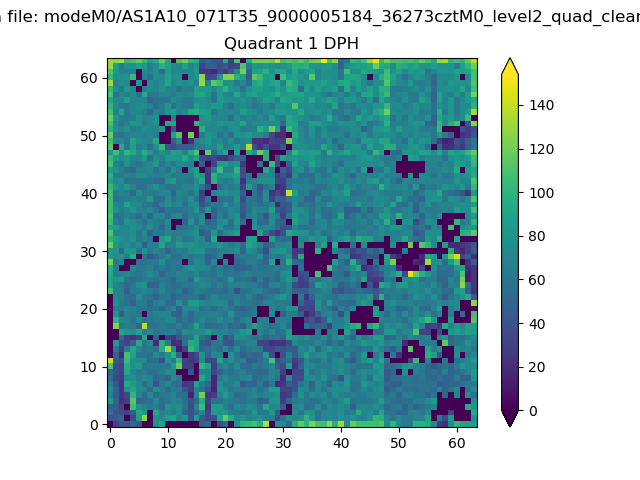 |
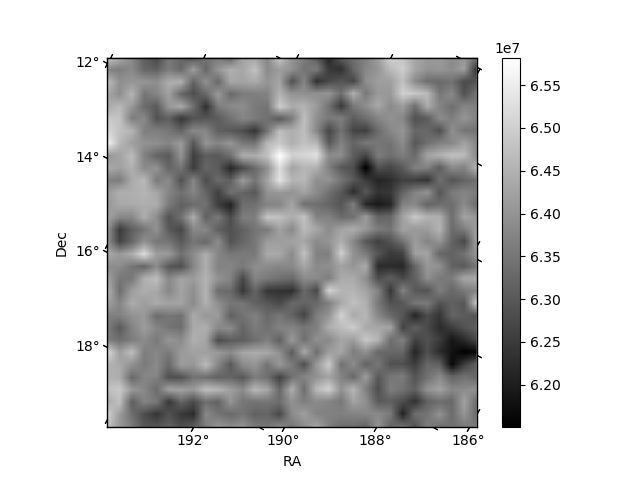
Quadrant B |
|---|---|---|---|
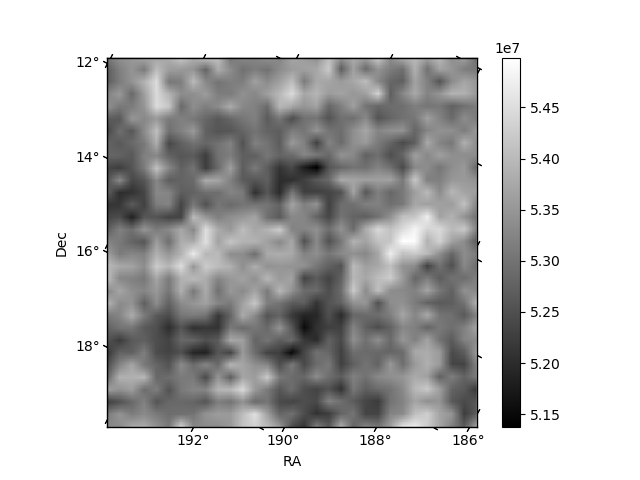
| Quadrant D | 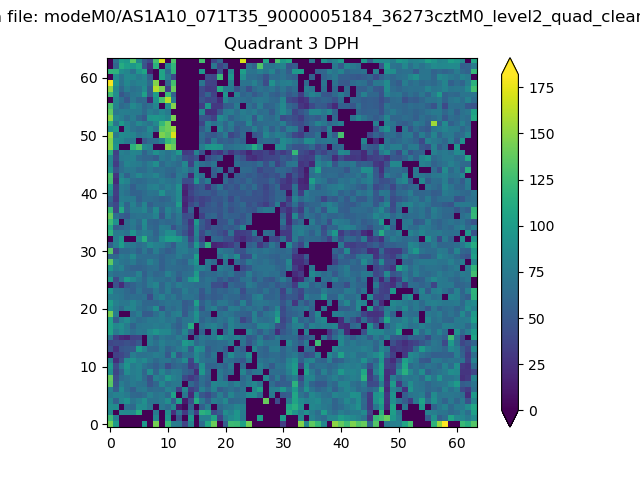 |
 |
Quadrant C |
| Plot type | Count rate plots | Images |
|---|---|---|
| Comparison with Poisson distribution Blue bars denote a histogram of data divided into 1 sec bins. Red curve is a Poisson curve with rate = median count rate of data. |
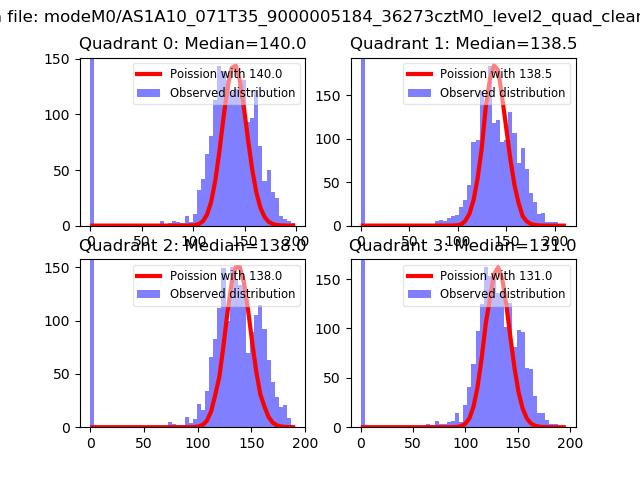 |
 |
| Quadrant-wise count rates Data is divided into 100 sec bins |
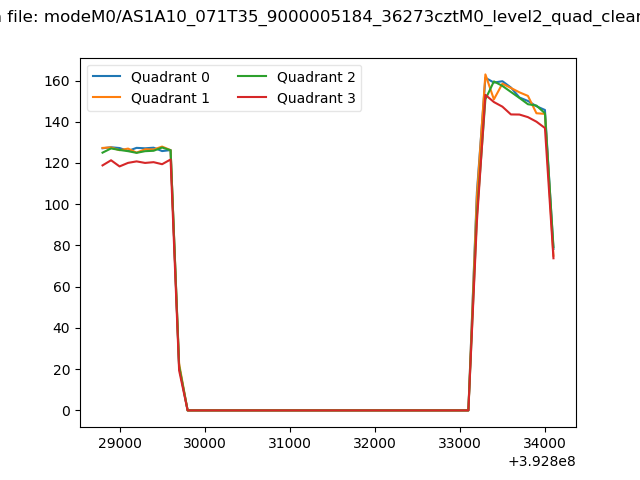 |
|
| Module-wise count rates for Quadrant A Data is divided into 100 sec bins |
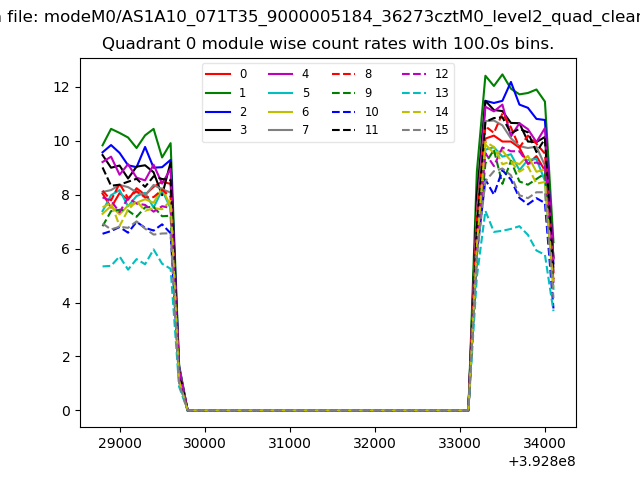 |
 |
| Module-wise count rates for Quadrant B Data is divided into 100 sec bins |
 |
 |
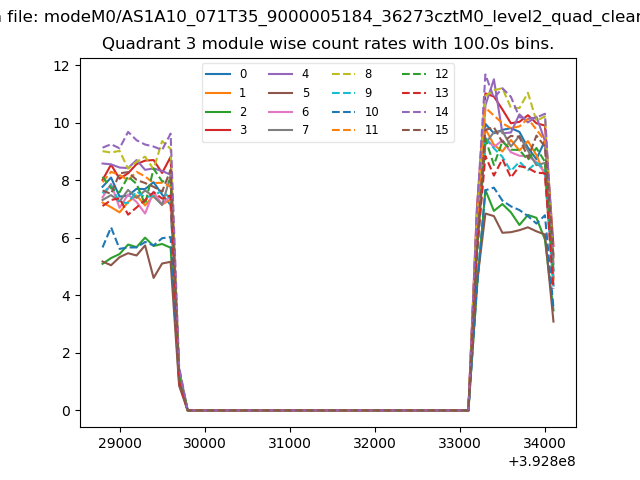
| Module-wise count rates for Quadrant C Data is divided into 100 sec bins |
 |
 |
| Module-wise count rates for Quadrant D Data is divided into 100 sec bins |
 |
 |
| Parameter | Plot |
|---|---|
| CZT HV Monitor | 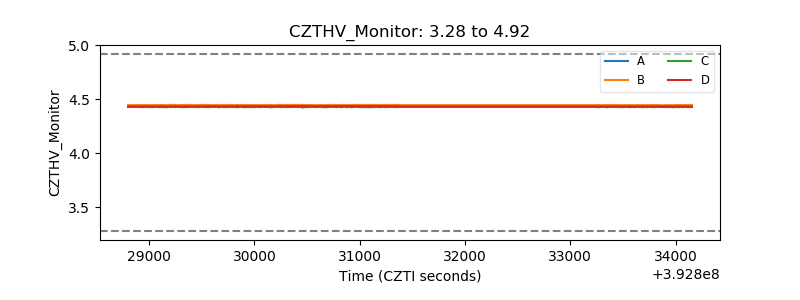 |
| D_VDD | 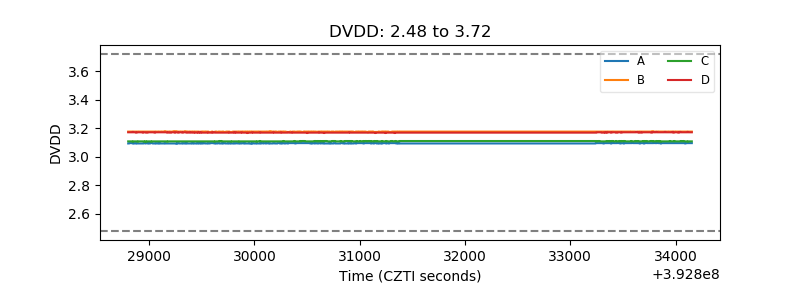 |
| Temperature 1 | 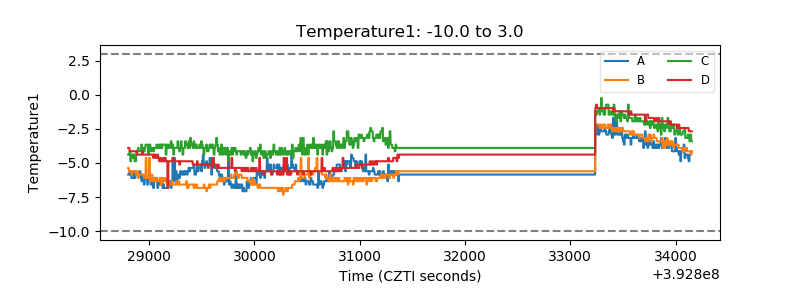 |
| Veto HV Monitor | 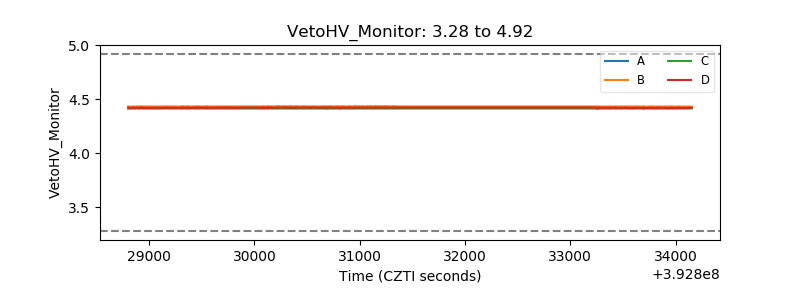 |
| Veto LLD | 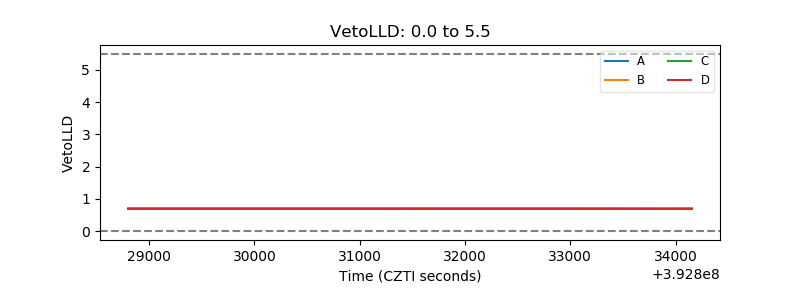 |
| Alpha Counter | 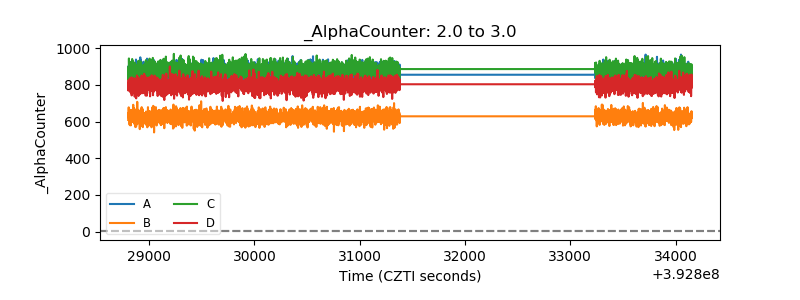 |
| _CPM_Rate | 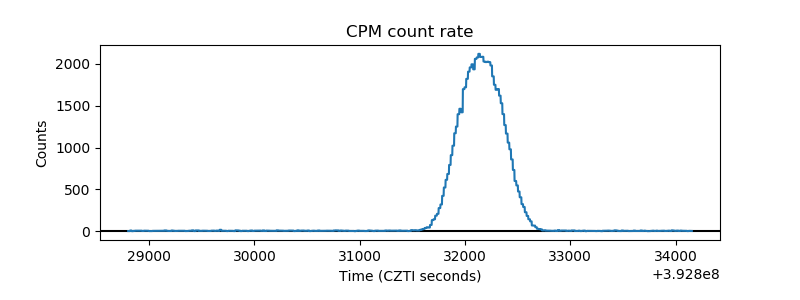 |
| CZT Counter | 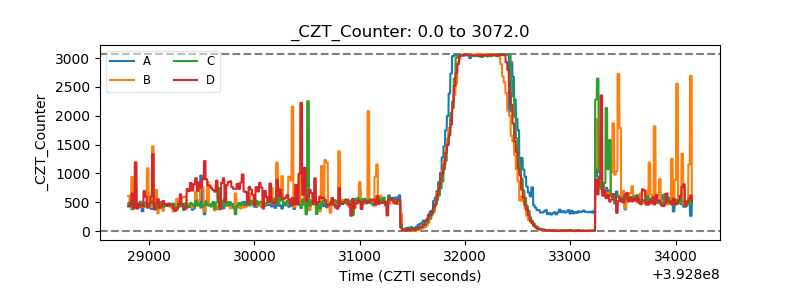 |
| +2.5 Volts monitor |  |
| +5 Volts monitor |  |
| _ROLL_ROT | 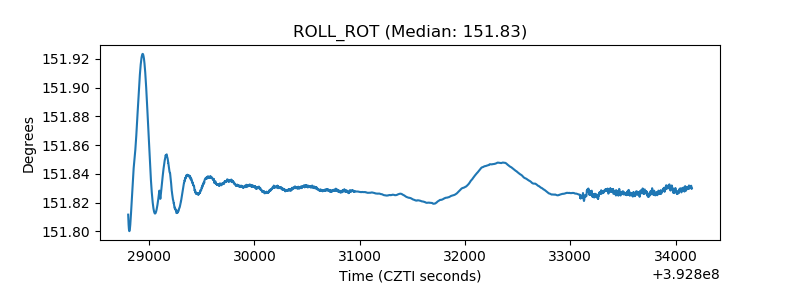 |
| _Roll_DEC | 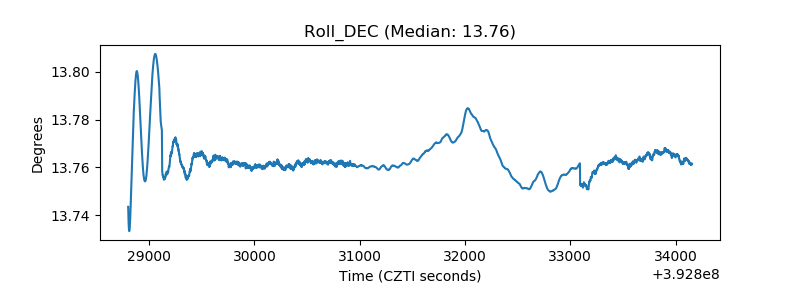 |
| _Roll_RA | 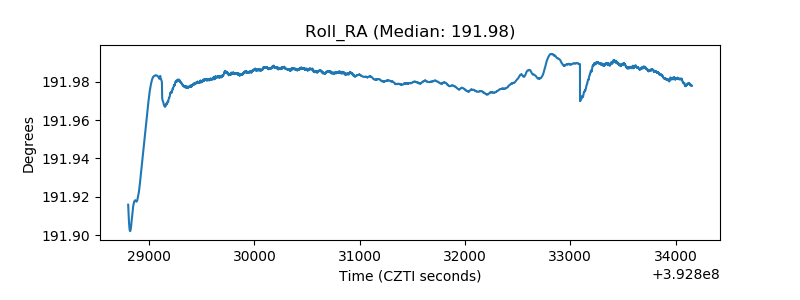 |
| Veto Counter | 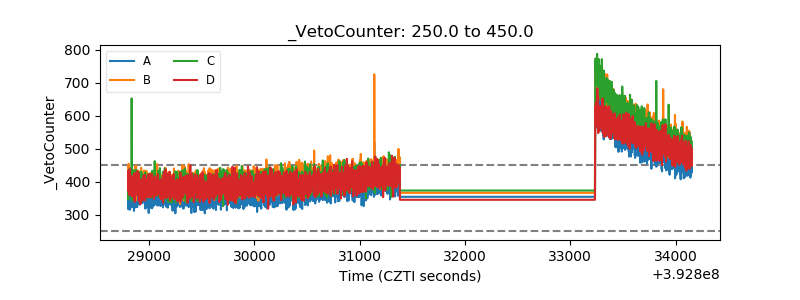 |