| Param | Original file | Final file |
|---|---|---|
| Filename | modeM0/AS1A10_071T33_9000005186_36294cztM0_level2.evt | modeM0/AS1A10_071T33_9000005186_36294cztM0_level2_quad_clean.evt |
| Size (bytes) | 454,780,800 | 54,794,880 |
| Size | 433.7 MB | 52.3 MB |
| Events in quadrant A | 2,685,169 | 327,115 |
| Events in quadrant B | 3,453,580 | 324,768 |
| Events in quadrant C | 2,864,079 | 322,884 |
| Events in quadrant D | 4,393,871 | 296,148 |
| Mode M0 | |||
|---|---|---|---|
| Quadrant | BADHDUFLAG | Total packets | Discarded packets |
| A | 0 | 11398 | 3 |
| B | 0 | 13871 | 2 |
| C | 0 | 11746 | 2 |
| D | 0 | 16759 | 2 |
| Mode SS | |||
|---|---|---|---|
| Quadrant | BADHDUFLAG | Total packets | Discarded packets |
| A | 0 | 114 | 0 |
| B | 0 | 114 | 0 |
| C | 0 | 114 | 0 |
| D | 0 | 114 | 0 |
| Mode M9 | |||
|---|---|---|---|
| Quadrant | BADHDUFLAG | Total packets | Discarded packets |
| A | 0 | 30 | 0 |
| B | 0 | 30 | 0 |
| C | 0 | 30 | 0 |
| D | 0 | 31 | 0 |
| Quadrant | Total seconds | Saturated seconds | Saturation percentage |
|---|---|---|---|
| A | 5538 | 6 | 0.108342% |
| B | 5538 | 187 | 3.376670% |
| C | 5538 | 34 | 0.613940% |
| D | 5538 | 334 | 6.031058% |
Noise dominated data is calculated using 1-second bins in cleaned event files. If a bin has >2000 counts, and if more than 50% of those come from <1% of pixels, then it is considered to be noise-dominated and hence unusable.
| Quadrant | # 1 sec bins | Bins with >0 counts | Bins with >2000 counts | High rate bins dominated by noise | Noise dominated (total time) | Noise dominated (detector-on time) | Marked lightcurve |
|---|---|---|---|---|---|---|---|
| A | 7001 | 5539 | 1 | 1 | 0.01% | 0.02% | 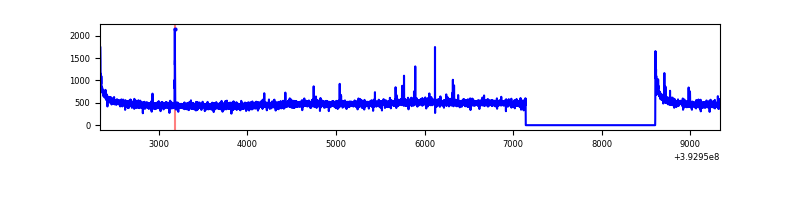 |
| B | 7001 | 5539 | 135 | 135 | 1.93% | 2.44% | 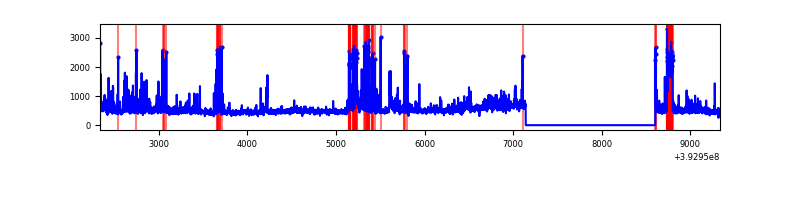 |
| C | 7001 | 5539 | 26 | 26 | 0.37% | 0.47% | 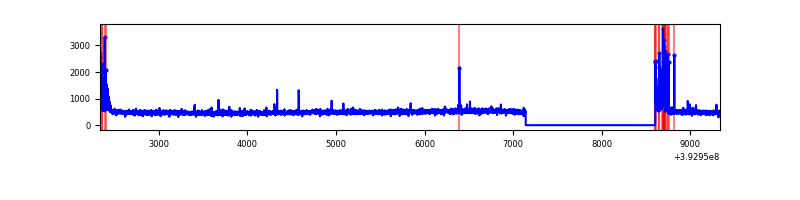 |
| D | 7001 | 5539 | 347 | 347 | 4.96% | 6.26% | 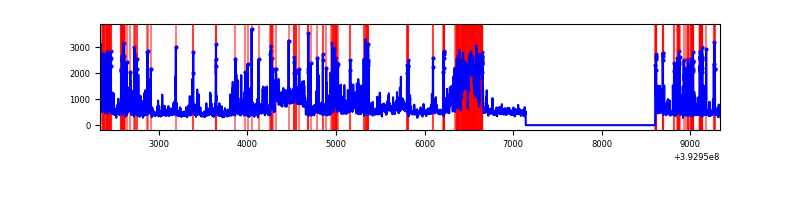 |
Top three noisy pixels from each quadrant. If the there are fewer than three noisy pixels in the level2.evt file, extra rows are filled as -1
| Pixel properties | Quadrant properties | ||||||
|---|---|---|---|---|---|---|---|
| Quadrant | DetID | PixID | Counts | Sigma | Mean | Median | Sigma |
| A | 10 | 83 | 178776 | 1374.12 | 639 | 625 | 129.6 |
| A | 9 | 143 | 24847 | 186.83 | 639 | 625 | 129.6 |
| A | 13 | 6 | 10642 | 77.26 | 639 | 625 | 129.6 |
| B | 5 | 172 | 490648 | 4071.99 | 627 | 612 | 120.3 |
| B | 0 | 155 | 164698 | 1363.49 | 627 | 612 | 120.3 |
| B | 0 | 245 | 77377 | 637.88 | 627 | 612 | 120.3 |
| C | 15 | 214 | 235708 | 1605.04 | 621 | 625 | 146.5 |
| C | 0 | 10 | 187870 | 1278.43 | 621 | 625 | 146.5 |
| C | 15 | 159 | 13123 | 85.33 | 621 | 625 | 146.5 |
| D | 12 | 227 | 754949 | 5049.48 | 606 | 588 | 149.4 |
| D | 12 | 6 | 699793 | 4680.28 | 606 | 588 | 149.4 |
| D | 1 | 20 | 231874 | 1548.16 | 606 | 588 | 149.4 |
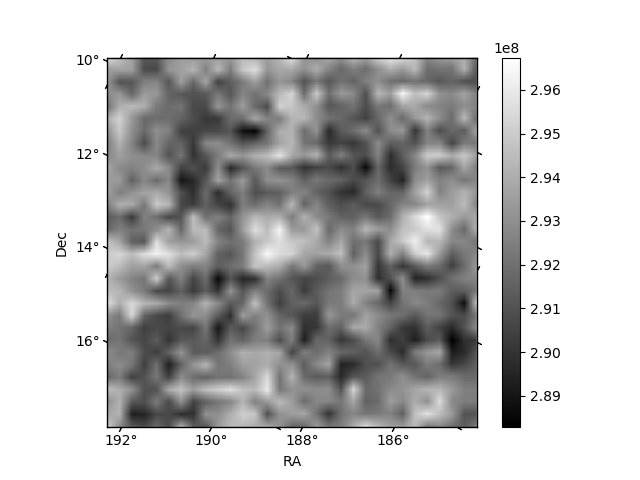
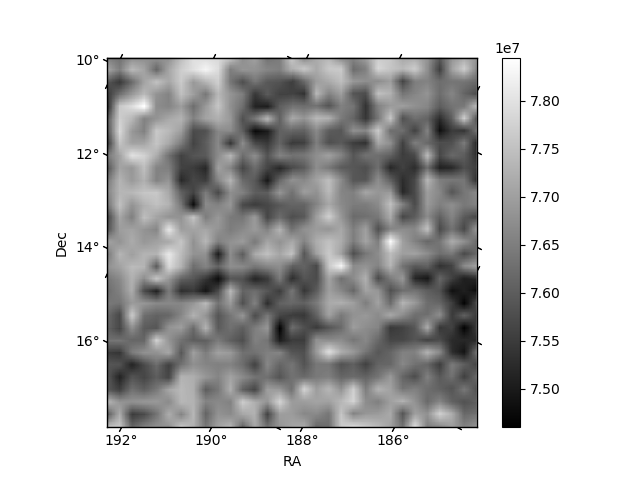
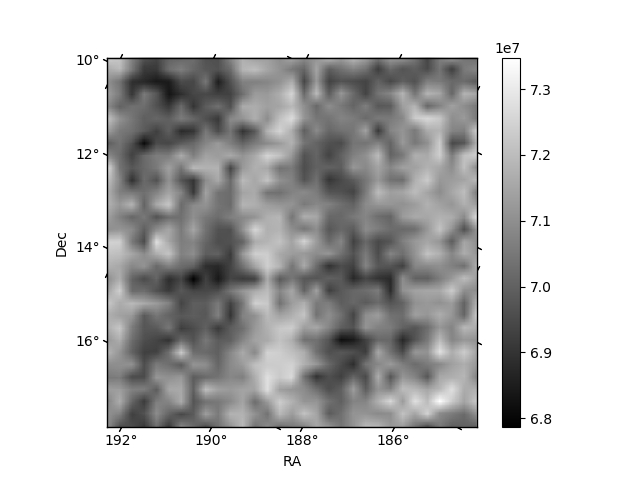
Histogram calculated using DETX and DETY for each event in the final _common_clean file
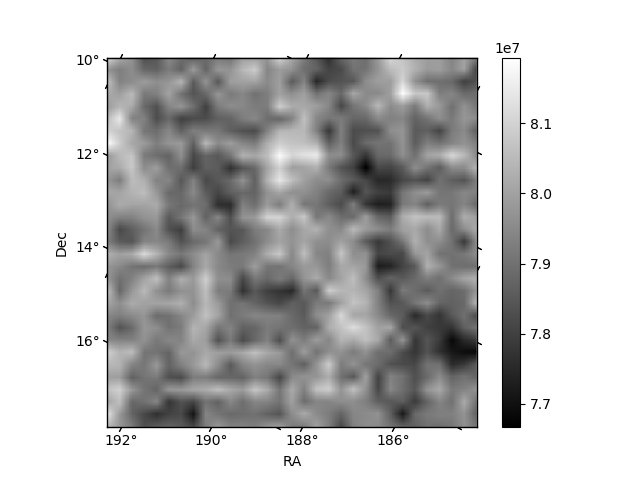
| Quadrant A | 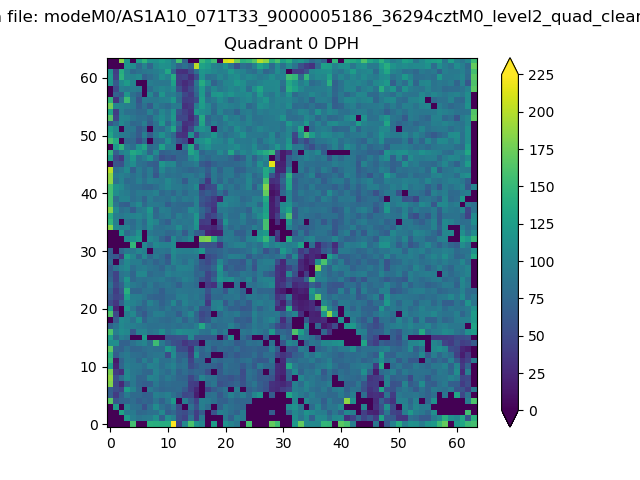 |
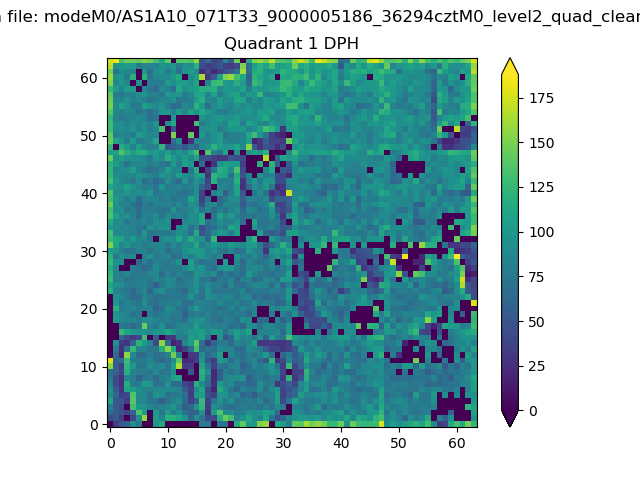 |
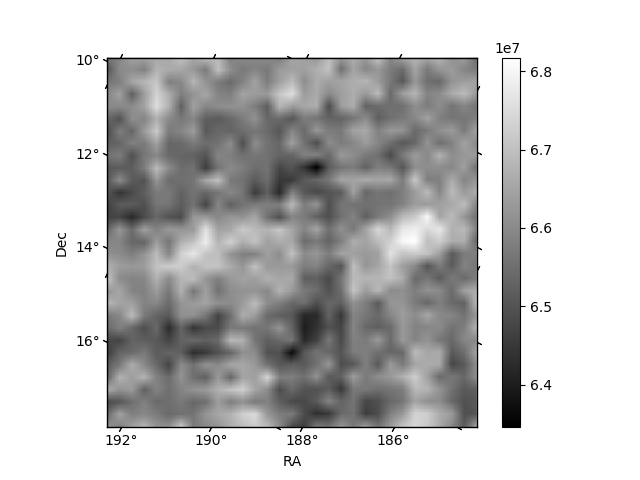
Quadrant B |
|---|---|---|---|
| Quadrant D | 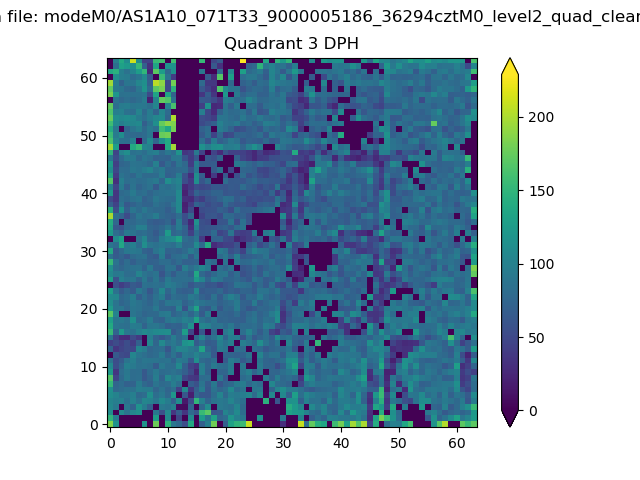 |
 |
Quadrant C |
| Plot type | Count rate plots | Images |
|---|---|---|
| Comparison with Poisson distribution Blue bars denote a histogram of data divided into 1 sec bins. Red curve is a Poisson curve with rate = median count rate of data. |
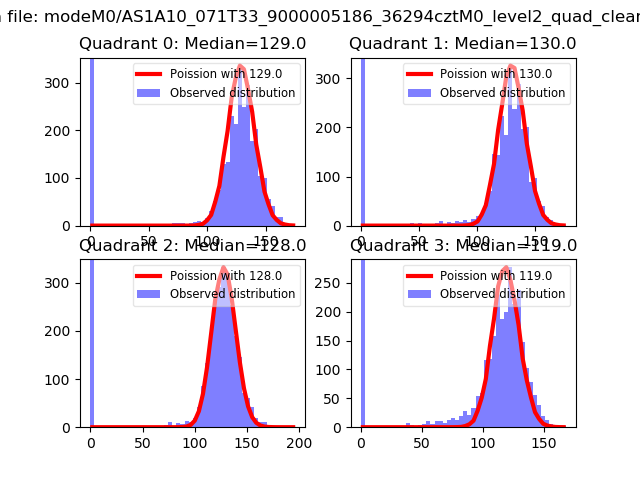 |
 |
| Quadrant-wise count rates Data is divided into 100 sec bins |
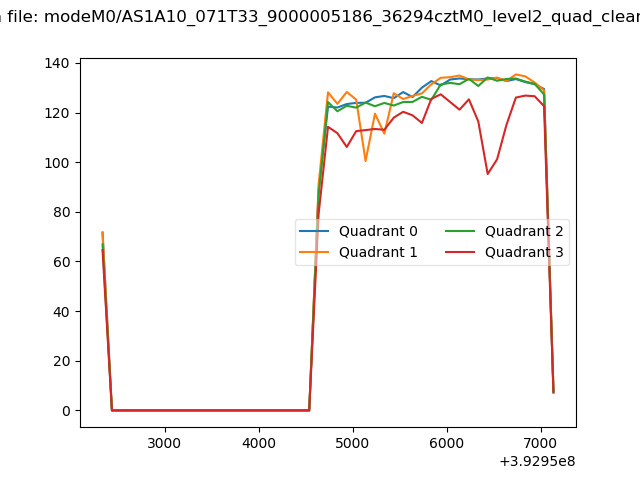 |
|
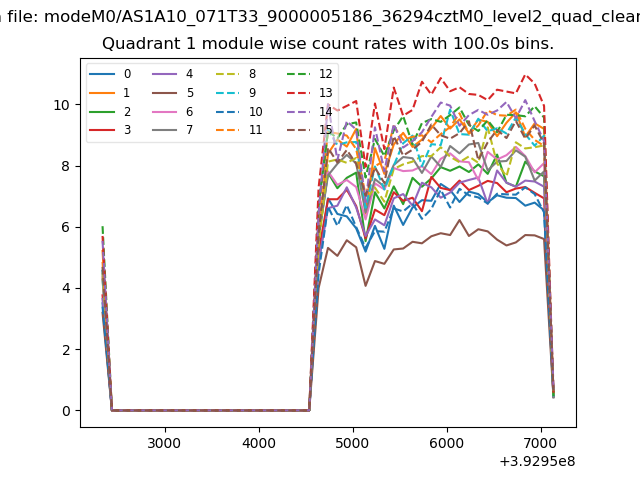
| Module-wise count rates for Quadrant A Data is divided into 100 sec bins |
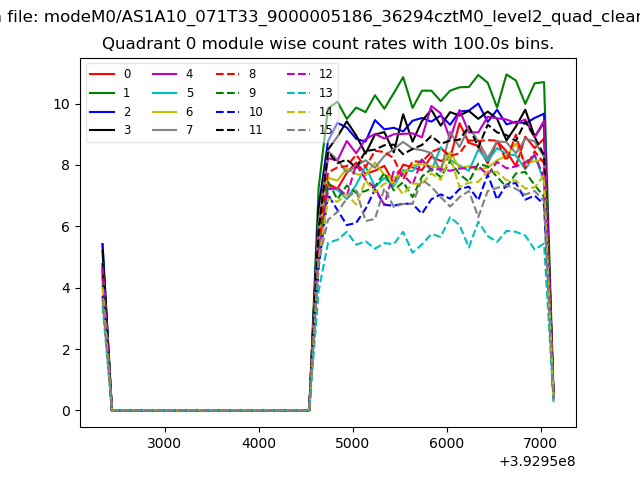 |
 |
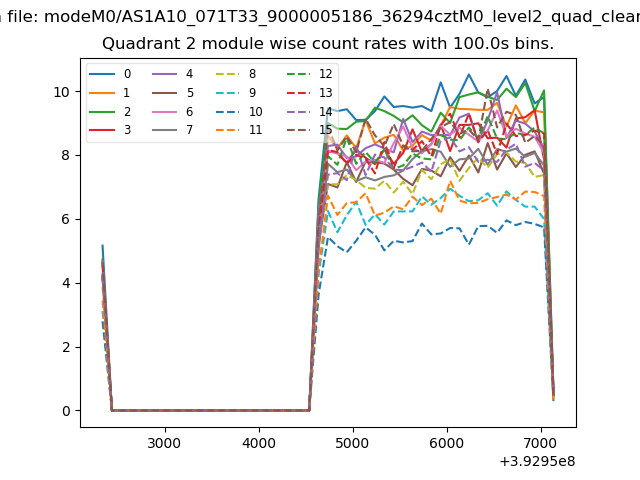
| Module-wise count rates for Quadrant B Data is divided into 100 sec bins |
 |
 |
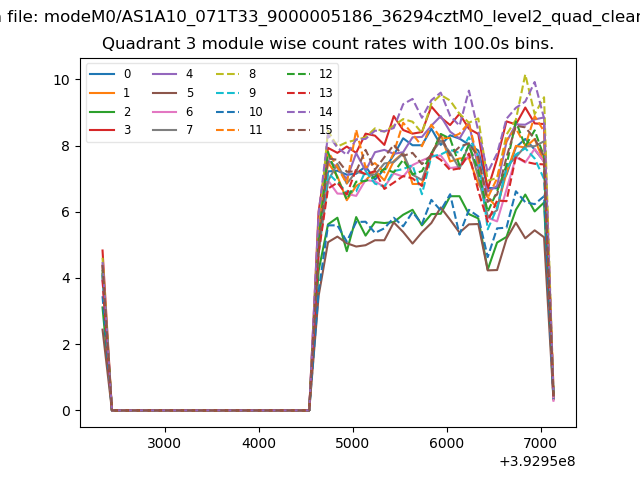
| Module-wise count rates for Quadrant C Data is divided into 100 sec bins |
 |
 |
| Module-wise count rates for Quadrant D Data is divided into 100 sec bins |
 |
 |
| Parameter | Plot |
|---|---|
| CZT HV Monitor | 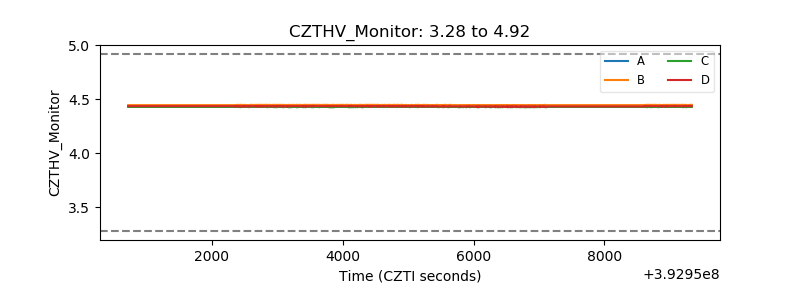 |
| D_VDD | 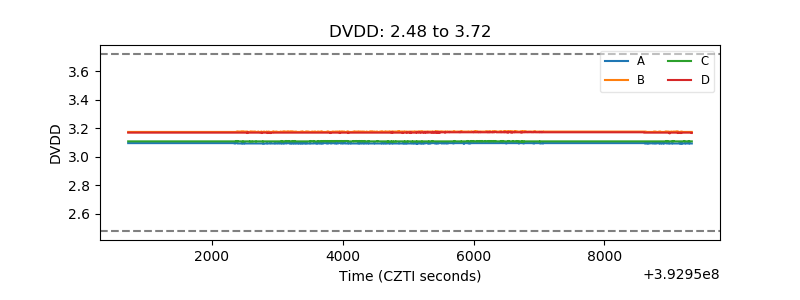 |
| Temperature 1 | 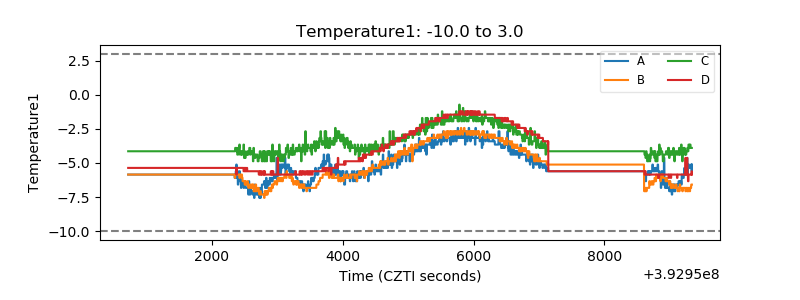 |
| Veto HV Monitor | 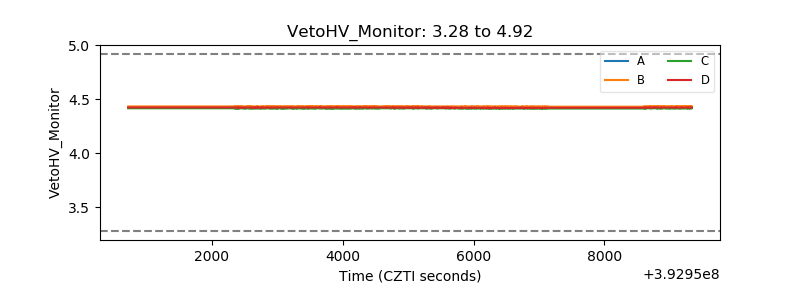 |
| Veto LLD | 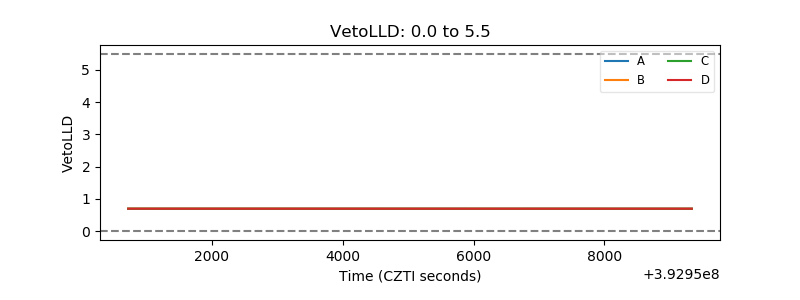 |
| Alpha Counter | 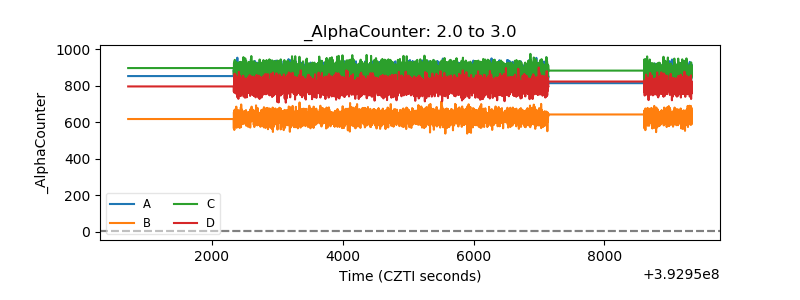 |
| _CPM_Rate | 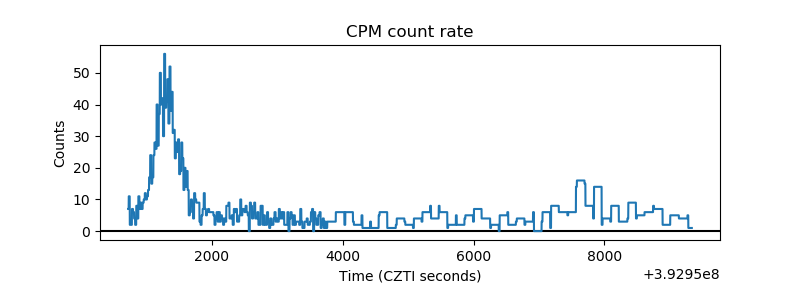 |
| CZT Counter |  |
| +2.5 Volts monitor |  |
| +5 Volts monitor |  |
| _ROLL_ROT | 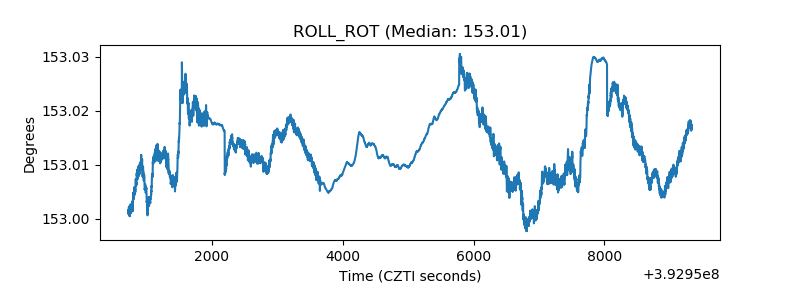 |
| _Roll_DEC | 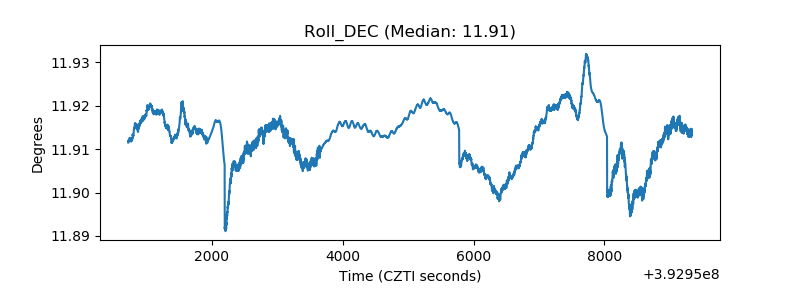 |
| _Roll_RA | 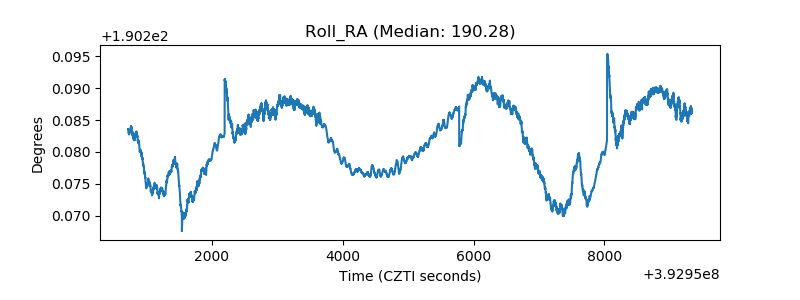 |
| Veto Counter | 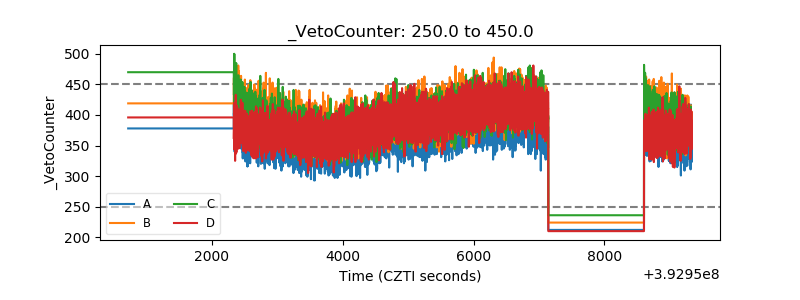 |