| Param | Original file | Final file |
|---|---|---|
| Filename | modeM0/AS1A10_103T02_9000005192cztM0_level2.fits | modeM0/AS1A10_103T02_9000005192cztM0_level2_quad_clean.evt |
| Size (bytes) | 295,683,840 | 284,114,880 |
| Size | 282.0 MB | 271.0 MB |
| Events in quadrant A | 1,848,158 | 1,784,187 |
| Events in quadrant B | 1,685,354 | 1,587,966 |
| Events in quadrant C | 1,774,696 | 1,639,556 |
| Events in quadrant D | 1,509,624 | 1,456,447 |
| Mode M9 | |||
|---|---|---|---|
| Quadrant | BADHDUFLAG | Total packets | Discarded packets |
| A | 0 | 145 | 0 |
| B | 0 | 145 | 0 |
| C | 0 | 145 | 0 |
| D | 0 | 145 | 0 |
| Mode SS | |||
|---|---|---|---|
| Quadrant | BADHDUFLAG | Total packets | Discarded packets |
| A | 0 | 636 | 0 |
| B | 0 | 636 | 0 |
| C | 0 | 636 | 0 |
| D | 0 | 636 | 0 |
| Mode M0 | |||
|---|---|---|---|
| Quadrant | BADHDUFLAG | Total packets | Discarded packets |
| A | 0 | 65836 | 0 |
| B | 0 | 90008 | 0 |
| C | 0 | 68256 | 0 |
| D | 0 | 85617 | 0 |
| Quadrant | Total seconds | Saturated seconds | Saturation percentage |
|---|---|---|---|
| A | 31074 | 112 | 0.360430% |
| B | 31074 | 2655 | 8.544120% |
| C | 31074 | 337 | 1.084508% |
| D | 31074 | 1568 | 5.046019% |
Noise dominated data is calculated using 1-second bins in cleaned event files. If a bin has >2000 counts, and if more than 50% of those come from <1% of pixels, then it is considered to be noise-dominated and hence unusable.
| Quadrant | # 1 sec bins | Bins with >0 counts | Bins with >2000 counts | High rate bins dominated by noise | Noise dominated (total time) | Noise dominated (detector-on time) | Marked lightcurve |
|---|---|---|---|---|---|---|---|
| A | 44732 | 31071 | 0 | 0 | 0.00% | 0.00% | 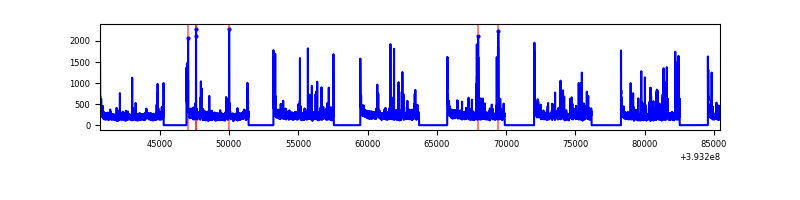 |
| B | 44732 | 31017 | 0 | 0 | 0.00% | 0.00% |  |
| C | 44733 | 31068 | 0 | 0 | 0.00% | 0.00% |  |
| D | 44734 | 31042 | 0 | 0 | 0.00% | 0.00% |  |
Top three noisy pixels from each quadrant. If the there are fewer than three noisy pixels in the level2.evt file, extra rows are filled as -1
| Pixel properties | Quadrant properties | ||||||
|---|---|---|---|---|---|---|---|
| Quadrant | DetID | PixID | Counts | Sigma | Mean | Median | Sigma |
| A | 7 | 110 | 1540 | 9.03 | 483 | 459 | 119.7 |
| A | 0 | 29 | 1527 | 8.92 | 483 | 459 | 119.7 |
| A | 9 | 19 | 1509 | 8.77 | 483 | 459 | 119.7 |
| B | 2 | 9 | 1481 | 12.15 | 446 | 429 | 86.6 |
| B | 3 | 80 | 1277 | 9.79 | 446 | 429 | 86.6 |
| B | 2 | 8 | 1206 | 8.97 | 446 | 429 | 86.6 |
| C | 1 | 81 | 1483 | 8.49 | 469 | 442 | 122.5 |
| C | 1 | 80 | 1438 | 8.12 | 469 | 442 | 122.5 |
| C | 3 | 203 | 1362 | 7.5 | 469 | 442 | 122.5 |
| D | 7 | 3 | 1127 | 6.27 | 433 | 397 | 116.5 |
| D | 6 | 38 | 1119 | 6.2 | 433 | 397 | 116.5 |
| D | 4 | 160 | 1119 | 6.2 | 433 | 397 | 116.5 |
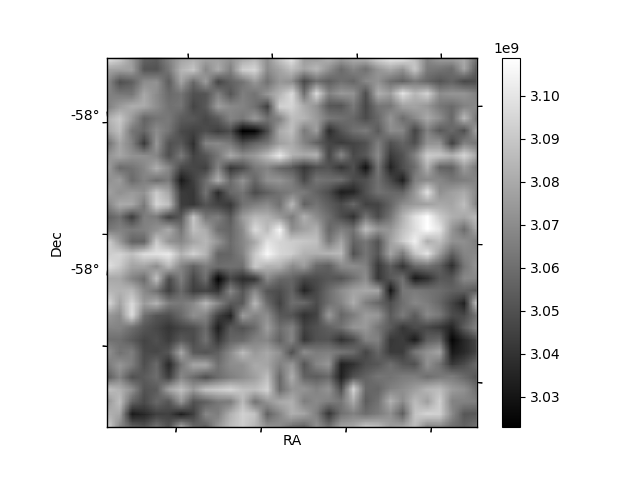
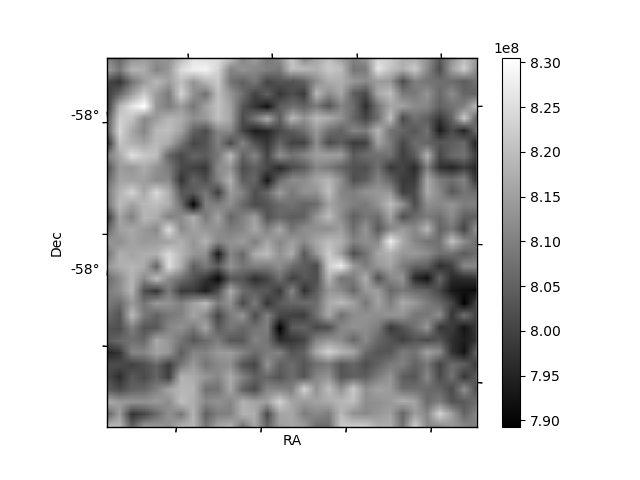
Histogram calculated using DETX and DETY for each event in the final _common_clean file
| Quadrant A | 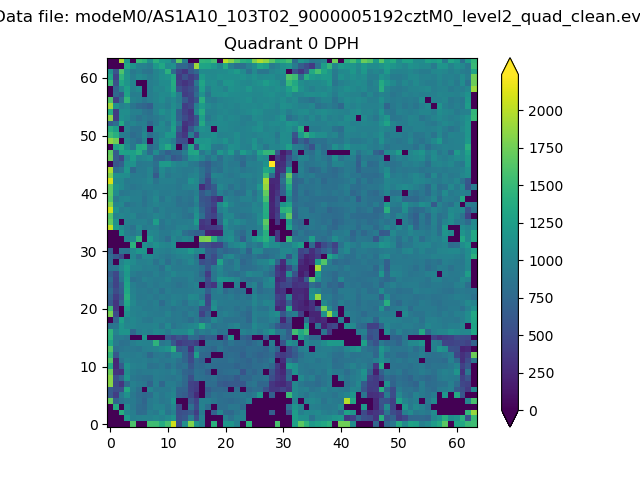 |
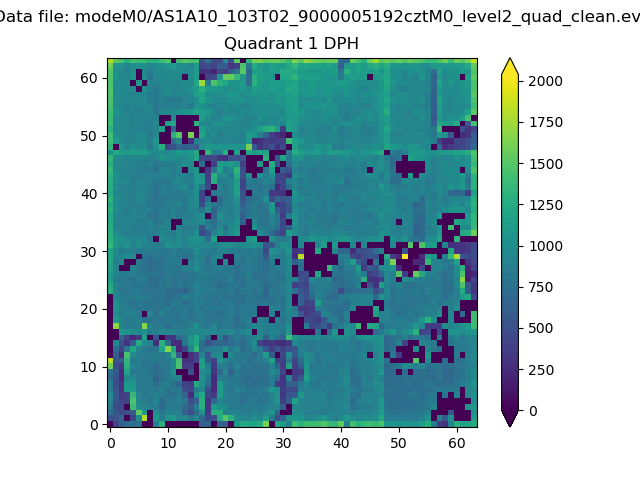 |
Quadrant B |
|---|---|---|---|
| Quadrant D | 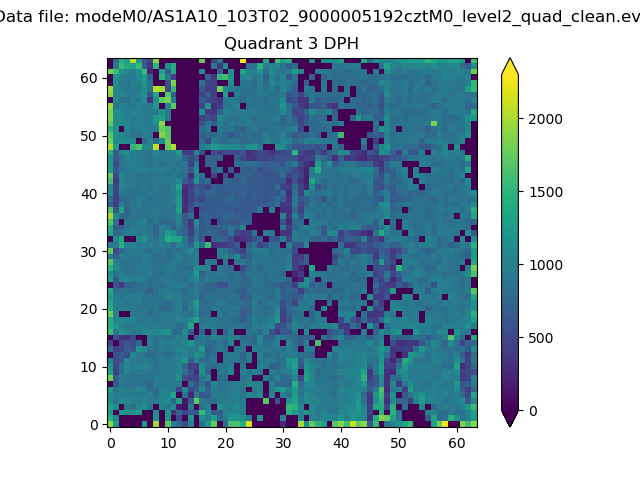 |
 |
Quadrant C |
| Plot type | Count rate plots | Images |
|---|---|---|
| Comparison with Poisson distribution Blue bars denote a histogram of data divided into 1 sec bins. Red curve is a Poisson curve with rate = median count rate of data. |
 |
 |
| Quadrant-wise count rates Data is divided into 100 sec bins |
 |
|
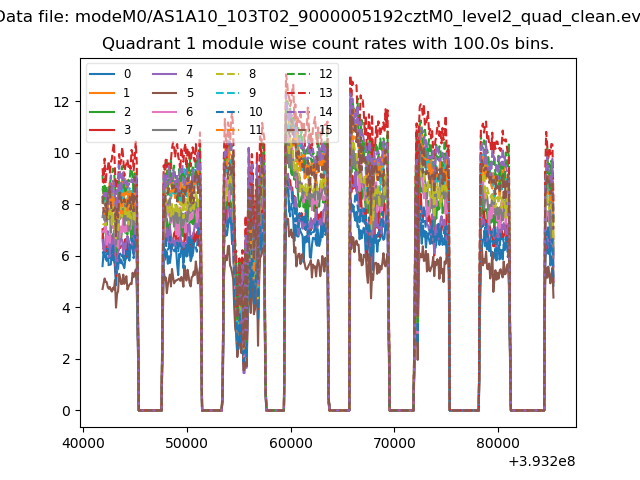
| Module-wise count rates for Quadrant A Data is divided into 100 sec bins |
 |
 |
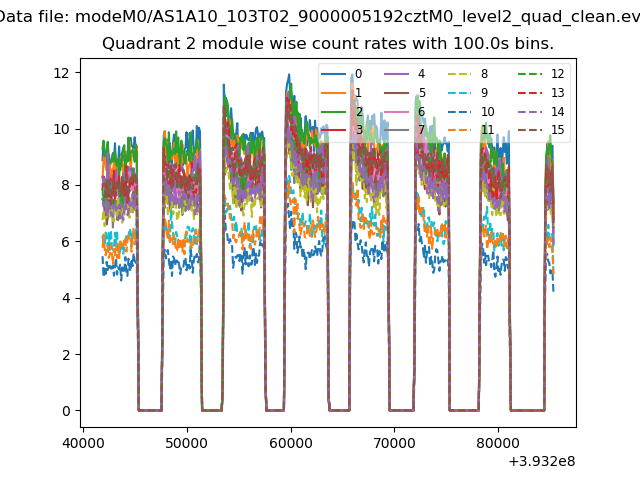
| Module-wise count rates for Quadrant B Data is divided into 100 sec bins |
 |
 |
| Module-wise count rates for Quadrant C Data is divided into 100 sec bins |
 |
 |
| Module-wise count rates for Quadrant D Data is divided into 100 sec bins |
 |
 |
| Parameter | Plot |
|---|---|
| CZT HV Monitor |  |
| D_VDD | 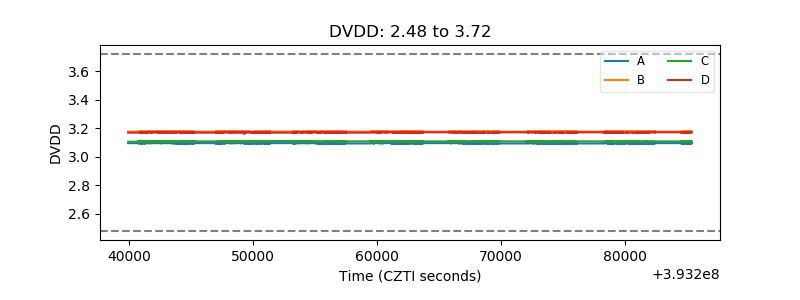 |
| Temperature 1 |  |
| Veto HV Monitor |  |
| Veto LLD |  |
| Alpha Counter |  |
| _CPM_Rate |  |
| CZT Counter |  |
| +2.5 Volts monitor | 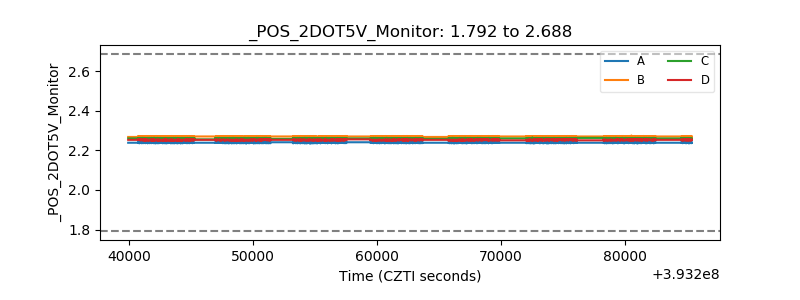 |
| +5 Volts monitor |  |
| _ROLL_ROT |  |
| _Roll_DEC |  |
| _Roll_RA |  |
| Veto Counter |  |