| Param | Original file | Final file |
|---|---|---|
| Filename | modeM0/AS1A11_097T17_9000005194cztM0_level2.fits | modeM0/AS1A11_097T17_9000005194cztM0_level2_quad_clean.evt |
| Size (bytes) | 547,879,680 | 518,690,880 |
| Size | 522.5 MB | 494.7 MB |
| Events in quadrant A | 3,358,474 | 3,105,218 |
| Events in quadrant B | 3,151,696 | 2,992,647 |
| Events in quadrant C | 3,288,132 | 2,986,376 |
| Events in quadrant D | 2,794,810 | 2,625,753 |
| Mode SS | |||
|---|---|---|---|
| Quadrant | BADHDUFLAG | Total packets | Discarded packets |
| A | 0 | 1196 | 0 |
| B | 0 | 1196 | 0 |
| C | 0 | 1196 | 0 |
| D | 0 | 1196 | 0 |
| Mode M0 | |||
|---|---|---|---|
| Quadrant | BADHDUFLAG | Total packets | Discarded packets |
| A | 0 | 121868 | 0 |
| B | 0 | 145784 | 0 |
| C | 0 | 130704 | 0 |
| D | 0 | 164750 | 0 |
| Mode M9 | |||
|---|---|---|---|
| Quadrant | BADHDUFLAG | Total packets | Discarded packets |
| A | 0 | 221 | 0 |
| B | 0 | 221 | 0 |
| C | 0 | 221 | 0 |
| D | 0 | 221 | 0 |
| Quadrant | Total seconds | Saturated seconds | Saturation percentage |
|---|---|---|---|
| A | 58266 | 118 | 0.202519% |
| B | 58266 | 2124 | 3.645351% |
| C | 58264 | 891 | 1.529246% |
| D | 58266 | 2917 | 5.006350% |
Noise dominated data is calculated using 1-second bins in cleaned event files. If a bin has >2000 counts, and if more than 50% of those come from <1% of pixels, then it is considered to be noise-dominated and hence unusable.
| Quadrant | # 1 sec bins | Bins with >0 counts | Bins with >2000 counts | High rate bins dominated by noise | Noise dominated (total time) | Noise dominated (detector-on time) | Marked lightcurve |
|---|---|---|---|---|---|---|---|
| A | 80549 | 58262 | 0 | 0 | 0.00% | 0.00% |  |
| B | 80549 | 58250 | 0 | 0 | 0.00% | 0.00% |  |
| C | 80550 | 58245 | 0 | 0 | 0.00% | 0.00% | 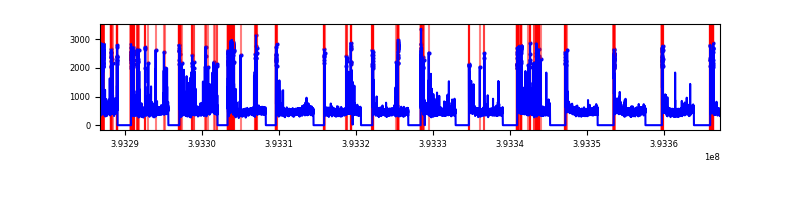 |
| D | 80548 | 58191 | 0 | 0 | 0.00% | 0.00% | 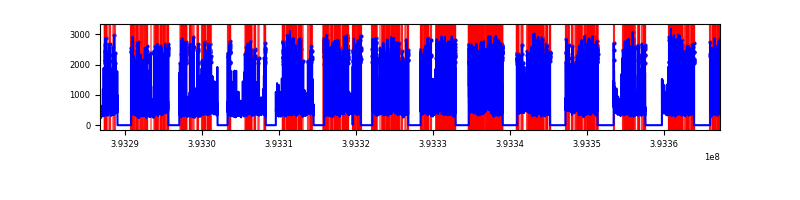 |
Top three noisy pixels from each quadrant. If the there are fewer than three noisy pixels in the level2.evt file, extra rows are filled as -1
| Pixel properties | Quadrant properties | ||||||
|---|---|---|---|---|---|---|---|
| Quadrant | DetID | PixID | Counts | Sigma | Mean | Median | Sigma |
| A | 7 | 110 | 2754 | 9.03 | 876 | 825 | 213.6 |
| A | 9 | 19 | 2715 | 8.85 | 876 | 825 | 213.6 |
| A | 0 | 29 | 2702 | 8.79 | 876 | 825 | 213.6 |
| B | 2 | 9 | 2757 | 11.91 | 833 | 797 | 164.6 |
| B | 3 | 80 | 2419 | 9.85 | 833 | 797 | 164.6 |
| B | 2 | 8 | 2237 | 8.75 | 833 | 797 | 164.6 |
| C | 1 | 81 | 2717 | 8.47 | 867 | 813 | 224.7 |
| C | 1 | 80 | 2607 | 7.98 | 867 | 813 | 224.7 |
| C | 3 | 202 | 2554 | 7.75 | 867 | 813 | 224.7 |
| D | 10 | 189 | 2096 | 6.45 | 799 | 733 | 211.3 |
| D | 10 | 113 | 2092 | 6.43 | 799 | 733 | 211.3 |
| D | 4 | 160 | 2046 | 6.21 | 799 | 733 | 211.3 |
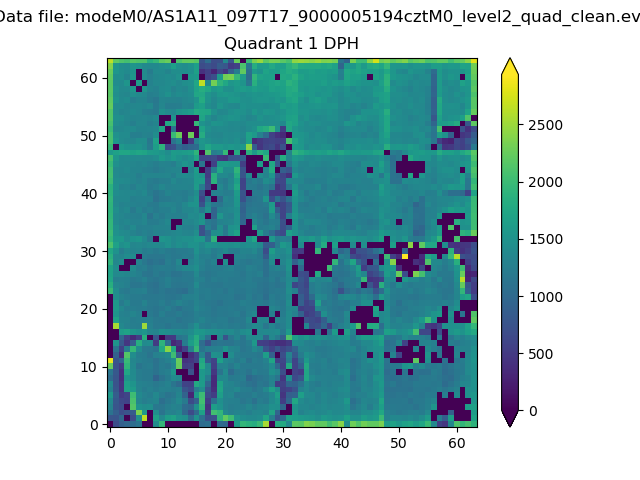
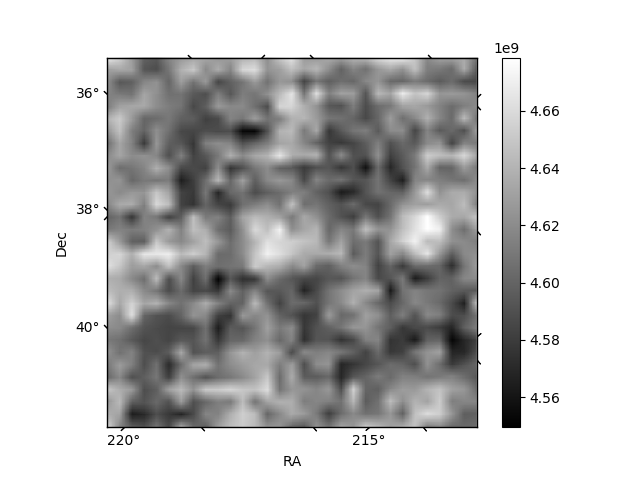
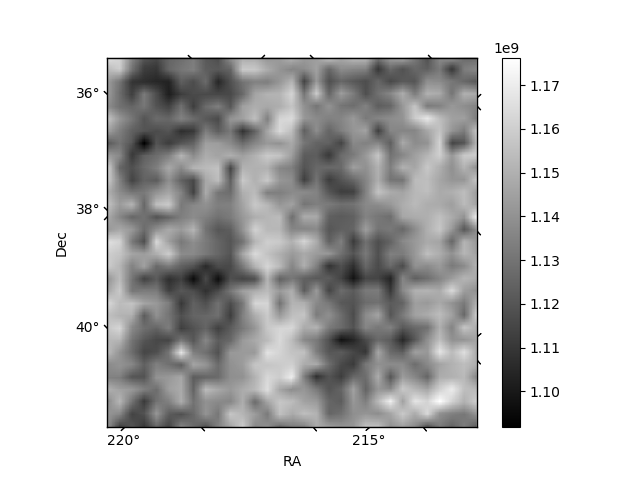
Histogram calculated using DETX and DETY for each event in the final _common_clean file
| Quadrant A |  |
 |
Quadrant B |
|---|---|---|---|
| Quadrant D | 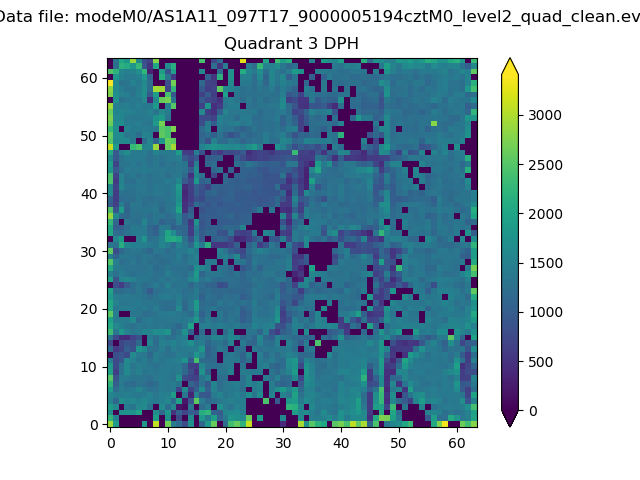 |
 |
Quadrant C |
| Plot type | Count rate plots | Images |
|---|---|---|
| Comparison with Poisson distribution Blue bars denote a histogram of data divided into 1 sec bins. Red curve is a Poisson curve with rate = median count rate of data. |
 |
 |
| Quadrant-wise count rates Data is divided into 100 sec bins |
 |
|
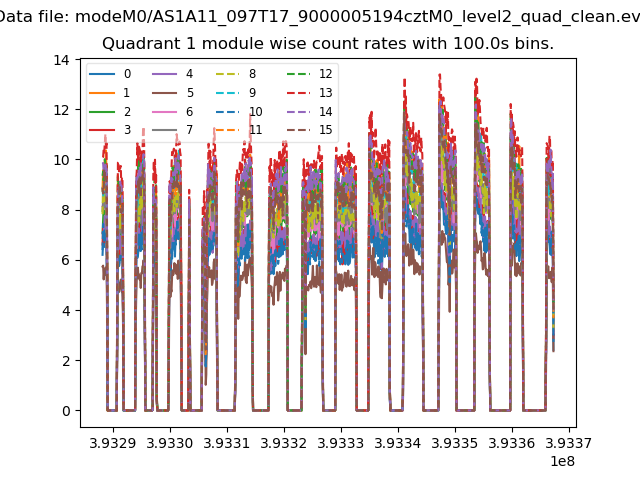
| Module-wise count rates for Quadrant A Data is divided into 100 sec bins |
 |
 |
| Module-wise count rates for Quadrant B Data is divided into 100 sec bins |
 |
 |
| Module-wise count rates for Quadrant C Data is divided into 100 sec bins |
 |
 |
| Module-wise count rates for Quadrant D Data is divided into 100 sec bins |
 |
 |
| Parameter | Plot |
|---|---|
| CZT HV Monitor |  |
| D_VDD |  |
| Temperature 1 |  |
| Veto HV Monitor |  |
| Veto LLD | 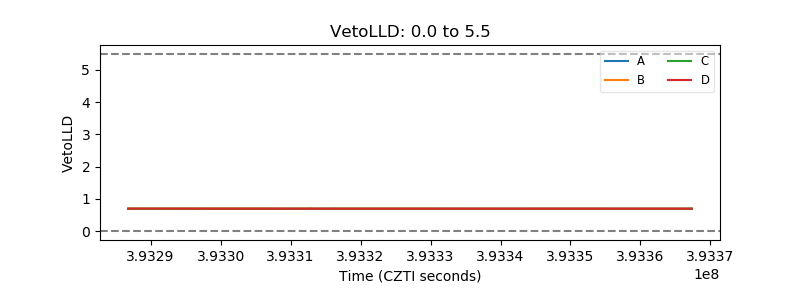 |
| Alpha Counter |  |
| _CPM_Rate |  |
| CZT Counter |  |
| +2.5 Volts monitor |  |
| +5 Volts monitor |  |
| _ROLL_ROT | 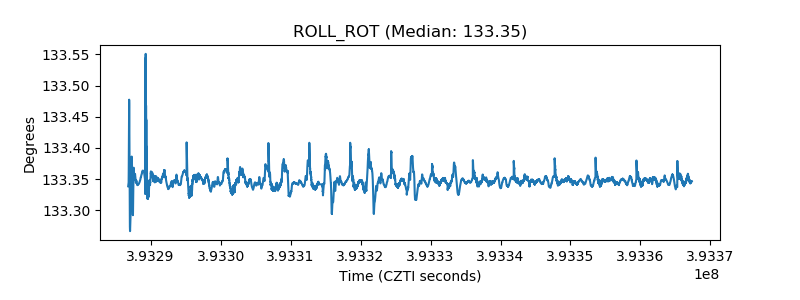 |
| _Roll_DEC |  |
| _Roll_RA | 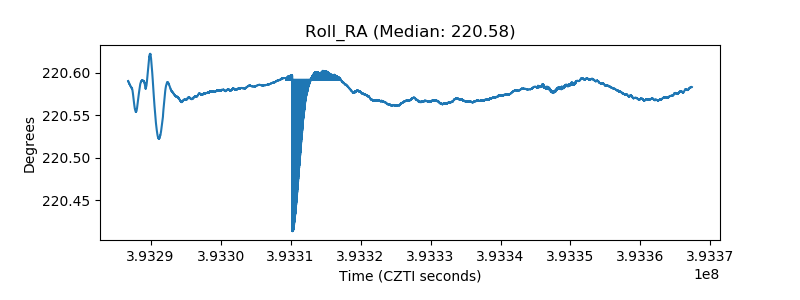 |
| Veto Counter |  |