| Param | Original file | Final file |
|---|---|---|
| Filename | modeM0/AS1A11_097T17_9000005194_36365cztM0_level2.evt | modeM0/AS1A11_097T17_9000005194_36365cztM0_level2_quad_clean.evt |
| Size (bytes) | 103,345,920 | 24,989,760 |
| Size | 98.6 MB | 23.8 MB |
| Events in quadrant A | 639,307 | 166,599 |
| Events in quadrant B | 631,713 | 167,584 |
| Events in quadrant C | 793,315 | 168,042 |
| Events in quadrant D | 975,875 | 158,193 |
| Mode SS | |||
|---|---|---|---|
| Quadrant | BADHDUFLAG | Total packets | Discarded packets |
| A | 0 | 26 | 0 |
| B | 0 | 26 | 0 |
| C | 0 | 26 | 0 |
| D | 0 | 26 | 0 |
| Mode M0 | |||
|---|---|---|---|
| Quadrant | BADHDUFLAG | Total packets | Discarded packets |
| A | 0 | 2748 | 1 |
| B | 0 | 2714 | 1 |
| C | 0 | 3156 | 1 |
| D | 0 | 3756 | 1 |
| Mode M9 | |||
|---|---|---|---|
| Quadrant | BADHDUFLAG | Total packets | Discarded packets |
| A | 0 | 12 | 0 |
| B | 0 | 12 | 0 |
| C | 0 | 12 | 0 |
| D | 0 | 13 | 0 |
| Quadrant | Total seconds | Saturated seconds | Saturation percentage |
|---|---|---|---|
| A | 1275 | 4 | 0.313725% |
| B | 1275 | 2 | 0.156863% |
| C | 1275 | 28 | 2.196078% |
| D | 1275 | 57 | 4.470588% |
Noise dominated data is calculated using 1-second bins in cleaned event files. If a bin has >2000 counts, and if more than 50% of those come from <1% of pixels, then it is considered to be noise-dominated and hence unusable.
| Quadrant | # 1 sec bins | Bins with >0 counts | Bins with >2000 counts | High rate bins dominated by noise | Noise dominated (total time) | Noise dominated (detector-on time) | Marked lightcurve |
|---|---|---|---|---|---|---|---|
| A | 1275 | 1275 | 3 | 3 | 0.24% | 0.24% | 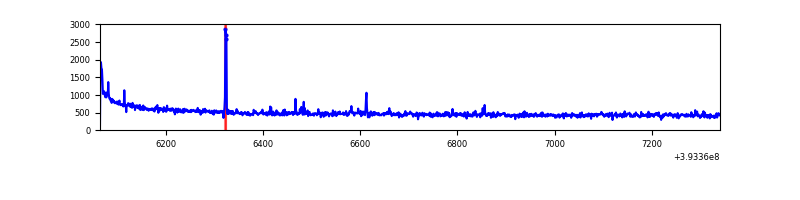 |
| B | 1275 | 1275 | 1 | 1 | 0.08% | 0.08% | 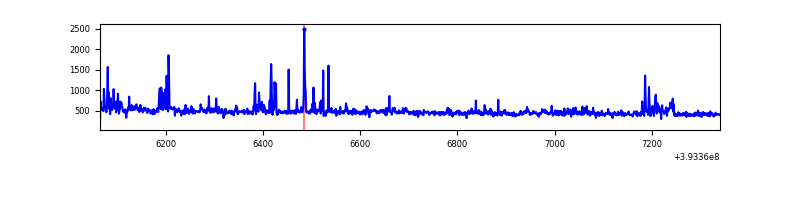 |
| C | 1275 | 1275 | 21 | 21 | 1.65% | 1.65% | 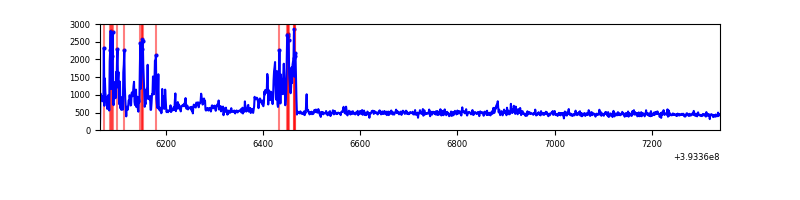 |
| D | 1274 | 1274 | 64 | 64 | 5.02% | 5.02% | 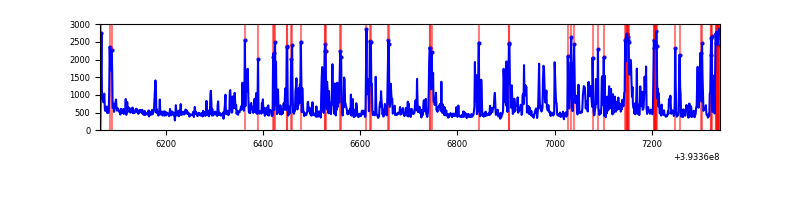 |
Top three noisy pixels from each quadrant. If the there are fewer than three noisy pixels in the level2.evt file, extra rows are filled as -1
| Pixel properties | Quadrant properties | ||||||
|---|---|---|---|---|---|---|---|
| Quadrant | DetID | PixID | Counts | Sigma | Mean | Median | Sigma |
| A | 10 | 83 | 69479 | 2337.35 | 140 | 138 | 29.7 |
| A | 9 | 143 | 15620 | 521.87 | 140 | 138 | 29.7 |
| A | 12 | 189 | 4781 | 156.51 | 140 | 138 | 29.7 |
| B | 5 | 172 | 24248 | 833.24 | 141 | 137 | 28.9 |
| B | 5 | 236 | 15300 | 524.01 | 141 | 137 | 28.9 |
| B | 15 | 85 | 12992 | 444.25 | 141 | 137 | 28.9 |
| C | 0 | 207 | 99259 | 2856.35 | 140 | 142 | 34.7 |
| C | 0 | 10 | 89085 | 2563.15 | 140 | 142 | 34.7 |
| C | 15 | 214 | 58516 | 1682.22 | 140 | 142 | 34.7 |
| D | 12 | 6 | 248650 | 7063.63 | 137 | 133 | 35.2 |
| D | 2 | 153 | 109844 | 3118.33 | 137 | 133 | 35.2 |
| D | 13 | 171 | 37858 | 1072.26 | 137 | 133 | 35.2 |
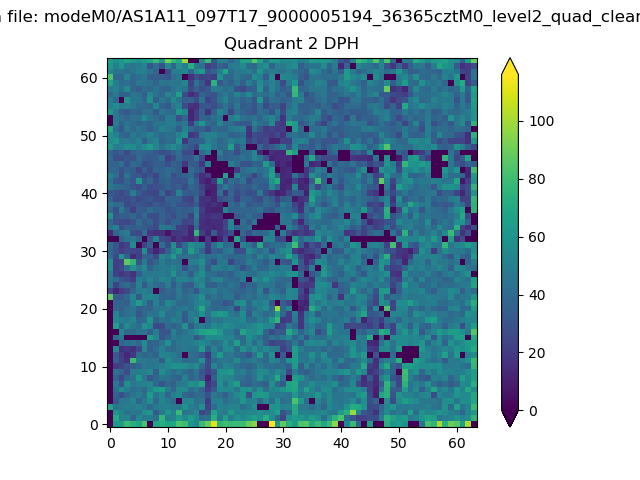
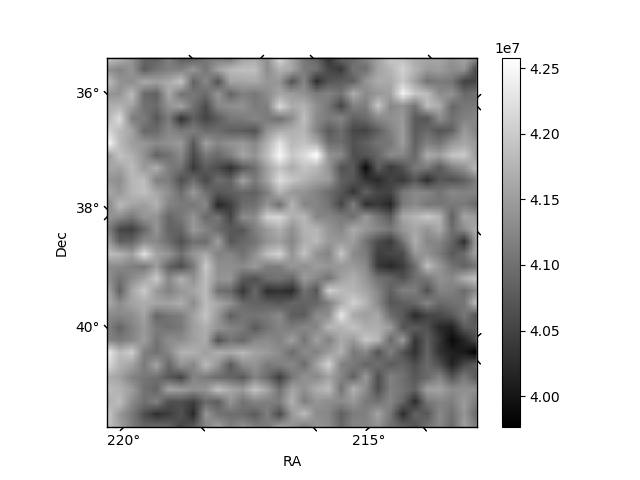
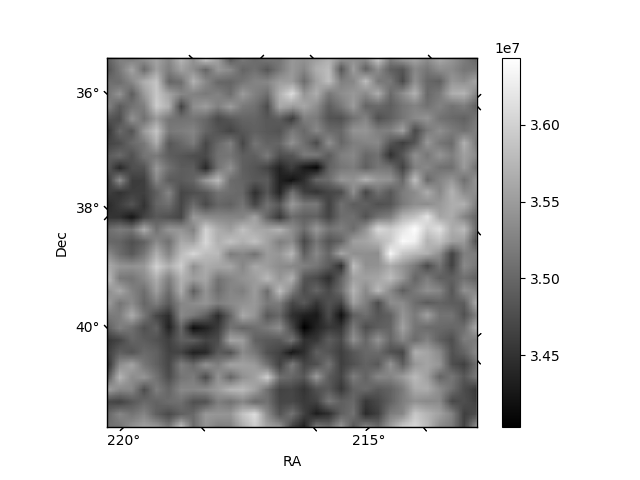
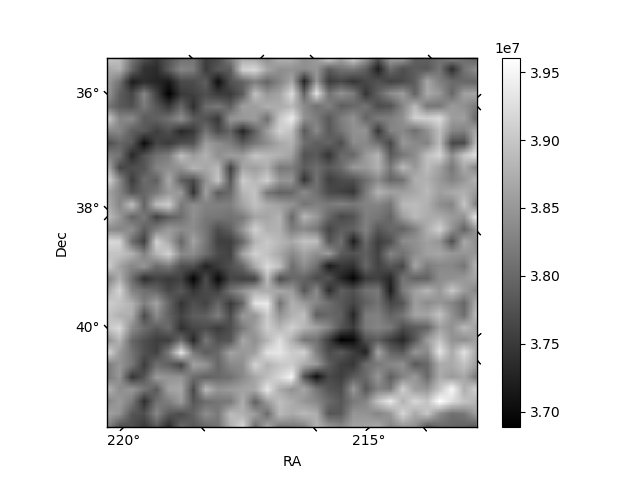
Histogram calculated using DETX and DETY for each event in the final _common_clean file
| Quadrant A | 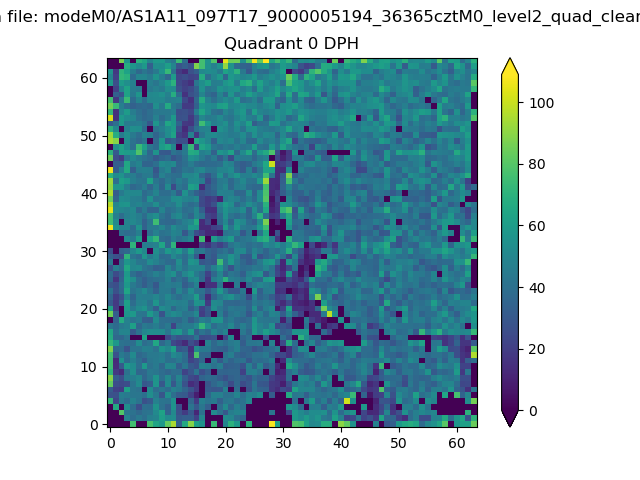 |
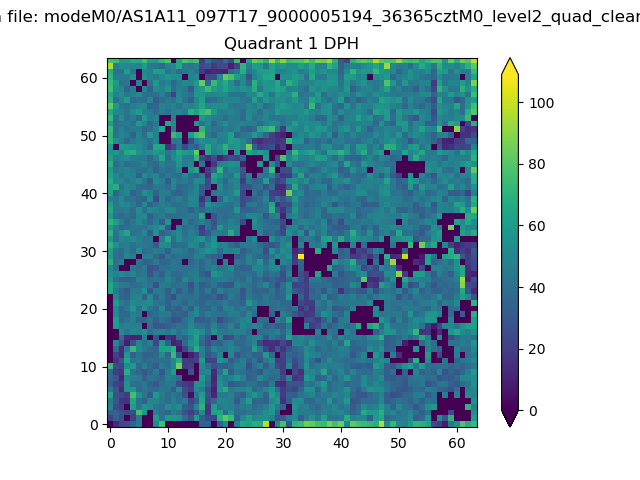 |
Quadrant B |
|---|---|---|---|
| Quadrant D | 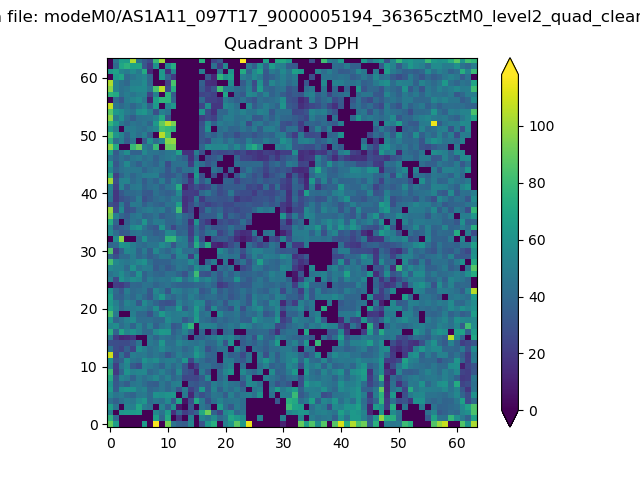 |
 |
Quadrant C |
| Plot type | Count rate plots | Images |
|---|---|---|
| Comparison with Poisson distribution Blue bars denote a histogram of data divided into 1 sec bins. Red curve is a Poisson curve with rate = median count rate of data. |
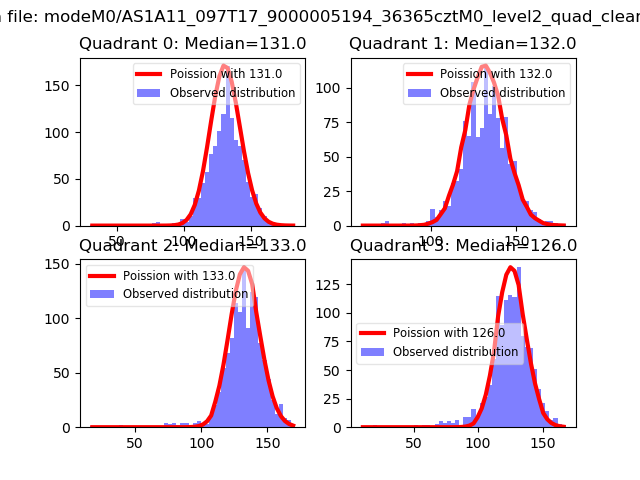 |
 |
| Quadrant-wise count rates Data is divided into 100 sec bins |
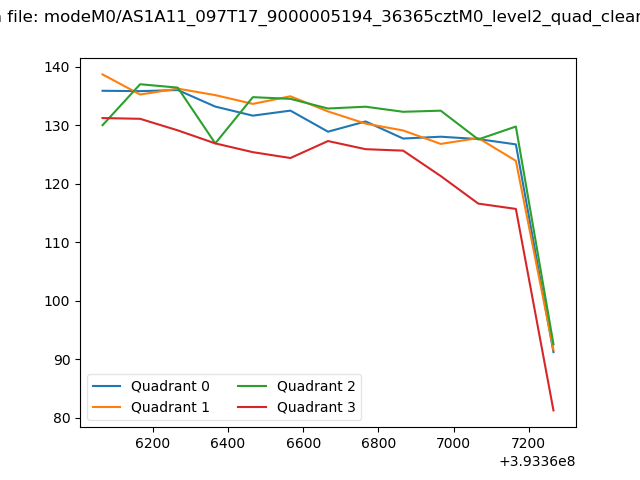 |
|
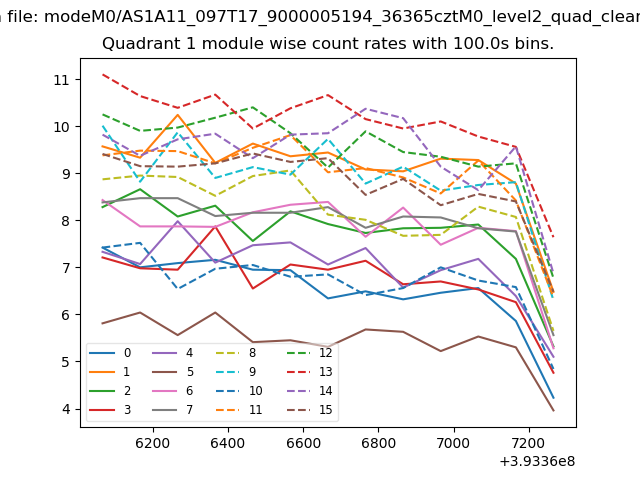
| Module-wise count rates for Quadrant A Data is divided into 100 sec bins |
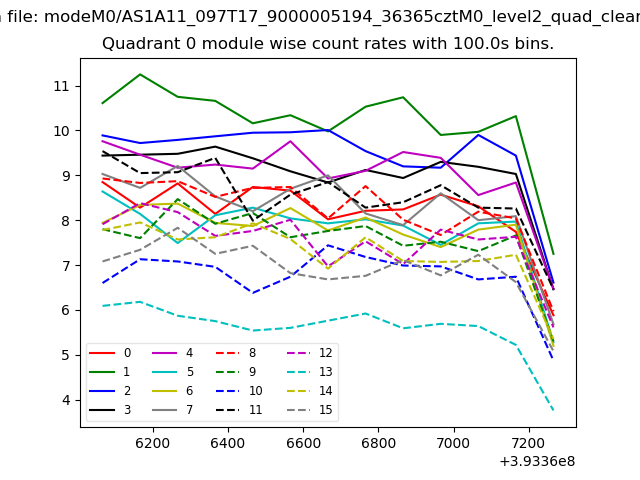 |
 |
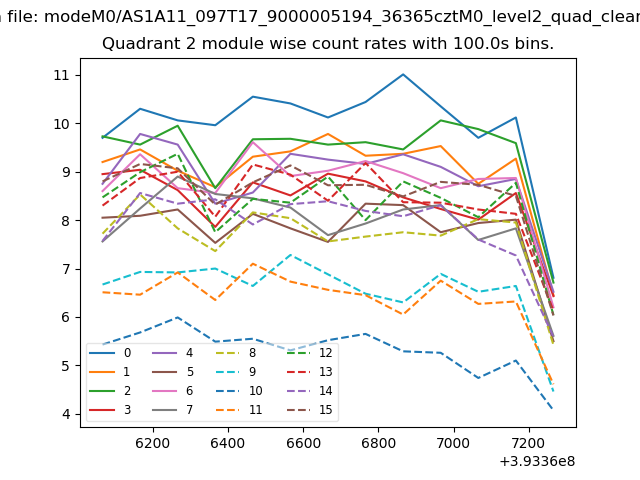
| Module-wise count rates for Quadrant B Data is divided into 100 sec bins |
 |
 |
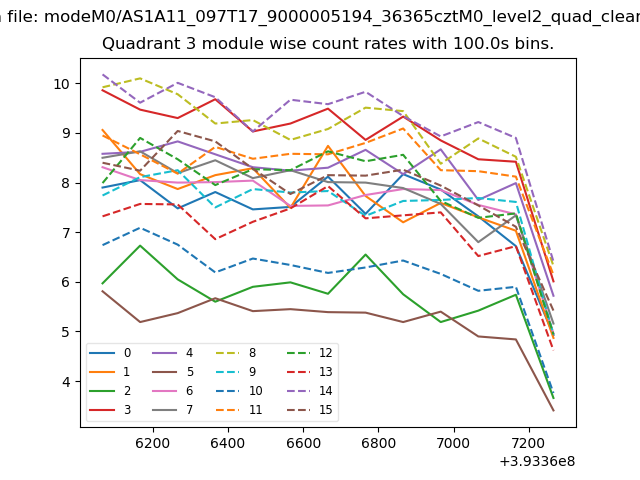
| Module-wise count rates for Quadrant C Data is divided into 100 sec bins |
 |
 |
| Module-wise count rates for Quadrant D Data is divided into 100 sec bins |
 |
 |
| Parameter | Plot |
|---|---|
| CZT HV Monitor | 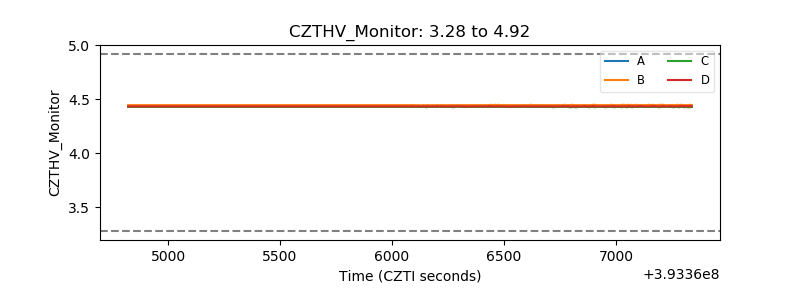 |
| D_VDD | 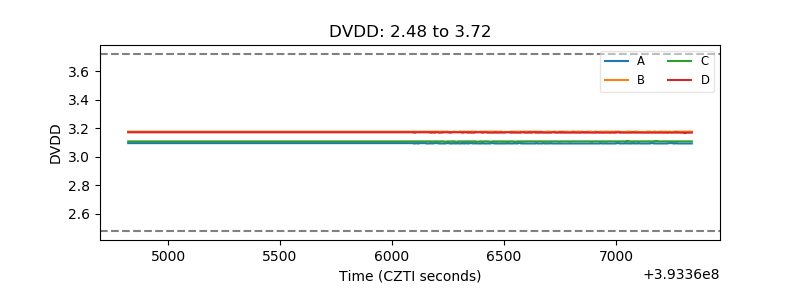 |
| Temperature 1 | 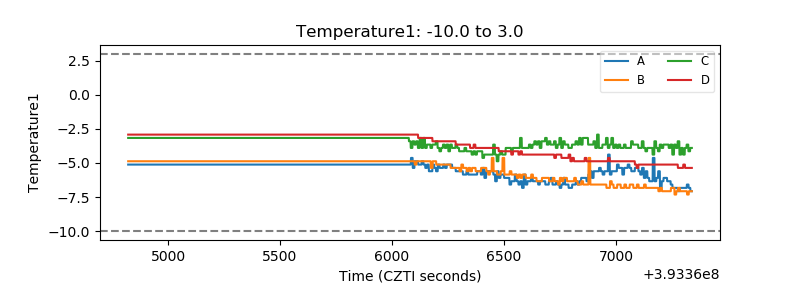 |
| Veto HV Monitor | 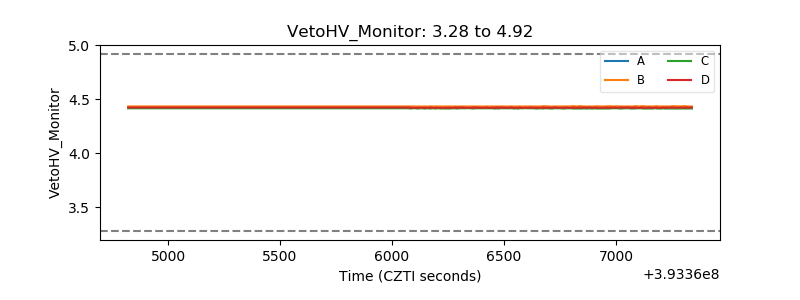 |
| Veto LLD | 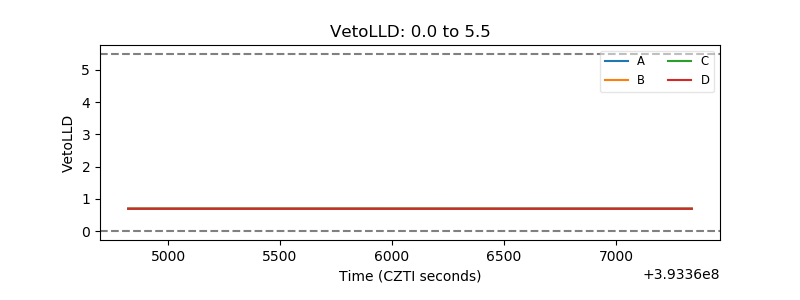 |
| Alpha Counter | 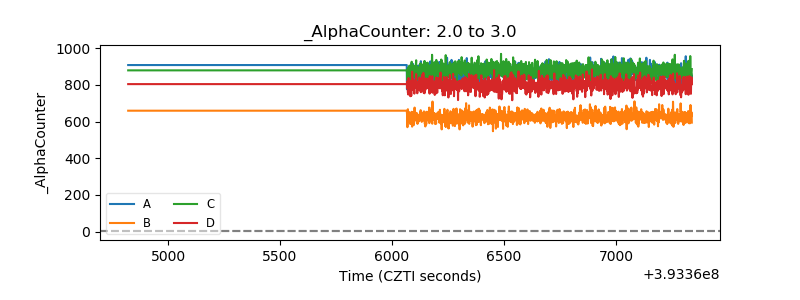 |
| _CPM_Rate | 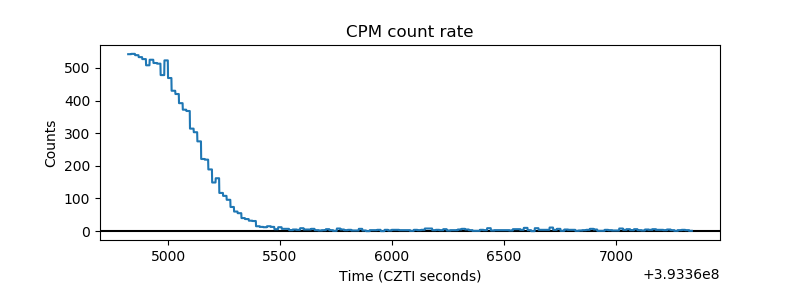 |
| CZT Counter |  |
| +2.5 Volts monitor |  |
| +5 Volts monitor | 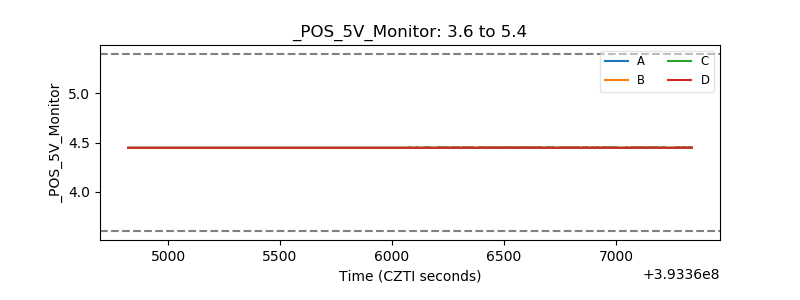 |
| _ROLL_ROT | 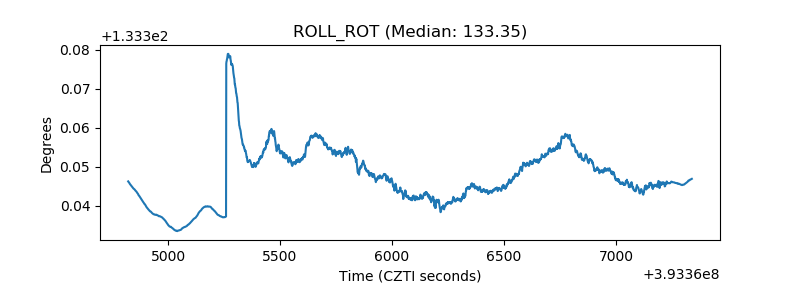 |
| _Roll_DEC | 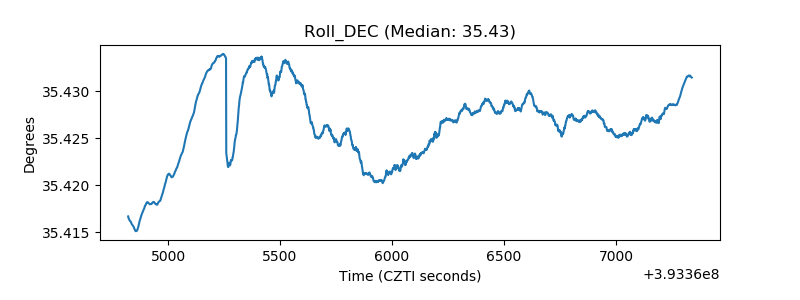 |
| _Roll_RA | 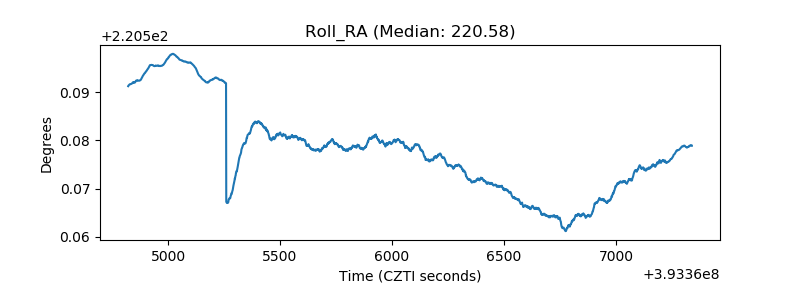 |
| Veto Counter | 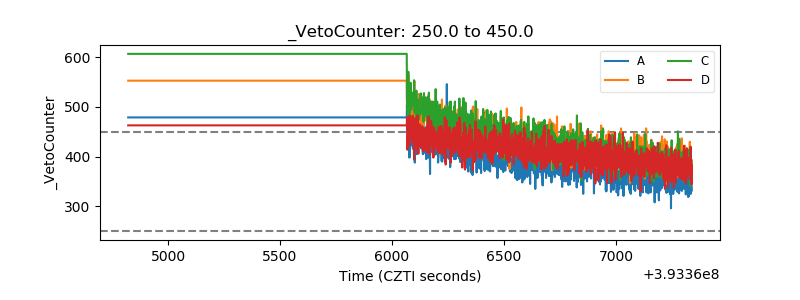 |