| Param | Original file | Final file |
|---|---|---|
| Filename | modeM0/AS1C07_001T08_9000005190cztM0_level2.fits | modeM0/AS1C07_001T08_9000005190cztM0_level2_quad_clean.evt |
| Size (bytes) | 221,636,160 | 289,143,360 |
| Size | 211.4 MB | 275.7 MB |
| Events in quadrant A | 1,326,996 | 1,865,181 |
| Events in quadrant B | 1,229,312 | 1,767,462 |
| Events in quadrant C | 1,315,170 | 1,789,492 |
| Events in quadrant D | 1,127,666 | 1,622,257 |
| Mode M9 | |||
|---|---|---|---|
| Quadrant | BADHDUFLAG | Total packets | Discarded packets |
| A | 0 | 71 | 0 |
| B | 0 | 70 | 0 |
| C | 0 | 70 | 0 |
| D | 0 | 71 | 0 |
| Mode M0 | |||
|---|---|---|---|
| Quadrant | BADHDUFLAG | Total packets | Discarded packets |
| A | 0 | 51353 | 0 |
| B | 0 | 66229 | 0 |
| C | 0 | 52518 | 0 |
| D | 0 | 63748 | 0 |
| Mode SS | |||
|---|---|---|---|
| Quadrant | BADHDUFLAG | Total packets | Discarded packets |
| A | 0 | 508 | 0 |
| B | 0 | 508 | 0 |
| C | 0 | 508 | 0 |
| D | 0 | 508 | 0 |
| Quadrant | Total seconds | Saturated seconds | Saturation percentage |
|---|---|---|---|
| A | 24895 | 62 | 0.249046% |
| B | 24895 | 1316 | 5.286202% |
| C | 24895 | 94 | 0.377586% |
| D | 24895 | 829 | 3.329986% |
Noise dominated data is calculated using 1-second bins in cleaned event files. If a bin has >2000 counts, and if more than 50% of those come from <1% of pixels, then it is considered to be noise-dominated and hence unusable.
| Quadrant | # 1 sec bins | Bins with >0 counts | Bins with >2000 counts | High rate bins dominated by noise | Noise dominated (total time) | Noise dominated (detector-on time) | Marked lightcurve |
|---|---|---|---|---|---|---|---|
| A | 31937 | 24887 | 0 | 0 | 0.00% | 0.00% |  |
| B | 31936 | 24872 | 0 | 0 | 0.00% | 0.00% |  |
| C | 31936 | 24892 | 0 | 0 | 0.00% | 0.00% |  |
| D | 31937 | 24871 | 0 | 0 | 0.00% | 0.00% |  |
Top three noisy pixels from each quadrant. If the there are fewer than three noisy pixels in the level2.evt file, extra rows are filled as -1
| Pixel properties | Quadrant properties | ||||||
|---|---|---|---|---|---|---|---|
| Quadrant | DetID | PixID | Counts | Sigma | Mean | Median | Sigma |
| A | 7 | 110 | 1170 | 9.67 | 346 | 326 | 87.3 |
| A | 0 | 29 | 1068 | 8.5 | 346 | 326 | 87.3 |
| A | 0 | 30 | 1023 | 7.99 | 346 | 326 | 87.3 |
| B | 2 | 9 | 1028 | 10.94 | 326 | 310 | 65.6 |
| B | 3 | 80 | 928 | 9.42 | 326 | 310 | 65.6 |
| B | 3 | 17 | 897 | 8.94 | 326 | 310 | 65.6 |
| C | 1 | 80 | 1125 | 8.66 | 348 | 324 | 92.5 |
| C | 1 | 81 | 1118 | 8.58 | 348 | 324 | 92.5 |
| C | 1 | 65 | 919 | 6.43 | 348 | 324 | 92.5 |
| D | 10 | 189 | 846 | 6.21 | 322 | 292 | 89.2 |
| D | 6 | 62 | 819 | 5.91 | 322 | 292 | 89.2 |
| D | 7 | 3 | 801 | 5.7 | 322 | 292 | 89.2 |
Histogram calculated using DETX and DETY for each event in the final _common_clean file
| Quadrant A |  |
 |
Quadrant B |
|---|---|---|---|
| Quadrant D | 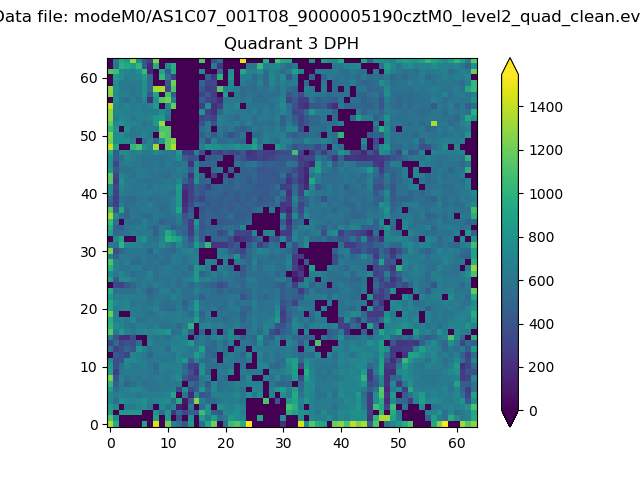 |
 |
Quadrant C |
| Plot type | Count rate plots | Images |
|---|---|---|
| Comparison with Poisson distribution Blue bars denote a histogram of data divided into 1 sec bins. Red curve is a Poisson curve with rate = median count rate of data. |
 |
 |
| Quadrant-wise count rates Data is divided into 100 sec bins |
 |
|
| Module-wise count rates for Quadrant A Data is divided into 100 sec bins |
 |
 |
| Module-wise count rates for Quadrant B Data is divided into 100 sec bins |
 |
 |
| Module-wise count rates for Quadrant C Data is divided into 100 sec bins |
 |
 |
| Module-wise count rates for Quadrant D Data is divided into 100 sec bins |
 |
 |
| Parameter | Plot |
|---|---|
| CZT HV Monitor |  |
| D_VDD |  |
| Temperature 1 |  |
| Veto HV Monitor |  |
| Veto LLD |  |
| Alpha Counter |  |
| _CPM_Rate |  |
| CZT Counter |  |
| +2.5 Volts monitor |  |
| +5 Volts monitor |  |
| _ROLL_ROT |  |
| _Roll_DEC |  |
| _Roll_RA |  |
| Veto Counter |  |