| Param | Original file | Final file |
|---|---|---|
| Filename | modeM0/AS1A11_097T24_9000005196cztM0_level2.fits | modeM0/AS1A11_097T24_9000005196cztM0_level2_quad_clean.evt |
| Size (bytes) | 991,272,960 | 961,827,840 |
| Size | 945.4 MB | 917.3 MB |
| Events in quadrant A | 6,113,528 | 5,900,441 |
| Events in quadrant B | 5,645,150 | 5,569,057 |
| Events in quadrant C | 5,975,406 | 5,523,406 |
| Events in quadrant D | 5,004,018 | 4,859,927 |
| Mode SS | |||
|---|---|---|---|
| Quadrant | BADHDUFLAG | Total packets | Discarded packets |
| A | 0 | 2172 | 0 |
| B | 0 | 2172 | 0 |
| C | 0 | 2172 | 0 |
| D | 0 | 2172 | 0 |
| Mode M9 | |||
|---|---|---|---|
| Quadrant | BADHDUFLAG | Total packets | Discarded packets |
| A | 0 | 380 | 0 |
| B | 0 | 380 | 0 |
| C | 0 | 380 | 0 |
| D | 0 | 380 | 0 |
| Mode M0 | |||
|---|---|---|---|
| Quadrant | BADHDUFLAG | Total packets | Discarded packets |
| A | 0 | 241071 | 0 |
| B | 0 | 300447 | 0 |
| C | 0 | 245109 | 0 |
| D | 0 | 314861 | 0 |
| Quadrant | Total seconds | Saturated seconds | Saturation percentage |
|---|---|---|---|
| A | 106143 | 2243 | 2.113187% |
| B | 106143 | 8493 | 8.001470% |
| C | 106143 | 1953 | 1.839971% |
| D | 106143 | 7697 | 7.251538% |
Noise dominated data is calculated using 1-second bins in cleaned event files. If a bin has >2000 counts, and if more than 50% of those come from <1% of pixels, then it is considered to be noise-dominated and hence unusable.
| Quadrant | # 1 sec bins | Bins with >0 counts | Bins with >2000 counts | High rate bins dominated by noise | Noise dominated (total time) | Noise dominated (detector-on time) | Marked lightcurve |
|---|---|---|---|---|---|---|---|
| A | 144224 | 106074 | 0 | 0 | 0.00% | 0.00% |  |
| B | 144224 | 106044 | 0 | 0 | 0.00% | 0.00% |  |
| C | 144224 | 106127 | 0 | 0 | 0.00% | 0.00% |  |
| D | 144224 | 105527 | 0 | 0 | 0.00% | 0.00% | 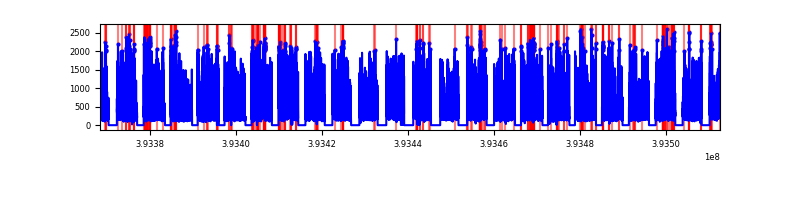 |
Top three noisy pixels from each quadrant. If the there are fewer than three noisy pixels in the level2.evt file, extra rows are filled as -1
| Pixel properties | Quadrant properties | ||||||
|---|---|---|---|---|---|---|---|
| Quadrant | DetID | PixID | Counts | Sigma | Mean | Median | Sigma |
| A | 7 | 110 | 5110 | 9.33 | 1596 | 1503 | 386.6 |
| A | 9 | 19 | 5003 | 9.05 | 1596 | 1503 | 386.6 |
| A | 0 | 29 | 4904 | 8.8 | 1596 | 1503 | 386.6 |
| B | 2 | 9 | 4930 | 11.95 | 1493 | 1424 | 293.3 |
| B | 3 | 80 | 4315 | 9.86 | 1493 | 1424 | 293.3 |
| B | 5 | 128 | 3995 | 8.77 | 1493 | 1424 | 293.3 |
| C | 1 | 81 | 4815 | 8.23 | 1576 | 1476 | 405.5 |
| C | 1 | 80 | 4731 | 8.03 | 1576 | 1476 | 405.5 |
| C | 3 | 202 | 4598 | 7.7 | 1576 | 1476 | 405.5 |
| D | 7 | 3 | 3703 | 6.28 | 1436 | 1308 | 381.5 |
| D | 10 | 113 | 3651 | 6.14 | 1436 | 1308 | 381.5 |
| D | 10 | 189 | 3599 | 6.0 | 1436 | 1308 | 381.5 |
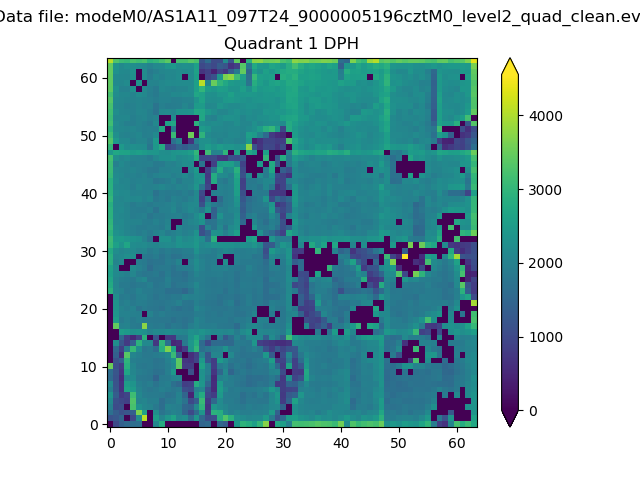
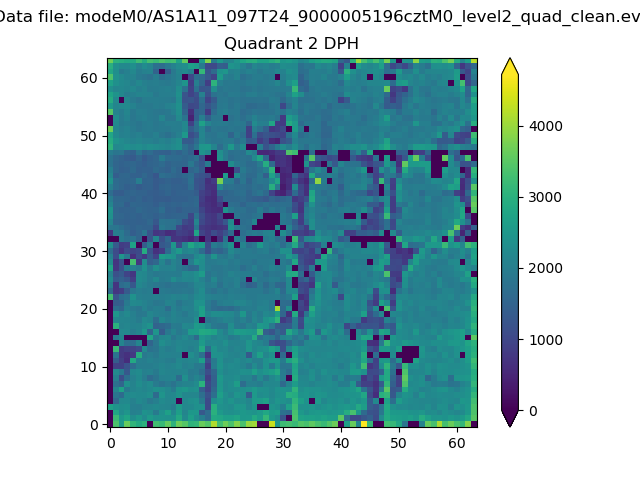
Histogram calculated using DETX and DETY for each event in the final _common_clean file
| Quadrant A |  |
 |
Quadrant B |
|---|---|---|---|
| Quadrant D | 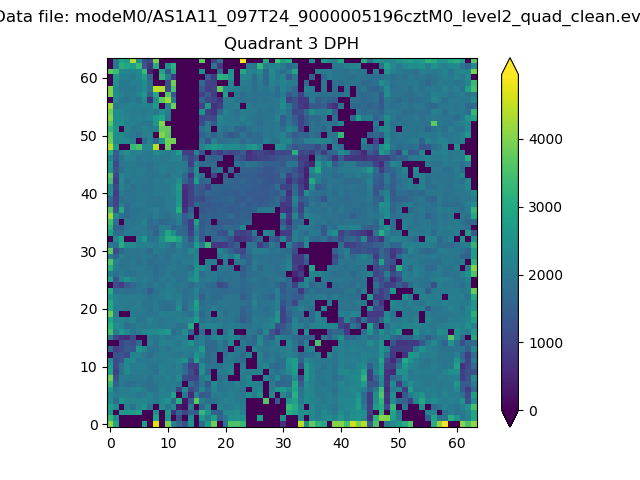 |
 |
Quadrant C |
| Plot type | Count rate plots | Images |
|---|---|---|
| Comparison with Poisson distribution Blue bars denote a histogram of data divided into 1 sec bins. Red curve is a Poisson curve with rate = median count rate of data. |
 |
 |
| Quadrant-wise count rates Data is divided into 100 sec bins |
 |
|
| Module-wise count rates for Quadrant A Data is divided into 100 sec bins |
 |
 |
| Module-wise count rates for Quadrant B Data is divided into 100 sec bins |
 |
 |
| Module-wise count rates for Quadrant C Data is divided into 100 sec bins |
 |
 |
| Module-wise count rates for Quadrant D Data is divided into 100 sec bins |
 |
 |
| Parameter | Plot |
|---|---|
| CZT HV Monitor |  |
| D_VDD |  |
| Temperature 1 |  |
| Veto HV Monitor |  |
| Veto LLD |  |
| Alpha Counter |  |
| _CPM_Rate |  |
| CZT Counter |  |
| +2.5 Volts monitor |  |
| +5 Volts monitor |  |
| _ROLL_ROT |  |
| _Roll_DEC |  |
| _Roll_RA |  |
| Veto Counter |  |